 Open Access Article
Creative Commons Attribution 3.0 Unported Licence
Identifying the ideal thermodynamics of non-stoichiometric oxygen-carrier materials for chemical looping water-gas shift†
M. Selim Ungut,
Ian S. Metcalfe and
Wenting Hu
 *
*
School of Engineering, Newcastle University, Newcastle upon Tyne NE1 7RU, UK. E-mail: wenting.hu@newcastle.ac.uk
First published on 15th January 2025
Abstract
With the growth in importance of H2 both industrially and as a potential energy vector along the pathway to achieving future environmental sustainability, there is an increasing need for cleaner and more efficient methods of H2 production. One promising short-term solution is to perform the water-gas shift reaction for H2 production in a chemical looping reactor to produce separate H2 and CO2 streams, thereby reducing equipment size and the cost of downstream CO2 separation. Non-stoichiometric perovskite oxides have been identified as promising oxygen carrier materials (OCMs) for the chemical looping water-gas shift (CLWGS) process as they can be engineered to allow rapid oxygen uptake kinetics, and also benefit from a thermodynamic advantage allowing higher conversions than that of conventional mixed feed reactor systems at the same temperature. The relationship between the oxygen non-stoichiometry of the solid OCM and the equilibrium oxygen partial pressure of the gas phase streams plays an important role in determining the gas conversions and usable oxygen capacity of the OCM. In this work, an optimal relationship between the two material properties in a thermodynamically limited system is proposed, and an equilibrium packed-bed reactor model is used for validation. The effect on conversions was investigated by varying the thermodynamics of the non-stoichiometric material relative to the proposed optimal case. More generally, an analogue of the pinch analysis can be used to analyse chemical looping water-gas shift reactions and similar processes.
1. Introduction
Of the current H2 manufacturing processes, the steam reforming process (particularly of natural gas or methane), followed by the water-gas shift (WGS) reaction is the most well-known. About 50% of global H2 production is via this method and it has a high level of industrial maturity, being in use since the late 1920s.1,2 For production of high quality pure H2 gas however, the CO2 by-product of the WGS reaction must be removed by a separation process, usually pressure swing adsorption, which can add to the final production costs. In addition, the use of multiple reactors at different temperatures requires careful heat integration and the use of specialised catalysts.3,4The chemical looping water-gas shift (CLWGS) process is an alternative technology that can replace the conventional WGS stage of steam methane reforming. In the CLWGS process, temporally separate gaseous H2O and CO/syngas feeds are passed over a suitable solid oxygen carrier material (OCM) to produce unmixed H2 and CO2 product streams5–9 as demonstrated for a packed-bed reactor in Fig. 1. The mixed gas-phase WGS reaction (eqn (1)) is split into two separate reactions: an oxidation reaction (eqn (2)) where steam oxidises the OCM resulting in H2 being produced, and a reduction reaction (eqn (3)) where CO reduces the OCM thereby producing high purity CO2. Here, the OCM is represented as a generic oxide of the form MOx.
| Principal reaction: CO + H2O ⇌ CO2 + H2 | (1) |
| Split reactions with OCM: MOx−m + mH2O ⇌ MOx + mH2 (Oxidation of OCM) | (2) |
| MOx + mCO ⇌ MOx−m + mCO2 (Reduction of OCM) | (3) |
The choice of OCM plays a key role in the performance of CLWGS reactor systems.10 Iron oxide has been widely researched for use; it is relatively cheap and has a high oxygen capacity between oxidised and reduced phases.5,11–13 However, there are several problems encountered in practice. Iron oxide is a material that exhibits phase changes and oxygen transfer only occurs at fixed chemical potentials. This limits the conversions of the gaseous reactants. For example, the maximum conversion of H2O through CLWGS at 1093 K is limited to ∼67% by the metallic iron/wüstite phase transition, and the maximum conversion of CO is limited to ∼67% by the wüstite/magnetite phase transition.14,15 In addition, the thermal deactivation of iron oxide due to agglomeration and sintering after only a few redox cycles between haematite and metallic iron states has also been reported,11 which leads to poor oxygen exchange kinetics and hence low levels of H2 production. This degradation is often mitigated by mixing iron oxide with a support material. Even though the oxygen capacity per mass of the material decreases (typically by a factor of 2–3), high activity can be maintained over time, which is more beneficial to the process.
More recently, research has been carried out into the use of non-stoichiometric perovskite OCMs of the form ABO3−δ, particularly with the family of strontium doped lanthanum ferrites, La1−xSrxFeO3−δ (0 ≤ x ≤1).8,16–18 In contrast to iron oxide, these OCMs have fast oxygen exchange kinetics between the gas phase and the bulk of the solid phase due to good ionic and electronic conductivities19–21 and thus do not require high specific surface area to operate efficiently. In fact, studies have shown that during CLWGS, La0.7Sr0.3FeO3−δ can remain single phase for over 100 cycles under isothermal conditions at 1123 K without any noticeable drop in conversions to H2.18 This long-term stability of the material is important for industrial scale application.
The fast oxygen transport kinetics of perovskites also leads to the CLWGS process largely being controlled by the gas–solid equilibria of eqn (2) and (3).22–24 These equilibria can be quantified by the chemical potential of oxygen, or equivalently, the equilibrium virtual oxygen partial pressure (pO2), of the system. In the case of non-stoichiometric perovskites like La1−xSrxFeO3−δ, the equilibrium pO2 varies continuously with the oxygen non-stoichiometry of the solid, δ, in addition to the process temperature.21,25,26 It has been previously demonstrated that this continuous δ–pO2 relationship, rather than distinct phase changes at fixed pO2, is crucial for the production of high purity H2 on a wet basis at high temperatures.9,23,27 This needs to be exploited in conjunction with a packed-bed CLWGS reactor or moving bed reactor system where the spatial variation of pO2 can be preserved to overcome the chemical equilibrium limitations associated with both the conventional WGS, and a chemical-looping system using stoichiometric OCMs. So far, most of the non-stoichiometric OCMs investigated are transition metal perovskites such as La1−xSrxFe1−yMnyO3−δ,28,29 La1−xSrxCrO3−δ,30 and La1−xSrxCoO3−δ;31 but non-perovskite metal oxides may also exhibit significant variable non-stoichiometry, e.g. cerium-zirconium oxides (Ce1−xZrxO2−δ).32
Another important difference between stoichiometric and non-stoichiometric OCMs is the maximum amount of oxygen available in eqn (2) and (3). For stoichiometric OCMs, the oxygen available is determined by the difference in oxygen stoichiometry between the oxidised and reduced phases. In the case of non-stoichiometric OCMs, this depends on the difference in the degree of oxygen non-stoichiometry at pO2 values corresponding to the oxidising and reducing gas streams instead. Furthermore, the purity of gas products depends only on the pO2 at which the relevant solid phase transitions occur for stoichiometric OCMs in the thermodynamic limit. Analysis is more complex, and to date unexplored, for the non-stoichiometric case because the δ–pO2 relationship over the entire range of pO2 relevant to the WGS reaction (rather than just the end states) is important.
In this work, the importance of the solid phase δ–pO2 relationship to the CLWGS process is investigated. An optimal δ–pO2 relationship for a hypothetical non-stoichiometric OCM is postulated and verified using the 1-dimensional pseudo-homogenous packed-bed reactor model developed by de Leeuwe et al.24 to assess the impact of the δ–pO2 relationships of the solid phase on the conversions to H2 and CO2 products.
2. Defining an ideal non-stoichiometric oxygen-carrier material
An ideal non-stoichiometric OCM would exhibit a large change in oxygen content within the range of gas phase pO2 relevant to the CLWGS reaction equilibrium where most of the conversion occurs. The virtual pO2 of the gas phase during reduction and oxidation steps may be quantified assuming the following gas phase equilibria, respectively,| H2O ⇌ H2 + 1/2O2 | (4) |
| CO + 1/2O2 ⇌ CO2 | (5) |
 | (6) |
 | (7) |
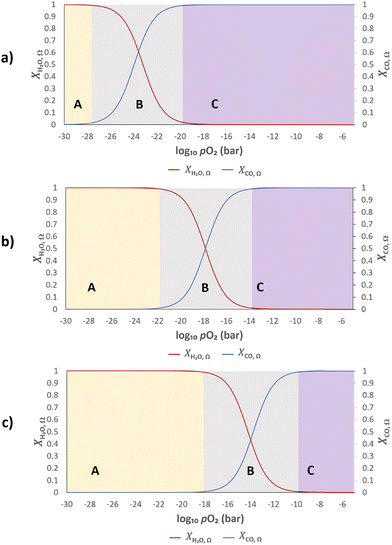
Assuming further that the kinetics of the gas–solid reactions (eqn (2) and (3)) are fast, the gas and solid will rapidly exchange oxygen on contact, and establish a common oxygen potential, or pO2. The extent of oxygen exchange is then controlled by the thermodynamics of both the gas and solid. Therefore, it is desirable that most of the available oxygen from the solid resides in a pO2 range corresponding to region B in Fig. 2, so that high conversions of both CO and H2O can be achieved.
The relative oxygen capacity between the gas phase and solid phase can be represented by a dimensionless number, λO, defined as the ratio of usable solid phase oxygen capacity to gas phase oxygen capacity per half cycle in eqn (8),
 | (8) |
When λO ≫ 1, the gas phase is the limiting reactant, and the conversion of CO or H2O will be largely limited by chemical equilibrium; when λO ≪ 1, the solid phase is the limiting reactant, and the conversion of the gas will be limited by the oxygen capacity of the solid. Here, the optimal δ–pO2 relationship for a non-stoichiometric OCM for CLWGS at any given temperature is defined to be one that gives the highest possible conversion at λO = 1. It is postulated (and verified later in this work) that such a relationship would have a shape matching as closely as possible that of the gas-phase equilibria plotted in Fig. 2 (when scaled by the amount of oxygen available, δmax–δmin) in the range where the change in conversion is significant, and centred around the pO2 where XH2O,Ω = XCO,Ω. The mathematical representation of the optimal cases is presented as follows.
At 1093 K, the WGS equilibrium is close to unity, therefore
 | (9) |
The solid phase δ–pO2 relationship can be closely approximated to the shapes of the gas phase conversion curves using a logistic function, with two adjustable parameters, as described in eqn (10).
 | (10) |
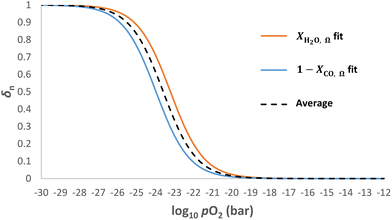
At temperatures other than 1093 K, XH2O,Ω(pO2) ≠ 1 − XCO,Ω(pO2), and the consequence of this will be examined further in the results section. In short, the optimal δ(pO2) in this case should be such that δn is equidistant from XH2O,Ω(pO2) and 1 − XCO,Ω(pO2).
3. CLWGS reactor model
An ideal packed-bed reactor model is used to evaluate the influence of the thermodynamics of the non-stoichiometric OCM on the gas phase conversion of CLWGS. The model used here follows that described by de Leeuwe et al.24 To summarise, a pseudo-homogeneous model is used to represent a packed-bed reactor under isothermal conditions, and without mass transport limitations. The effects of axial dispersion and radial gradients are ignored as they provided minimal improvement to results and do not justify the ∼20 times increase in computation time.24 It is assumed that the kinetics of the gas–solid reactions are very fast, and the reactions are thermodynamically limited; and possible side reactions such as the reverse Boudouard reaction do not occur.The packed-bed reactor is cyclically fed with an equimolar flow of CO or H2O in reverse flow configuration for the reduction and oxidation of the OCM, respectively. The mass balance of the system is described by the following system of equations,
 | (11) |
 | (12) |
 | (13) |
 | (14) |
| yH2 + yH2O = yHconstant Hydrogen balance | (15) |
| yCO + yCO2 = yCconstant Carbon balance | (16) |
 , via eqn (11) and (12), respectively; yi represents the mole fraction of species i in the gas phase. The total mole fraction of hydrogen containing species (yHconstant) and that of the carbon containing species (yCconstant) are invariant in the system due to the assumption of no axial dispersion and that there is no carbon deposition. For the purposes of this work, both are set to 5%, corresponding to the experimental conditions used in de Leeuwe et al.24
Furthermore, for an equilibrium limited process at constant temperature and pressure, the change in solid oxygen content can be linked to the change in the gas phase mole fractions.
 | (17) |
 | (18) |
 and
and  are derived from eqn (6) and (7), and are given as follows.
 | (19) |
 | (20) |
The pO2 of the inlet streams are ill defined due to the lack of any H2 or CO2 in the normal composition of the inlet gases. Instead, the pO2 of these streams are approximated as the equilibrium pO2 of water splitting and CO disproportionation at the reaction temperature, respectively. This results in a very small amount of H2 and CO2 being present in the inlet streams. This will not influence the mass balance appreciably, whilst provide a well-defined boundary condition for the problem (pO2 ∼ 10−8 bar for the H2O stream and ∼10−23 bar for the CO stream at 1073 K). For the initial condition used for each half cycle, the pO2 values across the packed bed at the start of the given half cycle (e.g. reduction) were set to be the same as those from the end of the previous half cycle (oxidation) by using eqn (6) or (7). These approximations do not change the oxygen balance of the system appreciably due to the system operating at very low pO2 values.23,24 For the first half cycle, an arbitrary initial condition (pO2 of solids = pO2 of the CO inlet stream) was used. This choice is inconsequential here since only the results at cyclic steady state are of interest.
4. Results
Validation of optimal δ–pO2 relationship at 1093 K
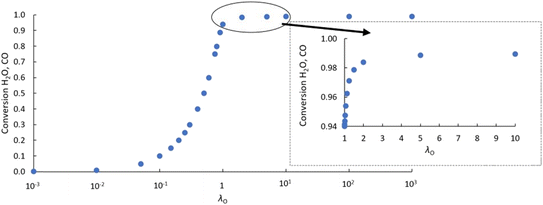
As an initial validation, the reactor model was run using both a δ–pO2 relationship according to eqn (9), which is linked to the analytical equilibrium gas phase expressions (given in eqn (6) and (7)), and the approximation using the logistic function (eqn (10)). Identical results were obtained within at least 3 significant figures, so further manipulation of the relationship was performed through the logistic function only.The results in Fig. 3 show that with the postulated optimal δ–pO2 relationship, XCO and XH2O approach 1 asymptotically as λO → ∞. The conversion when λO = 1 is ∼94%. It increases by ∼4.5% when increasing the value of λO from 1 to 2, and by a further ∼0.4% when increasing λO from 2 to 10. Therefore, it is not worth increasing λO much further beyond a value of ∼2 because the increase in product purity is too low.
It is worth noting that the values of XCO and XH2O are only dependent on the values of log10![[thin space (1/6-em)]](https://www.rsc.org/images/entities/char_2009.gif) pO2mid, kgrad and λO used in eqn (9). Any combination of δred–δox, FO, t and NOCM can be used to give the same value of λO without altering XCO and XH2O. Importantly, any deviation from the optimal values of log10
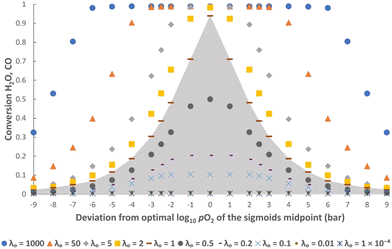
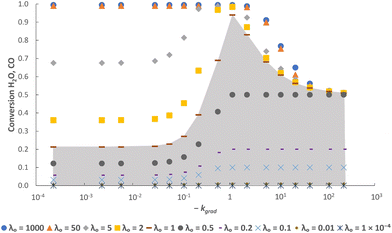
pO2mid, kgrad and λO used in eqn (9). Any combination of δred–δox, FO, t and NOCM can be used to give the same value of λO without altering XCO and XH2O. Importantly, any deviation from the optimal values of log10![[thin space (1/6-em)]](https://www.rsc.org/images/entities/char_2009.gif) pO2mid and kgrad (i.e. those leading to eqn (9) closely matching eqn (6) and (7)) leads to a decrease in XCO and XH2O at cyclic steady state, thus validating the postulation posed. Fig. 4 shows this for different values of log10
pO2mid and kgrad (i.e. those leading to eqn (9) closely matching eqn (6) and (7)) leads to a decrease in XCO and XH2O at cyclic steady state, thus validating the postulation posed. Fig. 4 shows this for different values of log10![[thin space (1/6-em)]](https://www.rsc.org/images/entities/char_2009.gif) pO2mid and Fig. 5 shows this for different values of kgrad.
pO2mid and Fig. 5 shows this for different values of kgrad.
In addition, it is also clear from the figures that when the gas phase is the limiting reactant (i.e. λO ≥ 1), it is possible to have a less-than-optimal value of log10![[thin space (1/6-em)]](https://www.rsc.org/images/entities/char_2009.gif) pO2mid or kgrad while still achieving high conversions. For example, at λO ≥ 50 the decrease in conversions when deviating from the optimal log10
pO2mid or kgrad while still achieving high conversions. For example, at λO ≥ 50 the decrease in conversions when deviating from the optimal log10![[thin space (1/6-em)]](https://www.rsc.org/images/entities/char_2009.gif) pO2mid by ± 3, or deviating from the optimal kgrad value by a decrease of ∼2 orders of magnitude or an increase by a factor of 2, is fairly small (∼1%). However, this means that more solids will be required than in the optimal case to achieve the same production rate of gaseous products, and this will negatively impact on the capital cost and/or operating cost of a potential process.
pO2mid by ± 3, or deviating from the optimal kgrad value by a decrease of ∼2 orders of magnitude or an increase by a factor of 2, is fairly small (∼1%). However, this means that more solids will be required than in the optimal case to achieve the same production rate of gaseous products, and this will negatively impact on the capital cost and/or operating cost of a potential process.
Furthermore, Fig. 5 shows that a broader or steeper δ–pO2 relationship results in less of the oxygen capacity of the OCM being usable during reaction, and hence gives lower conversions despite the total oxygen capacity, λO, being unchanged. At very low |kgrad| values, the δ–pO2 relationship approaches a straight line on the semi-log scale, and the conversion becomes independent of kgrad. Despite a poorer pO2 distribution, a very large λO value results in only a marginally lower value of conversion. On the other hand, at very high values of |kgrad| the δ–pO2 relationship approaches that of an OCM with a single phase transition at pO2 = 10−17.8 bar and therefore the conversion tends towards 50% as expected.23
Optimisation at temperatures other than 1093 K
At temperatures other than 1093 K, the Gibbs free energy of reaction for WGS is non-zero. Therefore and the gas conversion-pO2 relationships (eqn (6) and (7)), as shown in Fig. 2, translate along the abscissa by different amounts whilst maintaining the same shape, hence sharing a common kgrad but different log10
![[thin space (1/6-em)]](https://www.rsc.org/images/entities/char_2009.gif) pO2mid. In such cases, the optimal log10
pO2mid. In such cases, the optimal log10![[thin space (1/6-em)]](https://www.rsc.org/images/entities/char_2009.gif) pO2mid value for eqn (9) is found to be the average of the log10
pO2mid value for eqn (9) is found to be the average of the log10![[thin space (1/6-em)]](https://www.rsc.org/images/entities/char_2009.gif) pO2mid values fitted to the curves for XH2O,Ω and XCO,Ω, respectively, as illustrated in Fig. 6. This is demonstrated in Table 1 (scenario B) and compared to the case when log10
pO2mid values fitted to the curves for XH2O,Ω and XCO,Ω, respectively, as illustrated in Fig. 6. This is demonstrated in Table 1 (scenario B) and compared to the case when log10![[thin space (1/6-em)]](https://www.rsc.org/images/entities/char_2009.gif) pO2mid matches the gas phase equilibrium of either eqn (4) or (5) (scenario A).
pO2mid matches the gas phase equilibrium of either eqn (4) or (5) (scenario A).
![[thin space (1/6-em)]](https://www.rsc.org/images/entities/char_2009.gif) pO2mid is chosen to match the gas phase equilibrium of eqn (4) (matching eqn (5) instead would yield identical results), and B) log10
pO2mid is chosen to match the gas phase equilibrium of eqn (4) (matching eqn (5) instead would yield identical results), and B) log10![[thin space (1/6-em)]](https://www.rsc.org/images/entities/char_2009.gif) pO2mid is set to the average of the log10
pO2mid is set to the average of the log10![[thin space (1/6-em)]](https://www.rsc.org/images/entities/char_2009.gif) pO2mid values matching eqn (4) and (5), respectively. Conversions are shown for optimal kgrad, as well as scenarios where the gradient is halved or doubled
pO2mid values matching eqn (4) and (5), respectively. Conversions are shown for optimal kgrad, as well as scenarios where the gradient is halved or doubled
| Reaction temperature (K) | Choice of log10![[thin space (1/6-em)]](https://www.rsc.org/images/entities/char_2009.gif) pO2mid pO2mid |
Conversion when kgrad is half the optimal value | Conversion when kgrad is optimal | Conversion when kgrad is twice the optimal value | Equilibrium conversion of homogeneous WGS | ||||||
|---|---|---|---|---|---|---|---|---|---|---|---|
| λO = 0.5 | λO = 1 | λO = 2 | λO = 0.5 | λO = 1 | λO = 2 | λO = 0.5 | λO = 1 | λO = 2 | |||
| 593 | Scenario A | 0.45 | 0.84 | 1.00 | 0.50 | 0.96 | 1.00 | 0.50 | 0.84 | 0.91 | 0.85 |
| Scenario B | 0.48 | 0.92 | 1.00 | 0.50 | 1.00 | 1.00 | 0.50 | 0.99 | 0.99 | ||
| 893 | Scenario A | 0.43 | 0.76 | 1.00 | 0.50 | 0.96 | 1.00 | 0.50 | 0.84 | 0.91 | 0.61 |
| Scenario B | 0.43 | 0.77 | 1.00 | 0.50 | 0.99 | 1.00 | 0.50 | 0.91 | 0.94 | ||
| 993 | Scenario A | 0.42 | 0.72 | 1.00 | 0.50 | 0.96 | 1.00 | 0.50 | 0.84 | 0.90 | 0.55 |
| Scenario B | 0.42 | 0.73 | 1.00 | 0.50 | 0.98 | 1.00 | 0.50 | 0.87 | 0.91 | ||
| 1193 | Scenario A | 0.40 | 0.66 | 0.90 | 0.50 | 0.88 | 0.92 | 0.50 | 0.78 | 0.84 | 0.46 |
| Scenario B | 0.40 | 0.66 | 0.90 | 0.50 | 0.89 | 0.92 | 0.50 | 0.80 | 0.84 | ||
| 1293 | Scenario A | 0.39 | 0.63 | 0.84 | 0.50 | 0.83 | 0.86 | 0.50 | 0.72 | 0.80 | 0.43 |
| Scenario B | 0.39 | 0.63 | 0.85 | 0.50 | 0.84 | 0.86 | 0.50 | 0.76 | 0.81 | ||
Table 1 shows that scenario B indeed gives better conversions for CLWGS compared to the corresponding scenario A, although the difference is only marginal in most cases. This improvement in conversion is more noticeable at the lower temperatures (i.e. at 593 K), as the difference in log10![[thin space (1/6-em)]](https://www.rsc.org/images/entities/char_2009.gif) pO2mid between the two scenarios is larger. Furthermore, the improvement in conversion is most noticeable when λO is close to 1, where the conversion is not dominated by the imbalance of oxygen capacity between the gas phase and solid phase. It is also clear from Table 1 that the conversions to products become more favourable at lower temperatures. However, the effect of kinetic limitations will become more severe, which has not been considered here.
pO2mid between the two scenarios is larger. Furthermore, the improvement in conversion is most noticeable when λO is close to 1, where the conversion is not dominated by the imbalance of oxygen capacity between the gas phase and solid phase. It is also clear from Table 1 that the conversions to products become more favourable at lower temperatures. However, the effect of kinetic limitations will become more severe, which has not been considered here.
From a thermodynamic point of view, the optimal case needs to satisfy
![[thin space (1/6-em)]](https://www.rsc.org/images/entities/char_2009.gif) pO2mid, it is more important to ensure that ΔGeqn2 and ΔGeqn3 are close to constant (which is much easier to satisfy) so that kgrad is close to the optimal value.
pO2mid, it is more important to ensure that ΔGeqn2 and ΔGeqn3 are close to constant (which is much easier to satisfy) so that kgrad is close to the optimal value.
5. Discussions
Impact of parameters contributing to λO on process economics
The individual parameters contributing to λO do not influence the thermodynamic efficiency of the chemical looping water-gas shift process if λO remains unchanged, as shown in the supplementary information. However, it is clear that these parameters will influence the size of the reactor needed for a given throughput of gas products – all else being equal, oxygen carrier materials with a larger oxygen transfer capacity per volume will be preferred since the associated reactor footprint will be smaller.Non-stoichiometric mixed metal oxides usually have much lower oxygen transfer capacity per volume compared to simple, stoichiometric metal oxides such as iron oxides. Although the cycle time can be shortened to compensate for cases where the oxygen transfer capacity is low but the δ–pO2 relationship is more favourable, there will be operational limits on the frequency of gas switching. For instance, there is a theoretical lower limit to the gas switching frequency, corresponding to when the half-cycle duration is comparable to the residence time of gas within the reactor. More frequent gas switching will also likely be linked to higher operation and maintenance costs. Therefore, although beyond the scope of the current work, there will be further trade offs between thermodynamic efficiency and the economic efficiency of the processes that need to be considered.
Analogy to heat exchange and pinch analysis
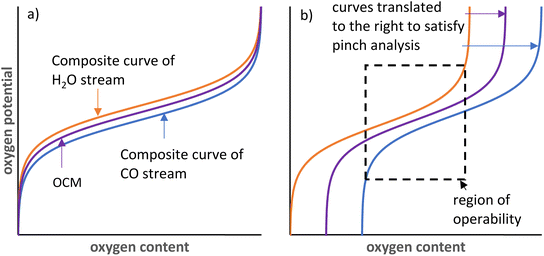
The oxygen exchange between the gas phase and solid phase in CLWGS processes is analogous to the heat exchange between two streams in a heat exchanger.33 In such an “oxygen exchanger”, the oxygen chemical potential corresponds to the temperature of each material stream, and the oxygen content available for exchange corresponds to the heat content of each stream, as shown in Fig. 7. This can be further generalised to any chemical reaction with two unmixed material streams (for example, either as different phases, or separated by a membrane). Indeed, this has been recently utilised to rationalise efficient chemical-looping reverse water-gas shift and methane reforming.27,34The equivalent of pinch analysis for heat exchangers can be used to further validate the optimality of the solid δ–pO2 relationship relative to the gas phase thermodynamics identified in this work. It is obvious from analysis of heat exchangers that counter-current operation is more efficient than co-current operation (or a well-mixed system). Therefore, only the counter-current case is considered here.
The CLWGS process typically involves two “oxygen exchangers” operating in sequence. For each “oxygen exchanger”, the most efficient counter-current operation configuration is for the shape of the “composite curves” (i.e. the oxygen potential–oxygen content relationship) to match exactly. It may be necessary to have a small, constant offset in oxygen chemical potential if exchange kinetics become rate limiting, but the wider this gap is, the greater the exergy loss that is incurred. In particular, if the shapes of the composite curves are different, then a pinch point will exist and all other points on the composite curves will diverge from each other, leading to larger inefficiencies. This is reflected in the lower gas conversions achieved in suboptimal cases presented in Table 1. Furthermore, when the oxygen contents of the two streams are also matched (λO = 1), the full oxygen content of both material streams can be used, without the need of any “utility streams”, resulting in an efficient system. This leads to the minimum size of the reactor and amount of OCM being used for the reaction.
In the case of CLWGS, H2O is the oxygen rich stream, therefore represented by the “hot” composite curve; and the OCM is represented by the “cold” composite curve. Conversely, for the reaction of CO with the OCM, the OCM is more oxygen rich and is represented by the “hot” composite curve. Consequently, for a feasible system it necessitates that the order of pO2 of each of the material streams at any “oxygen content” shown in Fig. 7 must satisfy pH2O stream ≥ pOCM ≥ pCO stream.
At 1093 K,  , therefore pH2O stream = pCO stream and must also be equal to pOCM. At temperatures lower than 1093 K, pH2O stream > pCO stream (Fig. 7a), and pOCM should be such that the OCM's corresponding composite curve lies halfway between the composite curves of the H2O and CO streams. In this way, the efficiencies of both gas–solid reactions are comparable, otherwise the conversion of the overall process will be limited to the less efficient gas–solid reaction.23,33 At temperatures greater than 1093 K, pH2O stream < pCO stream for a given oxygen content. In this case, to satisfy the pinch analysis, the cold composite curve will have to translate to the right until the curve is partially underneath the hot composite curve before oxygen exchange can take place (the purple and blue lines in Fig. 7b). Consequently, this leads to a lower amount of oxygen content being transferred between streams, and the gas conversions achievable are also lower (limited to the region within the dashed box in Fig. 7b).
Approaching the ideal thermodynamics in practice
In practice, it is almost impossible to design a single OCM that possesses the optimal δ–pO2 relationship for the entire pO2 range relevant to CLWGS (or other similar applications) for a given temperature. Fig. 8 shows the δ–pO2 relationship of three well-known non-stoichiometric oxides, all of which are far from the ideal case identified in this work. There are two possible ways to address this challenge.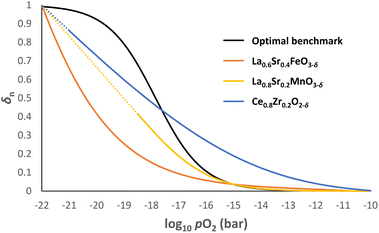 | ||
Fig. 8 δn vs. log10![[thin space (1/6-em)]](https://www.rsc.org/images/entities/char_2009.gif) pO2 profiles for La0.6Sr0.4FeO3−δ, La0.8Sr0.2MnO3−δ and Ce0.8Zr0.2O2-δ at 1093 K using data from literature.26,29,32 The optimal δ–pO2 relationship is also given as a benchmark. The dotted lines for La0.8Sr0.2MnO3−δ and Ce0.8Zr0.2O2−δ indicate extrapolation of the data if no decomposition were to occur. pO2 profiles for La0.6Sr0.4FeO3−δ, La0.8Sr0.2MnO3−δ and Ce0.8Zr0.2O2-δ at 1093 K using data from literature.26,29,32 The optimal δ–pO2 relationship is also given as a benchmark. The dotted lines for La0.8Sr0.2MnO3−δ and Ce0.8Zr0.2O2−δ indicate extrapolation of the data if no decomposition were to occur. | ||
First, the solid phase used for these reactions can be made of a combination of non-stoichiometric materials, so the overall composite curve approximates the optimal shape. Stoichiometric materials should generally be avoided as they introduce discontinuities in oxygen content at specific oxygen potentials. This approach is particularly useful at temperatures below 1093 K for CLWGS, where there is a window of operation bounded by the composite curves representing the H2O and CO streams, respectively (see Fig. 7). As long as the composite curve of the solid lies within this region, there is only a small penalty to the efficiency of the overall process, as evident from Table 1.
Second, instead of using a chemical looping scheme, the oxygen exchange between H2O and CO can also take place in a counter-current membrane reactor, akin to that proposed by Bulfin et al. for similar processes.27,34 In this case, only a single, oxygen conducting, non-stoichiometric solid is needed to facilitate the oxygen transport, and the solid acts as the “wall” of the oxygen exchanger and no longer plays a significant role in the pinch analysis. Therefore, its δ–pO2 relationship no longer affects the efficiency of the process, so long as the oxygen transport rate is sufficiently fast across the full range of pO2 required. However, the challenge lies in the cost-effective manufacturing of such a ceramic membrane reactor that remains well sealed at the operating temperature.
6. Conclusions
This work has highlighted the importance of matching the δ–pO2 relationship between the gas phase and solid phase for CLWGS, and by extension, any chemical looping type heterogenous reactions that are thermodynamically limited. Another important factor to consider is the oxygen capacity available per unit mass of the OCM in the relevant range of oxygen chemical potentials. Based on these key characteristics, an analogy between CLWGS and heat exchanger networks is drawn, and the pinch analysis can be applied for chemical reactions between unmixed streams for their rational design and optimisation.Nomenclature
| A | Cation site in the perovskite structure (ABO3) |
| B | Cation site in the perovskite structure (ABO3) |
| CLWGS | Chemical looping water-gas shift |
| Kox | Equilibrium constant for eqn (4) |
| Kred | Equilibrium constant for eqn (5) |
| L | Bed length (m) |
| Fg | Molar flowrate of gas phase (mol s−1) |
| FO | Molar flowrate of oxygen in gas phase (mol s−1) |
| NOCM | Moles of OCM in the packed bed reactor (mol) |
| OCM | Oxygen-carrier material |
| T | Temperature (K) |
| WGS | Water-gas shift |
| XCO | Conversion of CO to CO2 |
| XH2O | Conversion of H2O to H2 |
| kgrad | Steepness of the logistic function |
| pO2 | Oxygen partial pressure (bar) |
| pO2mid | Oxygen partial pressure at the midpoint of the logistic function (bar) |
| yi | Mole fraction of gaseous species i |
| r | Radius of the packed bed (m) |
| t | Half cycle duration (s) |
| δ | Degree of oxygen non-stoichiometry of OCM |
| δox | Degree of oxygen non-stoichiometry of OCM under the most oxidising operating condition |
| δred | Degree of oxygen non-stoichiometry of OCM under the most reducing operating condition |
| δmax | Maximum degree of oxygen non-stoichiometry of OCM achievable |
| δmin | Minimum degree of oxygen non-stoichiometry of OCM achievable |
| δn | Normalised degree of oxygen non-stoichiometry of OCM achievable |
| ε | Voidage of the packed bed |
| λO | Dimensionless number defined by the ratio of solid phase oxygen capacity to gas phase oxygen capacity |
| ρsolid | Molar density of the solid phase (mol m−3) |
| ρgas | Molar density of the gas phase (mol m−3) |
| Ω | Subscript representing equilibrium |
Data availability
The MATLAB scripts used to generate results presented in this work can be found at https://doi.org/10.25405/data.ncl.27055339. The version of MATLAB employed for this study is version R2021b.Author contributions
M. Selim Ungut: data curation, formal analysis, investigation, methodology, software, validation, visualisation, writing – original draft. Ian S. Metcalfe: funding acquisition, supervision, writing – review & editing. Wenting Hu: conceptualisation, funding acquisition, methodology, project administration, validation, writing – review & editing.Conflicts of interest
There are no conflicts to declare.Acknowledgements
This work was supported by the Engineering and Physical Sciences Research Council (grant numbers EP/P007767/1, EP/P024807/1, and DTP funding EP/N509528/1 (project number 1948790)). ISM acknowledges funding from the Royal Academy of Engineering through a Chair in Emerging Technologies Award entitled ‘Engineering Chemical Reactor Technologies for a Low-Carbon Energy Future’ (grant CiET1819\2\57).References
- P. J. Byrne, E. J. Gohr and R. T. Haslam, Ind. Eng. Chem., 1932, 24, 1129–1135 CrossRef CAS.
- J. Rostrup-Nielsen, Stud. Surf. Sci. Catal., 2004, 147, 121–126 CrossRef CAS.
- J. D. Holladay, J. Hu, D. L. King and Y. Wang, Catal. Today, 2009, 139, 244–260 CrossRef CAS.
- M. Luo, Y. Yi, S. Wang, Z. Wang, M. Du, J. Pan and Q. Wang, Renewable Sustainable Energy Rev., 2018, 81, 3186–3214 CrossRef CAS.
- V. Hacker, R. Fankhauser, G. Faleschini, H. Fuchs, K. Friedrich, M. Muhr and K. Kordesch, J. Power Sources, 2000, 86, 531–535 CrossRef CAS.
- F. Li, L. Zeng, L. G. Velazquez-Vargas, Z. Yoscovits and L. S. Fan, AIChE J., 2010, 56, 2186–2199 CrossRef CAS.
- J. Adanez, A. Abad, F. Garcia-Labiano, P. Gayan and L. F. de Diego, Prog. Energy Combust. Sci., 2012, 38, 215–282 CrossRef CAS.
- C. Dueso, C. Thompson and I. Metcalfe, Appl. Energy, 2015, 157, 382–390 CrossRef CAS.
- M. Keller and A. Sharma, J. Environ. Chem. Eng., 2024, 12, 112613 CrossRef CAS.
- M. Rydén, A. Lyngfelt, T. Mattisson, D. Chen, A. Holmen and E. Bjørgum, Int. J. Greenhouse Gas Control, 2008, 2, 21–36 CrossRef.
- C. D. Bohn, C. R. Müller, J. P. Cleeton, A. N. Hayhurst, J. F. Davidson, S. A. Scott and J. S. Dennis, Ind. Eng. Chem. Res., 2008, 47, 7623–7630 CrossRef CAS.
- J. B. Yang, N. S. Cai and Z. S. Li, Energy Fuels, 2008, 22, 2570–2579 CrossRef CAS.
- W. Liu, J. S. Dennis and S. A. Scott, Ind. Eng. Chem. Res., 2012, 51, 16597–16609 CrossRef CAS.
- M. F. Bleeker, S. R. A. Kersten and H. J. Veringa, Catal. Today, 2007, 127, 278–290 CrossRef CAS.
- P. Heidebrecht and K. Sundmacher, Chem. Eng. Sci., 2009, 64, 5057–5065 CrossRef CAS.
- J. E. Readman, A. Olafsen, Y. Larring and R. Blom, J. Mater. Chem., 2005, 15, 1931–1937 RSC.
- L. Nalbandian, A. Evdou and V. Zaspalis, Int. J. Hydrogen Energy, 2009, 34, 7162–7172 CrossRef CAS.
- A. Murugan, A. Thursfield and I. S. Metcalfe, Energy Environ. Sci., 2011, 4, 4639 RSC.
- J. E. ten Elshof, M. H. R. Lankhorst and H. J. M. Bouwmeester, J. Electrochem. Soc., 1997, 144, 1060–1067 CrossRef.
- Y. Teraoka, H. Shimokawa, C. Y. Kang, H. Kusaba and K. Sasaki, Solid State Ionics, 2006, 177, 2245–2248 CrossRef CAS.
- M. Søgaard, P. Vang Hendriksen and M. Mogensen, J. Solid State Chem., 2007, 180, 1489–1503 CrossRef.
- H. J. M. Bouwmeester, H. Kruidhof and A. J. Burggraaf, Solid State Ionics, 1994, 72, 185–194 CrossRef CAS.
- I. S. Metcalfe, B. Ray, C. Dejoie, W. Hu, C. de Leeuwe, C. Dueso, F. R. García-García, C.-M. Mak, E. I. Papaioannou, C. R. Thompson and J. S. O. Evans, Nat. Chem., 2019, 11, 638–643 CrossRef CAS.
- C. de Leeuwe, W. Hu, J. Evans, M. von Stosch and I. S. Metcalfe, Chem. Eng. J., 2021, 423, 130174 CrossRef CAS.
- J. Mizusaki, M. Yoshihiro, S. Yamauchi and K. Fueki, J. Solid State Chem., 1985, 58, 257–266 CrossRef CAS.
- M. Kuhn, S. Hashimoto, K. Sato, K. Yashiro and J. Mizusaki, Solid State Ionics, 2011, 195, 7–15 CrossRef CAS.
- B. Bulfin, M. Zuber, O. Gräub and A. Steinfeld, Chem. Eng. J., 2023, 461, 141896 CrossRef CAS.
- A. A. Markov, K. Yu. Chesnokov, M. V. Patrakeev, I. A. Leonidov, A. V. Chukin, O. N. Leonidova and V. L. Kozhevnikov, J. Solid State Electrochem., 2016, 20, 225–234 CrossRef CAS.
- J. Mizusaki, N. Mori, H. Takai, Y. Yonemura, H. Minamiue, H. Tagawa, M. Dokiya, H. Inaba, K. Naraya, T. Sasamoto and T. Hashimoto, Solid State Ionics, 2000, 129, 163–177 CrossRef CAS.
- J. Mizusaki, S. Yamauchi, K. Fueki and A. Ishikawa, Solid State Ionics, 1984, 12, 119–124 CrossRef CAS.
- M. Kuhn, S. Hashimoto, K. Sato, K. Yashiro and J. Mizusaki, J. Solid State Chem., 2013, 197, 38–45 CrossRef CAS.
- M. Kuhn, S. R. Bishop, J. L. M. Rupp and H. L. Tuller, Acta Mater., 2013, 61, 4277–4288 CrossRef CAS.
- C. de Leeuwe, PhD thesis, Newcastle University, 2019 Search PubMed.
- B. Bulfin, M. Zuber and A. Steinfeld, Chem. Eng. J., 2024, 488, 1385–8947 CrossRef.
Footnote |
| † Electronic supplementary information (ESI) available. See DOI: https://doi.org/10.1039/d4re00454j |
| This journal is © The Royal Society of Chemistry 2025 |


