 Open Access Article
TcESTIME: predicting high-temperature hydrogen-based superconductors†
Trinidad
Novoa
 *ab,
Matías E.
di Mauro
 a,
Diego
Inostroza
a,
Kaoutar
El Haloui
c,
Nicolas
Sisourat
c,
Yvon
Maday
a,
Diego
Inostroza
a,
Kaoutar
El Haloui
c,
Nicolas
Sisourat
c,
Yvon
Maday
 b and
Julia
Contreras-García
*a
aLaboratoire de Chimie Théorique (LCT), Sorbonne Université, CNRS, 4 Pl. Jussieu, Paris, 75005, France. E-mail: trinidad.novoa_aguirre@sorbonne-universite.fr
bSorbonne Université, Université Paris Cité, CNRS, Inria, Laboratoire Jacques-Louis Lions (LJLL), Paris, 75005, France
cLaboratoire de Chimie Physique-Matière et Rayonnement (LCPMR), Sorbonne Université, CNRS, 4 Pl. Jussieu, Paris, 75005, France
First published on 13th November 2024
Abstract
Superconductivity can be considered among the most exciting discoveries in material science of the 20th century. However, the hard conditions for the synthesis and the difficult characterization, make the statement of new high critical temperature (Tc) complex from the experimental viewpoint and have recently led to several hot controversies in the literature. In this panorama, theory has become a trustworthy diagnosis. Nevertheless, this comes at an extremely high computational cost. A faster alternative would be to find cheap footprints of superconductivity from the electronic structure. Some of the authors have recently shown that a correlation exists between Tc, the networking value [Nature Communications, 12, 5381 (2021)], and the molecularity index [arXiv:2403.07584v1 (2024)]. The networking value reflects the metallicity of the parent compound as a measure of its electron delocalization channels, by means of the Electron Localization Function topology (its bifurcation trees). Instead, the molecularity index quantifies the presence of H2 molecules within the system. All in all, these two quantities characterize bonding features that are related to high Tc: high metallicity and low molecularity boost high Tc states. However, the quantification or these bonding characteristics was initially made by a visual approach, which is not scalable for high throughput screening. We have developed a new code, TcESTIME, which allows to determine the networking value for a given hydrogen-based compound. In this contribution, we present such code and the underlying periodic algorithms we have developed. As a reference, the estimation of Tc for LaH10 thanks to this new code amounts to 10 CPU minutes in a computer cluster equipped with Intel Xeon 2.4 GHz processor. Given the new potential for screening, we have applied it to a larger set including ternary hydrogen based superconductors, and have proposed new fits to estimate Tc, leading to errors of ca. 33 K. We believe that this contribution settles the bases for an automatic high-throughput screening of hydrogen-based superconductors.
1 Introduction
Superconductivity is one of the most exciting discoveries in materials science of the 20th century with major technological consequences. Indeed, superconductors have perfect diamagnetic properties and zero resistance. These properties have allowed essential technological advances such as the realization of intense magnetic fields used in NMR,1,2 in high resolution electron microscopy,3,4 in the development of nuclear fusion reactors,5,6 in levitation transport,7,8 in high speed quantum computers,9,10etc. From the scientific point of view, the great impact of superconductivity can be quantified not only by the number of publications to which it has given rise, but also by the number of Nobel Prizes that have been awarded in the context of studies of this phenomenon (a total of 5!). Nevertheless, after all these discoveries, an ambient superconductor still remains the Holy Grail, one of the most sought-after objects in solid state physics. In the last decade, the prediction and observation of high-temperature conventional superconductivity in hydrogen-rich systems has proven the exceptional potential of these materials,.11 Some note-worthy experimental results include H3S at 203 K,12 LaH10 at 250 K,13 and YH9 at 243 K,14 all of them under very high-pressures, ranging from 90 to 201 GPa. If this class of compounds could be designed for applications in our everyday world, their extraordinary characteristics would introduce a technological revolution through lossless electrical transport and ultra-efficient electric motors or generators. In the field of superconductivity, there is an intense effort between theoretical and experimental work to develop the practical use of hydrogen superconductors. In all of this, the role of theory is to guide the experiments by proposing possible stable compounds and establishing the right footprints for superconductivity.Important insights on what boosts Tc have been provided in the last years through the analysis of the types of bonds that are present in conventional superconductors.11,15,16 Starting from the study through first-principles calculations of the structural and electronic properties of more than one hundred compounds, some of us have shown that a high 3D electron delocalization is crucial for understanding the critical temperature of those conventional hydrogen-rich superconductors.17 At a later stage, we have also described the tendency of the molecularization of hydrogen–hydrogen bonds to hinder the critical temperatures of those compounds, a feature that can be assessed by means of the localization of electrons in H2-like intramolecular regions.18 Other works have shown how, for some superconductors, Tc seems to be lowered by saturated covalent bonds,16 such as those found in H2 molecular units. In fact, in a one dimensional hydrogen chain, one can see that molecularization hampers the metallic character of the system – crucial precursor to the superconducting transition – giving a hint as to why superconductivity is enhanced without the molecular units. The definition of a function to measure localization in the superconducting state showed that the superconducting transition does not affect the arrangement of electrons greatly, both in the one-dimensional chain as in well-known compounds.18,19
Moreover, we have defined a magnitude named as the networking value, which correlates well with the predicted critical temperature, much better than any other descriptor analyzed in the existing literature.17 This magnitude can be easily calculated for any compound by analyzing isosurfaces of the electron localization function and is applicable to any bonding type. This correlation opens the pathway for a high throughput screening of potential high-temperature superconductors. However, for that aim, the determination of the networking value, which was carried out from visual inspection, needs to be automatized. In this manuscript, we endeavor into such an automatization for the determination of delocalization pathways in periodic systems, and the consequent estimation of Tc. It is worth noting that, since the aforementioned correlation was observed for conventional hydride superconductors, we hereby only refer to materials of that type. Extending the formalism to other types of superconductors is beyond the scope of this contribution.
In the following section, some theoretical background on the Electron Localization Function and the descriptors derived from it are laid out. Then, in Section 3 we present the workflow of TcESTIME, along with the algorithm developed to compute the networking value. In Section 4 we compare our results to those obtained visually in a database of binary compounds. In Section 5, we propose certain improvements on the prediction of the critical temperature by extending the database to contain ternary systems, and presenting new fits for Tc. Finally, in Section 6, we present the open source TcESTIME code and the TcESTIMWEB server, that facilitates the estimation of Tc through an accessible and user-friendly platform.
2 Theoretical background
2.1 The electron localization function
The Electron Localization Function (ELF) was originally designed by Becke and Edgecombe to identify “localized electronic groups in atomic and molecular systems”.20 It relies, through its kernel, χσ(r), to Dσ(r), the leading term of the Taylor expansion of the spherically averaged conditional same spin pair probability, scaled by the homogeneous electron gas kinetic energy, D0σ(r), | (1) |
is the difference between the definite positive kinetic energy, τσ(r), and the von Weizsäcker kinetic energy functional;21 while the kinetic energy density of the homogeneous electron gas is
This formulation led Savin and co-authors to propose an interpretation of ELF in terms of the local excess kinetic energy due to the Pauli repulsion, enabling its calculation from Kohn–Sham orbitals.22
The electron localization function itself is obtained through a lorentzian transformation of χσ:
 | (2) |
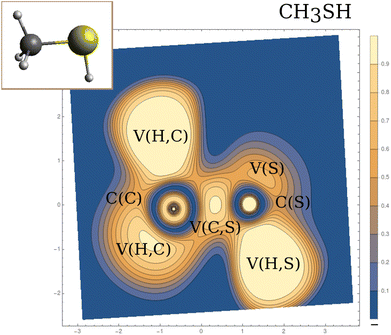
Within the dynamical system framework, pioneered by Bader for the analysis of the electron density,23 a formal analogy is made between a vector field bounded on a manifold and a velocity field. In the present case, the vector field is the gradient field of the ELF, and the manifold the 3-dimensional geometrical space. This provides a partition of the direct geometrical space into regions called basins, which can be thought of as electronic domains corresponding to the chemical entities of the Lewis picture. Some of those basins will correspond to the valence, and are denoted by V(A, …), where A is the atom of the neighboring atomic core basin, C(A) (which can be constituted by K, L, …shells). In agreement with Lewis's picture, V(A, …) may belong to several atomic shells (see Fig. 1).
2.2 Topological descriptors of the ELF
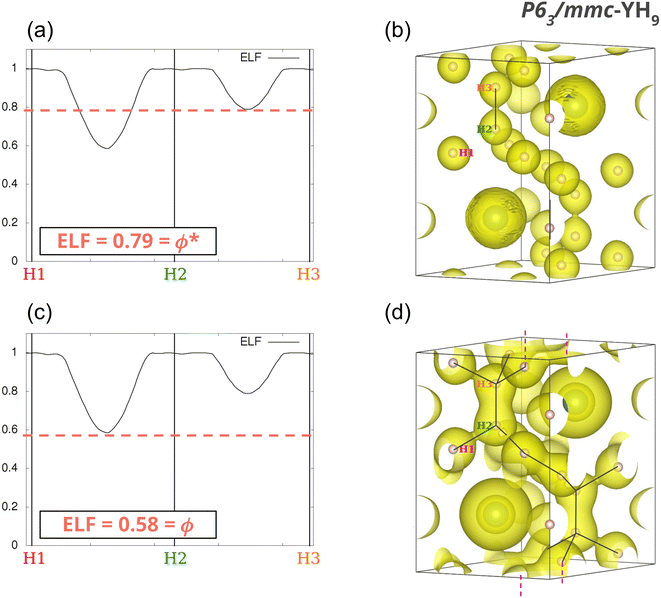
The properties of the gradient dynamical system are complemented in the context of the ELF topology with the interpretation derived from the f-domain24 concept, that enables to recover chemical units in the system, as well as to characterize the basins according to common chemical knowledge. Introduced by Mezey25 within the AIM framework, the concept of an f-domain accounts for the volume enclosed by an isosurface of a certain value of ELF(r) = f. As the value f increases, successive splitting of the initial domains take place until all of them contain one, and only one, attractor (i.e. maximum). These final domains are called irreducible, and the order in which they appear with increasing f reveals the nature of the interactions taking place in the system and the relationship between basins. The turning points of the splitting corresponds to that of the highest (3,−1) point of the separatrix connecting the basins. According to the value of the ELF at these nodes, a bifurcation tree can be constructed that reveals the basin hierarchy at a glance. The highest ELF value for which the f-domain is tridimensional corresponds to the networking value, ϕ.17Fig. 2 illustrates this principle for YH9. At f = 0.79 some basins are connected leading to H2 molecules (Fig. 2b). As the ELF value diminishes, more connections appear, and at f = 0.58 (Fig. 2d) the volume in this isosurface (associated with all points such that f ≥ 0.58) is connected. This is the networking value, ϕ = 0.58. In what follows, such a volume inside an f-isosurface will be named as “f-domain”.In ternary systems, more complex situations arise that required the introduction of another index quantifying the presence of H2 molecules. This can be done by means of the molecularity index, ϕ*, which also stems from the analysis of the topology of the ELF.18 It corresponds to the highest ELF value for which any two hydrogens in the system are placed within the same f-domain. In Fig. 2a, where f = 0.79, there are two hydrogens (labeled H2 and H3) within the same f-domain, while the other hydrogens (H1, for example), remain disconnected. That value corresponds to the molecularity index of the system, ϕ* = 0.79. The isosurface containing H2 and H3 is displayed in 2b.
2.3 Prediction of critical temperatures
The importance of these indexes comes from their relation to the critical temperature of hydrogen-based superconductors. A correlation between Tc and these two indexes has been recently observed,17,18 providing a much more efficient way of estimating critical temperatures, as the ELF can be obtained practically for free after a SCF calculation is performed.18 This is true even if the correlation is not very sharp, as it can be used for predicting Tc for large amounts of systems. It can however be improved if other quantities are taken into account: the fraction of hydrogen atoms in the unit cell, Hf, and the fraction of the density of states (DOS) at the Fermi level (εF) that correspond to hydrogen, HDOS. Those are defined as | (3) |
 | (4) |
| Tc = (750ΦDOS − 85) K. | (5) |
Alternative fits to estimate Tc using the same framework have been introduced to extend these relationships to ternary compounds, which required the inclusion of the molecularity index.18 Those fits were obtained using Symbolic Regression, a Machine Learning technique that yields an analytical expression for, in this case, the estimation of the critical temperatures. The results of ref. 18 show that the inclusion of ϕ* leads to better results in the estimations. There, the proposed fit
 | (6) |
 | (7) |
3 The TcESTIME algorithm
Automatizing the search of the networking value and of the molecularity index is the missing piece for an efficient computation of the critical temperature. While the estimation of ϕ* is quite straightforward,‡ that of ϕ is certainly not. The TcESTIME algorithm has been developed for this purpose. The key feature of the networking value is that, for f = ϕ the associated ELF f-domain is connected (in the topological sense i.e. it has no disjoint components), and thus expands in all three dimensions. To evaluate this connectivity, we build an associated complex network for each candidate networking value,![[small phi, Greek, tilde]](https://www.rsc.org/images/entities/char_e0e2.gif) , where the nodes are the attractors of the ELF in the unit cell, and the edges represent a gradient path passing through a saddle point and connecting two attractors. Then, we define the periodic connectivity of the network as follows:
, where the nodes are the attractors of the ELF in the unit cell, and the edges represent a gradient path passing through a saddle point and connecting two attractors. Then, we define the periodic connectivity of the network as follows:
1. In 1D: there is at least one path that connects a node to one of its translated analogues in another unit cell.
2. In 3D: there must be three such paths in three different, linearly independent, directions.
Thus, the latter condition is the one that must be fulfilled. In the following sections, we will start by determining the complex network and, then, we will see how to reduce it to one unit cell.
3.1 Constructing the network
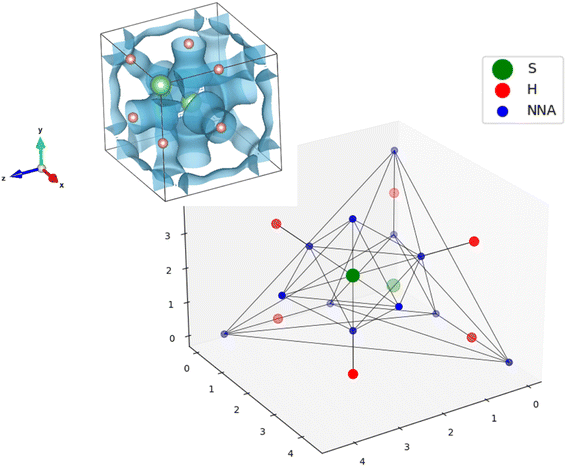
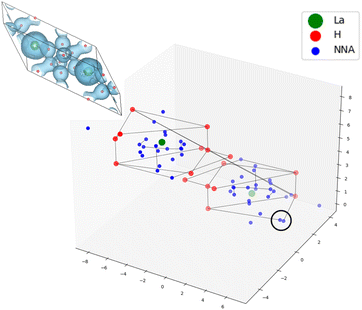
The networking value will be determined through the topological analysis of the ELF, performed using the program critic2.28–30 This code allows reading grid data as the ones obtained from Quantum ESPRESSO31,32 (used along this application). Using a Newton–Raphson algorithm, it allows the localization of the ELF critical points (CPs): maxima located in the nuclei (nuclear attractors or NUCs), other maxima corresponding to the atomic shell structure and valence (non-nuclear attractors or NNAs), and saddle points corresponding to bonding regions, i.e. CPs that are minima in one direction and maxima in the other two (bond critical points or BCPs).28,29 Each BCP is connected to two attractors, be it nuclear or non-nuclear, inside an isosurface of isovalue that is at most equal to the value of the ELF in the BCP (f-domain). These attractors can be either in the same unit cell, or in a neighboring one. With this information, it is possible to transform the typically analyzed ELF isosurfaces (Fig. 3-top-left) into graphs (Fig. 3-bottom). Note how the NNAs (in blue) surrounding the S atoms (in green) connect the neighbouring H atoms (in red) for the f = 0.69 domain.Two main issues were observed when constructing the network:
1. Due to the rapid variations of the ELF in the core shells, some connections between NNA's in the cores and the corresponding nuclear attractor are missed by critic2.
2. The edges of the graphs are very sensitive to the tuning of the critic2 parameters, namely the distance thresholds for which two CPs are considered to be the same one.
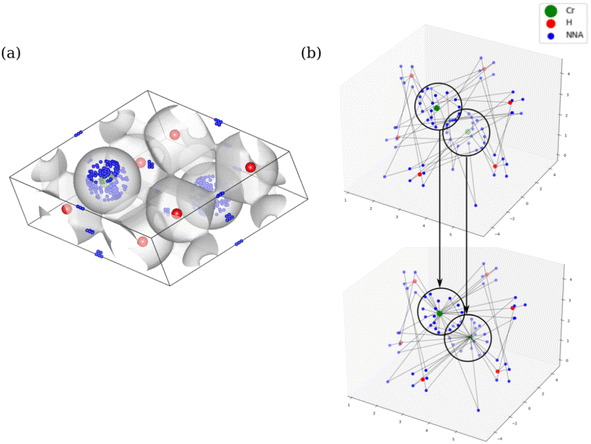
We use chemical intuition to avoid this problem and presuppose that all ELF maxima that correspond to the same core are connected, as it is in fact the core the one that needs to be part of the three-dimensional lattice. This requires the definition of an effective core radius, which can be done from the ELF of isolated atoms, as it has been shown that the values in the core region are quite rigid, staying practically unchanged upon bonding and induced pressure.34 Core radii values, rA, are tabulated for elements A with Z ∈ [3, 38] ∪ {48} in ref. 35 (also available in Table S1 of ESI†). Hence, all critical points around a nuclear maximum of atom A and within a distance rA of it will be linked together, as shown by the black circles in Fig. 4b.
As it is usual in the case of ELF, it is complex to analyze its topology for hydrogen atoms. Having only one electron – no Pauli repulsion – the ELF surface is very flat. This can sometimes lead to having many NNAs close to the hydrogens, and the connections between them and the bond CPs are easier to miss. Therefore, it is useful to assign a core radius to H, since it allows to group all those CPs that are found very close to the nucleus. We choose rH = 0.7a0, which corresponds to half the bonding distance of the H2 molecule.
The definition of this radius is particularly convenient for systems where molecular hydrogen is present, as the profile of the ELF along the bond axis is very flat and it is more common that the algorithm fails to find the BCPs or to properly connect them to the NUCs and NNAs.
Another parameter that can be tuned is the minimum distance between the nuclear coordinates of hydrogen and an ELF attractor for the latter to be considered nuclear. To avoid a large amount of NNAs to form around the hydrogens, we have raised this quantity to 0.6a0, which has shown to optimize the search of the networking value in the reference set.
These parameters can be changed by the user, as well as other more specific ones, as TcESTIME also allows to run critic2 externally with the preferred options, using the resulting output file as input.
3.2 Reducing the analysis to the unit cell
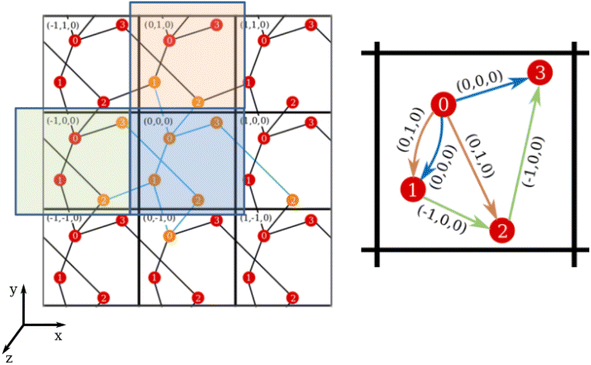
Considering the definition of periodic three-dimensional connectivity given before, to determine ϕ we must search for paths that connect a node to itself in another unit cell. However, for each trial f this means using supercells composed of at least 8 cells of unit size, in order to check for all possible connectivities outside the unit cell. We will try to simplify this picture thanks to periodicity. This is done in two steps: translating the graph to the unit cell, and then checking for closed paths.To reduce the network to the unit cell, we associate a direction and weight to the edges, that will correspond to the translation vector of the connection. For example, if node 1 is directed towards node 2 with translation t12 = (−1, 0, 0) it means that, in every unit cell, 1 is connected to 2 in a neighboring cell to its left (see Fig. 5). It is worth noting that these directions are simply an attribute of the connection, and it does not mean that these are directed graphs in the complex network sense. (In the previous example, we do consider that node 2 is connected to 1, but the translation would change sign. This would not be true in a classic directed graph.)
With this “labelled” graph, we can translate all the information of the periodic connectivity to the unit cell while keeping the translational information.
 | (8) |
While it is rather easy to visually identify all possible closed paths for small systems, it is not straightforward to do so for larger ones. We propose an algorithm that is based in the breadth-first search algorithm,36 that builds the tree data structure of connections in a network starting from one node, that we call n0. In the original algorithm, this is done by checking all the connections of the initial node, and creating a new branch for each one of them, which are put in a queue, while the initial node is marked as visited. The process is repeated for each of the nodes in the queue, which are then taken off of it when they are visited, and finishes when it is empty. Because in our networks there could be more than one connection between the nodes (see for example the double connection between nodes 0 and 1 in Fig. 5), we use the adjacency matrix, A, instead of the visited flag, where Aij = Aji is equal to the number of edges connecting nodes i and j. The matrix is updated by subtracting 1 to Aij (and Aji) when a connection between said nodes is added to the tree. The translations of these connections are also taken into account and stored, taking care of its sign, as can be seen in the example in Fig. 6.
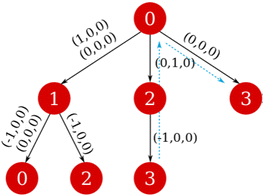 | ||
| Fig. 6 Tree data structure of the network starting from node 0. The blue dashed arrows in each pannel mark the closed path 3 → 2 → 0 → 3. | ||
Once the tree starting from a node n0 is found, the nodes nr that appear more than once are identified. For those there will be a closed path in the network, and its net translation can be found by subtracting the net translation of each of the branches, up to nr (see Fig. 6). If there is more than one connection between two nodes, we consider a different path for each of them, with different net translations.
4 Results for reference systems
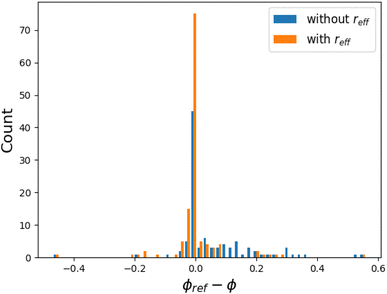
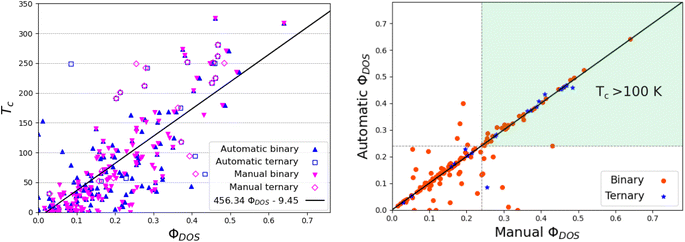
The networking value was computed for an ensemble of 129 systems, corresponding to the hydrogen-based superconductors of ref. 17, from where the reference values ϕref were taken.§ These values were originally visually determined, analyzing different ELF isosurfaces and finding the one for which a 3D network formed.The program was able to find a networking value for 126 systems, with a mean absolute error (MAE) of 0.04 with respect to the reference values ϕref, and a standard deviation of 0.08, and an average computation time of ca. 2 s per system. A distribution of the difference ϕref − ϕ is reported in Fig. 8, where we compare the estimations made with and without the considerations that were made concerning the cores: the core radius for non-H and H atoms, and the nuclear distance parameter for hydrogen, too. For simplicity, we call all these considerations the effective core radius reff. The Im![[3 with combining macron]](https://www.rsc.org/images/entities/char_0033_0304.gif) m–(H2S)2H2 structure of Fig. 3 is a successful example for which TcESTIME found the exact expected networking value, ϕ = ϕref = 0.69. TcESTIME was not able to find a networking value for a total of 3 systems, as reported in Table 1. A more detailed look into the ELF graph for the C2/m–LaH8 crystal at the reference value ϕref = 0.52 (see Fig. 7), shows that it is likely that two unconnected bond critical points should have been considered as equivalent. A hand tuning of critic2's parameters solves the issue for these problematic systems in most cases. From Fig. 9b one can note that both approaches, TcESTIME and visual search of ϕ, yield the most similar results for the structures with higher predicted Tc, which interest us the most.
m–(H2S)2H2 structure of Fig. 3 is a successful example for which TcESTIME found the exact expected networking value, ϕ = ϕref = 0.69. TcESTIME was not able to find a networking value for a total of 3 systems, as reported in Table 1. A more detailed look into the ELF graph for the C2/m–LaH8 crystal at the reference value ϕref = 0.52 (see Fig. 7), shows that it is likely that two unconnected bond critical points should have been considered as equivalent. A hand tuning of critic2's parameters solves the issue for these problematic systems in most cases. From Fig. 9b one can note that both approaches, TcESTIME and visual search of ϕ, yield the most similar results for the structures with higher predicted Tc, which interest us the most.
Using the same values of HDOS as in ref. 17, it is straightforward to compute ΦDOS. The correlation between ΦDOS, as computed by TcESTIME, and the reported critical temperature of the reference systems is recovered (see Fig. 9a).
5 Improving the estimation of Tc
5.1 Better fits for ternary hydrides
It has become evident that the search for high-temperature hydrogen-based superconductors has to expand towards ternary systems, a much broader space that has not yet been explored exhaustively. Here, we will use the new automated code to simultaneously analyze the set of 129 binary17 and 21 ternary18 compounds. The ternary compounds are composed of X-RE-H, with X and RE s-block and rare-earth elements, respectively. A list of those systems is provided in Table 3 of the ESI.† For the computational details concerning the computation of the ELF and DOS in those systems, see ref. 18.The values of the networking value according to TcESTIME have a MAE of 0.02 with respect to the ones estimated visually, showing similar trends to those observed for the binary compounds. As can be seen in Fig. 9 the correlation between ΦDOS and Tc still holds for the ternaries, although some of them do seem to further deviate from the tendency.
A new linear fit can be obtained considering ΦDOS of both binary and ternary compounds, as computed by TcESTIME, and using the least squares method:
| TLSc = (456.34ΦDOS − 9.46) K. | (9) |
5.2 Gradient boosting regression
The availability of these data opens the possibility of proposing new models to estimate Tc. We present here a Machine Learning (ML) model obtained using ϕ, ϕ*, Hf, and HDOS as descriptors to estimate the target quantity, Tc. The introduction of this model permits to consider both binary and ternary systems during training. Moreover, their performance can be evaluated in a test set that was not used during training, which is crucial to assess the transferability of the model, and was not done in the original linear fit.Gradient boosting regression (GBR) is an approach first proposed by Friedman40 to extend the boosting algorithm to regression problems. GBR consists of integrated models with high performance and good stability, combining several weak prediction models (decision trees) to create a more powerful and accurate one. In practice, one constructs an additive model in a step-by-step manner, enabling optimization of any differentiable loss function. During each step, a regression tree is trained using the negative gradient of the specified loss function.
We used the GBR algorithm as implemented in the sklearn Python package (version 1.3.0).41 The squared error was used as a loss function for optimization. The ensemble of the data was split into a training and test set, corresponding to 67% and 33% of the dataset, respectively. Some parameters of the GBR model were optimized to minimize the root mean squared error on the test set. With this, the learning rate was set to 0.2, the number of estimators to 50, the maximum depth to 4, and the subsample size to 0.5 (leading to a stochastic gradient boosting model).
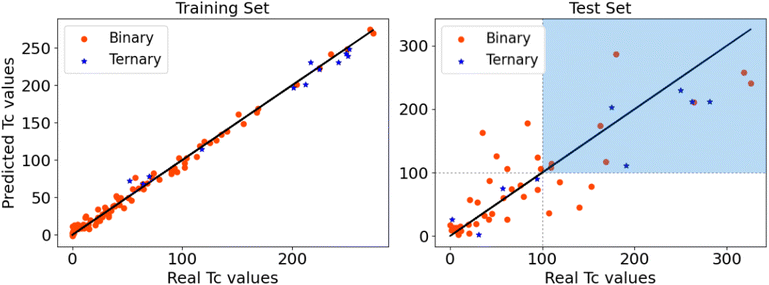
The results of our model are reported in Fig. 10. No difference is observed in the accuracy of the predictions between the binary and ternary systems. The MAE in the test set is of 33.08 K, lower but of similar magnitude to what was obtained using Symbolic Regression in ref. 18. The GBR method allows to characterize the importance of the descriptors as a percentage, showing that it is HDOS that has the largest influence in the estimation of Tc, with 45% importance. It is followed by 22% and 21% importance for ϕ* and ϕ, respectively, whereas for Hf it is only of 11%. Despite the large importance of HDOS in the prediction of Tc within this model, the other descriptors are crucial in the estimation, as there is no clear correlation between HDOS and Tc in the database, as it can be seen in Fig. S4 of the ESI.†
A table containing the reference and predicted critical temperatures for all the systems in the dataset using the different fits is provided in the ESI.†
6 Access to TcESTIME
6.1 TcESTIME: open source code to download
The TcESTIME code is available for download at https://github.com/juliacontrerasgarcia/Tcestime. To use it, the ELF cube file and the DOS Quantum ESPRESSO output files are needed as input. A version of TcESTIME that supports VASP output files is currently under development. TcESTIME provides three different estimations of Tc, corresponding to the predictions obtained using: (i) the linear fit with respect to ΦDOS (see eqn (9)); (ii) two analytical expressions obtained with Symbolic Regression in ref. 18 (see eqn (6) and (7)); and (iii) the fit obtained with the GBR algorithm. A summary of the workflow of TcESTIME including input and output is presented in Fig. 11.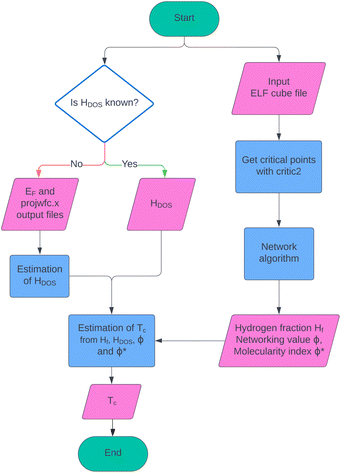 | ||
| Fig. 11 Workflow of TcESTIME, from the input of the ELF cube file and projected DOS information, to the estimation of Tc using one of the four proposed fits. | ||
6.2 TcESTIMWEB: web server
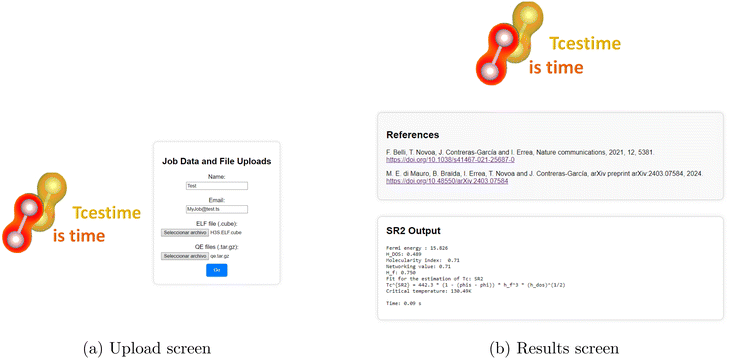
In order to facilitate the estimation of Tc from a normal DFT calculation, we have also given access to the code via a web interface. The TcESTIME web server is an efficient tool for calculating the critical temperature of hydrogen-based systems, supporting Quantum Espresso (QE) and Electron Localization Function data. It can be accessible online at https://lct-webtools.sorbonne-universite.fr/tcestime/.To use web server, the user must prepare the following files:
• A QE compilation archive (.tar.gz) containing the pdos_wfc files and the output file of a QE calculation containing the Fermi energy (e.g. nscf.out).
• An ELF file in.cube format.
Once in the platform, the user should navigate to the upload section, provide their name and email address, and upload the ELF and QE files. Upon completion, the user should press the “Go” button to submit the calculations (see Fig. 12a).
After submission, the user will be directed to a waiting page displaying their calculation ID. Processing time may vary depending on file size and complexity, but results are typically generated within seconds. The results page will display four Tc estimates using different methods (Least Squares, GBR, SR2, and SR4) (see Fig. 12b). For example, for the H3S crystal, where the reference is Tc = 225 K, the estimated values are:
| Least squares: TLSc = 181.99 K | (10) |
| GBR: TGBRc = 222.75 K | (11) |
| SR2: TSR2c = 130.49 K | (12) |
| SR4: TSR4c = 185.33 K | (13) |
Finally, a link to the results page is provided via email for future access. It should be noted that this content is only accessible for 24 hours, after which the data is deleted from the server.
7 Conclusions
We have presented TcESTIME and its web access, TcESTIMWEB, a program that does a fast prediction of the critical temperature of potential hydrogen-rich superconductors, by exploiting the relationship between Tc and four key quantities: Hf, HDOS, ϕ, and ϕ*. The main focus of this work has been the automatization of the evaluation of the networking value, which is done by interfacing the search of critical points and gradient paths of the ELF using critic2, with a newly-developed tree algorithm. The use of complex networks in the latter allows to reduce the analysis to only one unit cell, considerably saving computational time.The performance of the new computational tool in the original dataset of binary hydrides with respect to the reference values (obtained by visual inspection) was satisfactory, obtaining almost identical results, and only failing to provide an output in 3 systems out of 129 (roughly 2% of them). The new computational tool was also tested on the set of 21 ternary compounds of ref. 18. A new linear fit between Tc and the values of ΦDOS obtained with TcESTIME was proposed, in order to provide a consistent framework for the prediction of Tc simultaneously for binary and ternary compounds.
Moreover, thanks to the new code, a new fit for Tc was proposed using the GBR machine learning technique. Its performance in the test set, corresponding to 33% of the (binary and ternary) hydride dataset presented a MAEs of ca. 33 K. This fit allows for a more transferable prediction of Tc, and has the best predictions obtained from the ELF and DOS descriptors up to date.
All in all, the TcESTIME program is a tool that was highly needed to pursue the high-throughput prediction of new hydrogen-rich superconducting materials through the analysis of the ELF. Noticeably, it can certainly highly speed-up the search for good superconductors by experimentalists or theoretical physicists that would like to perform experiments/expensive calculations only on promising systems.
Data availability
The TcESTIME and the web server can be found in the following links: https://github.com/juliacontrerasgarcia/Tcestime, https://lct-webtools.sorbonne-universite.fr/tcestime/.Author contributions
T. N. developed the main code, was in charge of formal analysis and writing. M. d. M. took part in the methodology, doing most calculations on ternary systems. D. I. developed the web application. K. E. H. and N. S. were in charge of methodology, developing the machine learning model. Y. M. contributed in the conception of the algorithm, the formal analysis and participated in the review and edition of manuscript. J. C. G was in charge of the conceptualization, the formal analysis and writing the manuscript.Conflicts of interest
There are no conflicts to declare.Acknowledgements
We thank Francisca J. Benítez for her valuable help with artistic graphical content. We would like to acknowledge support by ECOS-Sud C17E09 and C21E06, and the Association Nationale de la Recherche under grant ANR-22-CE50-0014. This research was supported by the European Research Council (ERC) under the European Unions Horizon 2020 research and innovation programme (grant agreement no. 810367), project EMC2. This work was supported by the Sorbonne Center for Artificial Intelligence (SCAI), an institute dedicated to artificial intelligence within the Sorbonne University Alliance, funded by the excellence initiative IDEX SUPER under the ANR reference: 11-IDEX-0004. The authors acknowledge the High-Performance Computing Centers (HPC) of Irene/TGCC, and Jean Zay/IDRIS of GENCI (France) under projects no. A0140807539 and A0160815101 and “Grand Challenge 2023 TGCC” Session A14 spe0040 for generous allocations of computing time. This work was granted access to the HPC resources of the MeSU platform at Sorbonne-Université.References
- A. Raza and S. Ali, Superconductors for Magnetic Imaging Resonance Applications, Mater. Res. Found., 2022, 132, 230–255 CrossRef CAS.
- Y. S. Greenberg, Application of superconducting quantum interference devices to nuclear magnetic resonance, Rev. Mod. Phys., 1998, 70, 175 CrossRef CAS.
- J.-P. Adriaanse, Advances in Imaging and Electron Physics, Elsevier, 2019, 209, 215–338 Search PubMed.
- D. Williams and C. Carter, Transmission Electron Microscopy: A Textbook for Materials Science; Cambridge library collection; Springer, vol. 1, 2009 Search PubMed.
- P. Bruzzone, W. H. Fietz, J. V. Minervini, M. Novikov, N. Yanagi, Y. Zhai and J. Zheng, High temperature superconductors for fusion magnets, Nucl. Fusion, 2018, 58, 103001 CrossRef.
- N. Mitchell, et al., Superconductors for fusion: a roadmap, Supercond. Sci. Technol., 2021, 34, 103001 CrossRef.
- F. N. Werfel, U. Floegel-Delor, R. Rothfeld, T. Riedel, B. Goebel, D. Wippich and P. Schirrmeister, Superconductor bearings, flywheels and transportation, Supercond. Sci. Technol., 2011, 25, 014007 CrossRef.
- P. Bernstein and J. Noudem, Superconducting magnetic levitation: principle, materials, physics and models, Supercond. Sci. Technol., 2020, 33, 033001 CrossRef CAS.
- J. Clarke and F. K. Wilhelm, Superconducting quantum bits, Nature, 2008, 453, 1031–1042 CrossRef CAS PubMed.
- H.-L. Huang, D. Wu, D. Fan and X. Zhu, Superconducting quantum computing: a review, Sci. China Inf. Sci., 2020, 63, 1–32 Search PubMed.
- J. A. Flores-Livas, L. Boeri, A. Sanna, G. Profeta, R. Arita and M. Eremets, A perspective on conventional high-temperature superconductors at high pressure: Methods and materials, Phys. Rep., 2020, 856, 1–78 CrossRef CAS.
- A. P. Drozdov, M. I. Eremets, I. A. Troyan, V. Ksenofontov and S. I. Shylin, Conventional superconductivity at 203 kelvin at high pressures in the sulfur hydride system, Nature, 2015, 525, 73 CrossRef CAS PubMed.
- A. Drozdov, P. Kong, V. Minkov, S. Besedin, M. Kuzovnikov, S. Mozaffari, L. Balicas, F. Balakirev, D. Graf and V. Prakapenka, others Superconductivity at 250 K in lanthanum hydride under high pressures, Nature, 2019, 569, 528–531 CrossRef CAS PubMed.
- P. Kong, V. S. Minkov, M. A. Kuzovnikov, A. P. Drozdov, S. P. Besedin, S. Mozaffari, L. Balicas, F. F. Balakirev, V. B. Prakapenka, E. Greenberg and M. I. Eremets, Superconductivity up to 243 K in yttrium hydrides under high pressure, Nat. Commun., 2021, 12, 5075 CrossRef CAS PubMed.
- R. H. Lavroff, J. Munarriz, C. E. Dickerson, F. Munoz and A. N. Alexandrova, Chemical bonding dictates drastic critical temperature difference in two seemingly identical superconductors, Proceedings of the National Academy of Sciences, 2024, 121, e2316101121 CrossRef CAS.
- X. Li, X. Zhang, Y. Liu and G. Yang, Bonding-unsaturation-dependent superconductivity in P-rich sulfides, Matter Radiat. Extremes, 2022, 7, 048402 CrossRef CAS.
- F. Belli, T. Novoa, J. Contreras-García and I. Errea, Strong correlation between electronic bonding network and critical temperature in hydrogen-based superconductors, Nat. Commun., 2021, 12, 5381 CrossRef CAS PubMed.
- M. E. di Mauro, B. Braïda, I. Errea, T. Novoa and J. Contreras-García, Molecularity: a fast and efficient criterion for probing superconductivity, 2024 Search PubMed.
- A. Wilver, C. C. Muriel, N. Trinidad and J. Contreras-García, Introducing electron correlation in solid-state calculations for superconducting states, Faraday Discuss., 2024, 1–14 Search PubMed.
- A. D. Becke and K. E. Edgecombe, A simple measure of electron localization in atomic and molecular systems, J. Chem. Phys., 1990, 92, 5397–5403 CrossRef CAS.
- C. F. von Weizsäcker, Zur Theorie der Kernmassen, Z. Phys., 1935, 96, 431–458 CrossRef.
- A. Savin, A. D. Becke, J. Flad, R. Nesper, H. Preuss and H. G. von Schnering, A New Look at Electron Localization, Angew Chem. Int. Ed. Engl., 1991, 30, 409–412 CrossRef.
- R. F. W. Bader, Atoms in Molecules: A Quantum Theory, Oxford Univ. Press, 1990 Search PubMed.
- M. Calatayud, J. Andrés, A. Beltrán and B. Silvi, Theor. Chem. Acc., 2004, 112, 453 Search PubMed.
- P. G. Mezey, Quantum chemical shape: new density domain relations for the topology of molecular bodies, functional groups, and chemical bonding, Can. J. Chem., 1994, 72, 928–935 CrossRef CAS.
- A. Denchfield, H. Park and R. J. Hemley, Electronic structure of nitrogen-doped lutetium hydrides, Phys. Rev. Mater., 2024, 8, L021801 CrossRef CAS.
- A. Denchfield; H. Park; R. J. Hemley, Designing Quaternary Hydrides with Potential High T _c Superconductivity, arXiv, preprint, arXiv:2403.01688, 2024, Search PubMed.
- A. Otero-de-la-Roza, M. A. Blanco, Á. M. Pendás and V. Luaña, Critic: a new program for the topological analysis of solid-state electron densities, Comput. Phys. Commun., 2009, 180, 157–166 CrossRef CAS.
- A. Otero-de-la-Roza, E. R. Johnson and V. Luaña, Critic2: A program for real-space analysis of quantum chemical interactions in solids, Comput. Phys. Commun., 2014, 185, 1007–1018 CrossRef CAS.
- J. Contreras-Garcia, A. M. Pendas, B. Silvi and J. M. Recio, Computation of local and global properties of the ELF topology in crystals, J. Chem. Theory Comput., 2009, 113, 1068 CAS.
- P. Giannozzi, et al., QUANTUM ESPRESSO: a modular and open-source software project for quantum simulations of materials, J. Phys.: Condens. Matter, 2009, 21, 395502 CrossRef PubMed.
- P. Giannozzi, et al., Advanced capabilities for materials modelling with Quantum ESPRESSO, J. Phys.: Condens. Matter, 2017, 29, 465901 CrossRef CAS PubMed.
- B. Silvi and A. Savin, Classification of chemical bonds based on topological analysis of electron localization functions, Nature, 1994, 371, 683 CrossRef CAS.
- J. Contreras-García, P. Mori-Sánchez, B. Silvi and J. M. Recio, A Quantum Chemical Interpretation of Compressibility in Solids, J. Chem. Theory Comput., 2009, 5, 2108–2114 CrossRef PubMed.
- M. Kohout and A. Savin, Int. J. Quantum Chem., 1996, 60, 875–882 CrossRef CAS.
- T. H. Cormen, C. E. Leiserson, R. L. Rivest and C. Stein, Introduction to algorithms, The MIT Press, Cambridge, Massachusetts, 3rd edn, 2009, p. 594 Search PubMed.
- H. Liu, I. I. Naumov, R. Hoffmann, N. W. Ashcroft and R. J. Hemley, Potential high-Tc superconducting lanthanum and yttrium hydrides at high pressure, Proc. Natl. Acad. Sci. U. S. A., 2017, 114, 6990–6995 CrossRef CAS.
- G. Wu, Y. Ma, H. Yu, D. Li, B. Liu and T. Cui, Prediction of stoichiometric poh n compounds: crystal structures and properties, RSC Adv., 2015, 5, 103445–103450 RSC.
- D. Duan, F. Tian, Y. Liu, X. Huang, D. Li, H. Yu, Y. Ma, B. Liu and T. Cui, Enhancement of Tc in the atomic phase of iodine-doped hydrogen at high pressures, Phys. Chem. Chem. Phys., 2015, 17, 32335–32340 RSC.
- J. H. Friedman, Greedy function approximation: a gradient boosting machine, Ann. Math. Stat., 2001, 1189–1232 Search PubMed.
- F. Pedregosa, et al., Scikit-learn: Machine Learning in Python, Journal of Machine Learning Research, 2011, 12, 2825–2830 Search PubMed.
Footnotes |
| † Electronic supplementary information (ESI) available. See DOI: https://doi.org/10.1039/d4sc04465g |
| ‡ The molecularity index is the highest value of the (3, −1) points of the ELF that split all hydrogens into separate f-domains. |
| § In the original reference, 132 binary systems are computed, but three of those have been taken out due to irreproducibility of the original results: C2/c-KH6 at 166 GPa, Pmmn-SbH3 at 300 GPa, and P63/mmc-HTe at 300 GPa. |
| This journal is © The Royal Society of Chemistry 2025 |


