 Open Access Article
Potassium escaping balances the degree of graphitization and pore channel structure in hard carbon to boost plateau sodium storage capacity†
Niubu
LeGe‡
 abc,
Ying-Hao
Zhang‡
ac,
Wei-Hong
Lai
 d,
Xiang-Xi
He
a,
Yun-Xiao
Wang
 d,
Ling-fei
Zhao
 d,
Min
Liu
*b,
Xingqiao
Wu
 *ac and
Shu-Lei
Chou
 *ac
*ac
aInstitute for Carbon Neutralization Technology, College of Chemistry and Materials Engineering, Wenzhou University, Wenzhou, Zhejiang 325035, China. E-mail: xingqiaowu@wzu.edu.cn; chou@wzu.edu.cn
bKey Laboratory of Advanced Functional Materials, Ministry of Education, Faculty of Materials and Manufacturing, Beijing University of Technology, Beijing 100124, China. E-mail: lm@bjut.edu.cn
cWenzhou Key Laboratory of Sodium-Ion Batteries, Wenzhou University Technology Innovation Institute for Carbon Neutralization, Wenzhou, Zhejiang 325035, China
dInstitute for Superconducting and Electronic Materials, Australian Institute for Innovative Materials, University of Wollongong, Innovation Campus, North Wollongong, NSW 2522, Australia
First published on 9th December 2024
Abstract
Biomass holds significant potential for large-scale synthesis of hard carbon (HC), and HC is seen as the most promising anode material for sodium-ion batteries (SIBs). However, designing a HC anode with a rich pore structure, moderate graphitization and synthesis through a simple process using a cost-effective precursor to advance SIBs has long been a formidable challenge. This is primarily because high temperatures necessary for pore regulation invariably lead to excessive graphitization. Herein, innovative guidelines for designing such HC structures are reported by leveraging the inherent potassium in biomass to optimize the pore structure and alleviate graphitization through a novel carbothermal shock (CTS) method. During CTS, potassium-related compounds are effectively released and counteract the tendency of the carbon layers to graphitize by competing for thermal adsorption, thus forming pore channels while mitigating graphitization. The resulting HC anode exhibits an outstanding sodium storage capacity of 357.1 mA h g−1 and a high initial coulombic efficiency of 90.7% at 50 mA g−1. This work provides a new insight into balancing the pore structure and the degree of graphitization of HC to keep sufficient space for Na+ diffusion.
Introduction
Sodium-ion batteries (SIBs) have been perceived as the most suitable technology for low-power electric vehicles and grid energy storage.1 The advancement of electrode materials largely determines the ultimate success of batteries.2 The commercialization of SIBs largely depends on anode materials,3 with hard carbon (HC) anodes showing the most promise,4 while the poor capacity and large capacity loss of HC in initial cycle hinder the development of SIBs.HC anodes exhibit two distinct sodium storage capacities: a sloping capacity above 0.1 volts and a plateau capacity below 0.1 volts.5 The plateau capacity demonstrates high energy density owing to its low operational voltage and strong reversibility.6 In detail, the plateau capacity is derived from two sodium storage mechanisms: storage within the spaces of carbon layers and storage within the pore structure.7 Thus, it is appealing to simultaneously optimize the pore structure while avoiding excessive graphitization for boosting plateau capacity. Some literature studies reported effective strategies to boost plateau capacity from the point of pore-structure optimization, such as using chemical vapor deposition to fill graphitic-like carbon domains into micropores,8 tightening the pore-entrance diameter,9 creating pores and altering open pores to closed pores.10
Biomass is the most suitable precursor to synthesize HC due to its commendable performance,11 wide precursor selectivity,12 low cost and sustainability.13 But the development of biomass-derived HC was restricted to some extent by the inherent ash elements,14 which will be retained in the final HC, leading to adverse effects such as weakened conductivity and occupation of storage sites for Na+.15 Currently, washing procedures before carbonization are commonly conducted to remove ash elements. However, the complex effects varied by the washing process parameter (washing time, acid washing or alkali washing) have been largely ignored.16 Moreover, the use of harsh chemicals poses challenges in terms of cost and environmental pollution.
Considering the effects of ash elements on structural evolution of HC,17 and the great appeal of elevating sodium storage performance of HC by simultaneously optimizing the pore structure and graphitization. Herein, a novel concept is proposed herein that potassium (a common ash element) can act both as a pore-forming agent and a barrier to over-graphitization in one step by optimizing the heating method from traditional tube furnace heating (TFH) to carbothermal shock (CTS). The HC optimized by potassium achieved a sodium-storage capacity of 357.1 mA h g−1 at 50 mA g−1 with an initial coulombic efficiency (ICE) of 90.8%. The full coin cell and pouch cell also exhibited excellent electrochemical performance.
Results and discussion
The effects of potassium retention on the HC structure
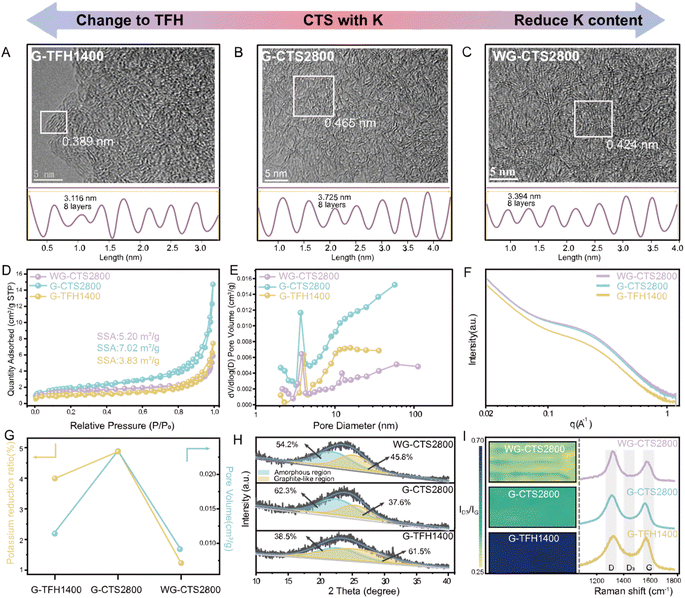
In this part, three different HCs were synthesized to investigate the impact of heating methods on the structural evolution of HC (Fig. S1 and S2†). Specifically, G-TFH1400 was synthesized via the TFH method using potassium-rich primitive gourd, while G-CTS2800 was synthesized through the CTS method also using the same precursor. Potassium-poor washed gourd was used to synthesize WG-CTS2800 via the same CTS process to examine the effects of potassium in CTS. Initially, the Inductively Coupled Plasma Optical Emission Spectroscopy (ICP-OES) and Energy Dispersive Spectroscopy (EDS) techniques were employed to investigate the content of ash elements (Table S1†). The analysis of potassium residual shows that G-CTS2800 has the highest potassium reduction, compared to G-TFH1400 and WG-CTS2800. Moreover, the result of X-ray Photoelectron Spectroscopy (XPS) also shows the different potassium content of these HCs (Fig. S3†). Furthermore, high-resolution transmission electron microscopy (HRTEM) images enable a more detailed examination of structural differences (Fig. 1A–C), where G-CTS2800 displays the most enriched pore structure and the largest D002 of 0.465 nm, aligned with its highest reduction of potassium. In contrast, G-TFH1400 exhibits a denser structure characterized by a higher degree of graphitization, with a minimal D002 of only 0.389 nm. Meanwhile WG-CTS2800 shows a decreased pore structure and increased graphitization, corresponding to its decreased potassium reduction.The pore structure was further analyzed by N2 adsorption/desorption measurements. The isotherms of the three HCs exhibit a type-IV curve (Fig. 1D). According to the Brunauer–Emmett–Teller (BET) theory, the specific surface areas (SSAs) are 3.83 m2 g−1, 7.02 m2 g−1, and 5.20 m2 g−1 for G-TFH1400, G-CTS2800, and WG-CTS2800, respectively. Pore distribution, as shown in Fig. 1E, indicates that all HCs contain both mesopores (2–50 nm) and macropores (>50 nm) but are dominated by pores with diameters around 4 nm. In comparison with G-CTS2800, WG-CTS2800 exhibits a decrease in SSA, pore volume and especially of mesopores, indicating that the pores (mainly mesopores) are, to some extent, induced by potassium escape. Small-angle X-ray scattering (SAXS) is used to detect not only open pores but also closed pores. The SAXS patterns show a shoulder between 0.1 and 0.5 Å−1 (Fig. 1F), which results from the closed micropores.18 The shoulder position around 0.2 Å−1 for G-CTS2800 and WG-CTS2800 is lower than that for G-TFH1400, indicating a more favorable formation of larger closed pores by CTS.19 As summarized in Fig. 1G, the increased reduction of potassium corresponds to a higher pore volume, validating the pore formation induced by potassium escape. The broadened peak of (002) in the X-ray diffraction (XRD) pattern can fit into two regions (Fig. 1H). Specifically, G-TFH1400 has the highest proportion of the graphite-like region, reaching up to 61.5%, consistent with the results from HR-TEM. WG-CTS2800 exhibits an increased graphite-like region compared to G-CTS2800 from 37.6% to 45.8%, because the heat competition of potassium with the carbon layer is weakened.20 For the Raman test, all three HCs exhibit typical spectra of HC, with three broad peaks situated at ∼1350 cm−1 (D-band), ∼1500 cm−1 (D3-band) and 1590 cm−1 (G-band). The intensity ratio of the D3 band to the G band (ID3/IG) serves as an indicator for amounts of defects and oxygen functional groups, with smaller ID3/IG corresponding to fewer defects.21 As depicted in Fig. 1I, G-CTS2800 and WG-CTS2800 display the lowest ID3/IG, which implies that the CTS method is more effective in breaking heteroatom groups than the TFH method. Conversely, WG-CTS2800 exhibits lower defectiveness compared to G-CTS2800, which aligns with the theory that potassium, acting as a competitor for heat absorption, results in more heat being applied to break the heteroatom groups.
For the structural evolution of biomass-derived HC in the CTS method, the inherent potassium not only can effectively escape but also plays dual beneficial roles: on the one hand, potassium escapes from the biomass interior to form pore channels; on the other hand, potassium competes with carbon layers for heat absorption to mitigate the mobility of the carbon layers at high-temperature and thus alleviates the degree of graphitization to retain a large D002. In the TFH method, compared to G-TFH1400, G-TFH2000 was synthesized at 2000 °C which successfully enabled the escape of potassium (Fig. S4a†). However, the larger thermal input in TFH not only resulted in the collapse of mesopores (Fig. S4b†) but also caused over-graphitization (Fig. S4c and d†). It is obvious that potassium plays an important role during the hard carbon pyrolysis process, and the patterns of structural evolution of biomass-derived HC in the CTS method and TFH method are summarized in Fig. 2.
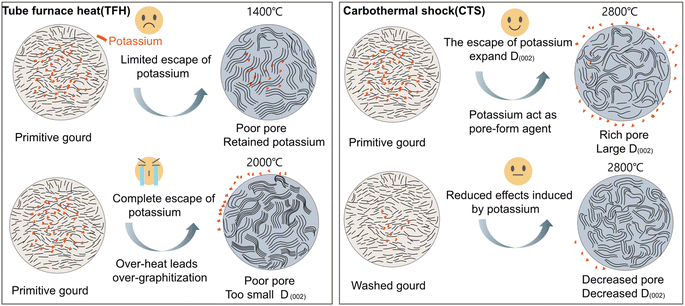 | ||
| Fig. 2 The patterns and effects on hard carbon structural evolution induced by potassium in the TFH method and CTS method. | ||
The structural evolution of HC by the escape of potassium
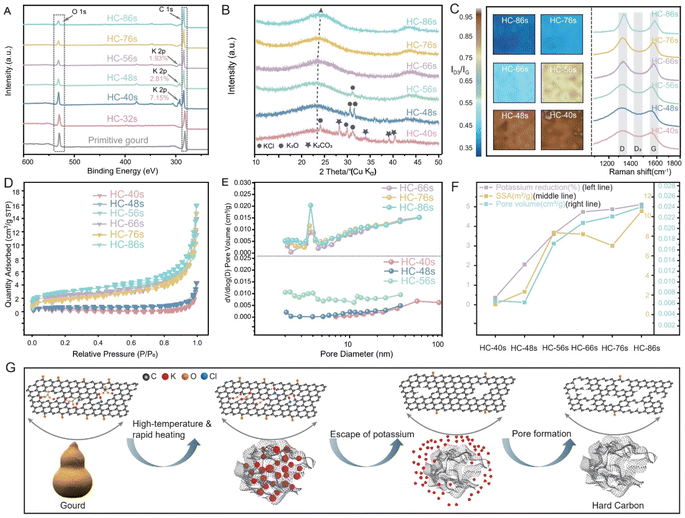
To investigate potassium evolution and its impact on the HC structure during the CTS process, we initially conducted an ex situ study by varying heating temperature and holding time at a rate of 50 °C s−1, ranging from 1200 °C to 2800 °C. For simplicity, the synthesized HCs are labeled by synthesis time: for example, HC-56s represents heating to 2800 °C at 50 °C s−1 without holding, while HC-86s represents heating to 2800 °C at 50 °C s−1 with a 30 s holding time. The samples with synthesis times over 56 seconds include additional holding periods at 2800 °C. Additionally, to further explore the effects of heating temperature and rate on HC structural evolution, we denote synthesized HC samples as G-T-R-t (for gourd-derived) or WG-T-R-t (for washed gourd-derived), where T is the heating temperature, R is the heating rate, and t is the holding time, and comprehensive characterization techniques were conducted during the ex situ CTS process. The analysis of potassium states was first performed through XPS (Fig. 3A). Notably, there were no potassium peaks in primitive-gourd and HC-24s, until the HC-40s. This absence could be attributed to the limitations of XPS, which primarily probes the surface of the samples, while potassium might be predominantly stored within the interior of precursor particles. As the thermal input increases (elevating temperature and holding time), potassium migrates to the surface and is accessible to XPS. HC-40s exhibits a distinctive potassium signal, showing a potassium content of 7.15 wt%. Subsequently, the potassium content decreases with increased thermal input (Fig. 3A, S5 and S6†). In HC-56s, the potassium content is reduced to only 1.93 wt%, and it has essentially been eliminated by extending the holding time post 56s. All HCs show a broad XRD peak at 2θ of ∼24° (Fig. 3B), corresponding to the (002) diffraction of typical amorphous carbon, while the peak of K-related species disappears as the reaction progresses. The structural evolution was further examined through Raman spectroscopy. Both the D-band and G-band show narrowed half-width at half-maximum accompanied by increased intensity with increased thermal input (Fig. 3C), signifying an augmented formation of graphite-like regions, consistent with the observations from HRTEM images (Fig. S7†). Notably, HC-86s (with the highest thermal input) exhibits the most pronounced graphite-like regions indicated by the sharpest G-band. However, the mapping of ID3/IG (Fig. 3C) reveals a declining trend from HC-40s (0.95) to HC-86s (0.35), underscoring the efficacy of heightened thermal input in defect reduction. Furthermore, N2 adsorption–desorption measurement was conducted to evaluate the pore structure. HC-40s exhibits a type-III isotherm (Fig. 3D), suggesting a weak interaction between the HCs and N2 molecules at low relative pressures (P/P0). Meanwhile a noticeable increase is observed at higher relative pressures (P/P0 > 0.9), indicating the presence of macropores but a lack of micropores. The pore size distribution further illustrates the predominance of macropores (Fig. 3E), possibly inherited from the primitive-gourd. With an increase in thermal input, HC-48s exhibits a mixed type-III and -IV feature, wherein the adsorbed quantity progressively increases, particularly at higher relative pressures (P/P0 > 0.9). This suggests the existence of a hierarchical pore structure comprising mesopores and macropores. The pore size distribution revealed the collapse in macropores but the formation of mesopores (Fig. 3E). The collapsed macropores could be attributed to the rearrangement of carbon layers, while the formed mesopores might have been induced by the 1.68 wt% of potassium-escape. When further increasing the thermal input, the adsorption/desorption isotherm transforms into a type-IV curve, indicating the prevalence of mesopores. The significant increase in mesopores is attributed to the 1.57 wt% of potassium-escape. However, for HC-66s/HC-76s/HC-86s, the adsorption/desorption isotherms remain similar to that of HC-56s (Fig. 3E), which suggests that extending the dwelling time at 2800 °C (post 56 seconds) has minimal influence on pore distribution.As illustrated in Fig. 3F and Table S2,† the elevated thermal input facilitated the escape of potassium, resulting in the formation of pore channels. This is reflected in the increased pore volume, increasing from 0.006 cm3 g−1 (HC-40s) to 0.024 cm3 g−1 (HC-86s), and a concurrent rise in SSA from 1.07 m2 g−1 (HC-40s) to 10.5 m2 g−1 (HC-86s). With increased thermal input, the pore volume and potassium-escape ratio increase continuously, suggesting an ongoing formation of pore channels. Interestingly, the SSA exhibits three patterns of variation: increasing from HC-40s to HC-56s, decreasing from HC-56s to HC-76s (G-CTS2800), and again increasing from HC-76s to HC-86s. This implies that at relatively low temperature, the increased thermal input is more applied to form pore channels, while extending the dwelling time at 2800 °C has a more pronounced impact on restructuring the pores, promoting the formation of closed pores, consequently leading to a reduction in the SSA;22 the collapse of some macropores during this stage also contributes to the decreased SSA. Conversely, some closed pores reopen with excessive thermal input,23 resulting in an increased SSA from HC-76s to HC-86s.
Furthermore, we investigated the effects of heating parameters on the structural evolution of hard carbon (Fig. S8–S10 and Table S3†) by synthesizing three additional HCs: G2400-50-20s, G2800-25-20s, and G2800-100-20s. When lowering the heating temperature to 2400 °C for G2400-50-20s, we observed a clear increase in the degree of local graphitization compared to G2800-50-20s, indicating that elevated temperatures lead to a higher degree of local graphitization. Additionally, although the potassium escape ratio of G2400-50-20s (4.21%) was lower than that of G2800-50-20s (4.87%), its SSA was significantly higher (23.73 cm2 g−1vs. 7.02 cm2 g−1). This suggests that under low thermal input conditions, pore channels form from the curling and intertwining of adjacent carbon layers rather than from potassium escape. Upon altering the heating rate, an increase in the degree of graphitization was observed, regardless of whether the rate was increased (G2800-100-20s) or decreased (G2800-25-20s). Compared to G2800-50-20s, G2800-25-20s exhibited a higher potassium escape ratio and a larger SSA, resulting in a higher capacity (371.4 mA h g−1vs. 357.1 mA h g−1). While potassium escape somewhat alleviates graphitization, this positive effect is counterbalanced by the greater local graphitization resulting from the larger thermal input. Consequently, the ICE of G2800-25-20s is lower than that of G2800-50-20s. In contrast, for G2800-100-20s, while it avoids excessive graphitization associated with larger thermal input, it also loses the beneficial effect of potassium escape in alleviating local graphitization. Thus, it exhibits a higher degree of graphitization than G2800-50-20s, leading to a lower capacity of 340.1 mA h g−1 and an ICE of only 87.6%. In summary, the optimal thermal input—varying with heating temperature, rate, and duration—achieved through the carbothermal shock method establishes the best balance of potassium escape, an appropriate degree of graphitization, and the development of pore-channel structures.
Overall, as depicted in Fig. 3G, potassium-related chemicals (K2CO3, K2O, and KCl) exist within the internal space of the gourd. As the temperature increases, weakly connected functional groups on the surface first break, releasing small molecules to form micropores. Simultaneously, the carbon layer undergoes structural rearrangement, and K2CO3 decomposes into K2O and CO2. But K2O and KCl will persist within the structure enclosed by the carbon layer due to their high thermal stability, until a sufficient temperature (above 2400 °C, after 48 seconds) is reached, at which point they sublime into gaseous molecules. These gaseous molecules, possessing elevated free energy, exhibit a strong tendency to escape from internal space to external. This exerts expansive forces on the carbon layer, serving as a buffer against the carbon layers to form graphite-like regions. Ultimately, the potassium escapes, forming pore channels within the carbon matrix.
Sodium storage performance and the mechanism of HC
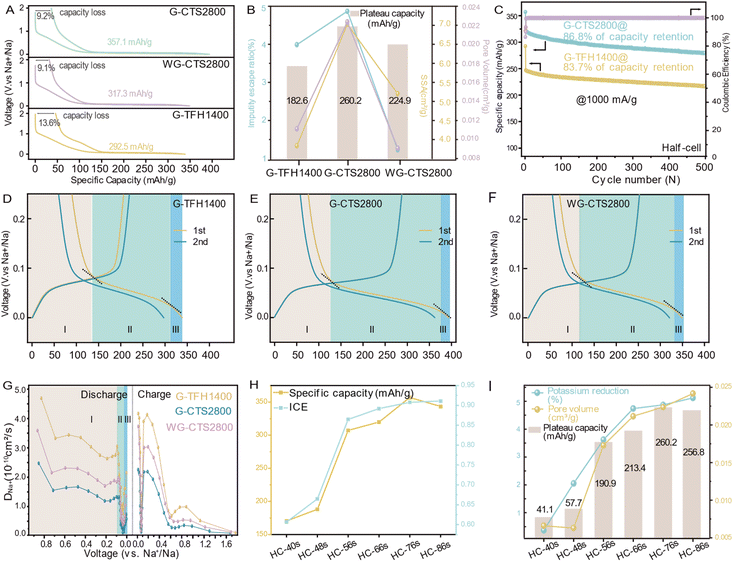
The synthesized HCs were first assembled into Na‖HC half-cells for the galvanostatic test at 50 mA g−1. All displayed typical HC voltage–capacity curves, featuring a slope-region above 0.1 V and a plateau-region below 0.1 V (Fig. 4A). The initial reversible capacity of G-TFH1400 was 292.5 mA h g−1, with a plateau capacity of 182.6 mA h g−1. However, it exhibited a significant irreversible capacity loss of 13.6% in the initial cycle. The dQ/dV–V curve of G-TFH1400 showed a notable irreversible capacity around 1 V (Fig. S11a†), indicating Na+ reacting with the electrolyte to form a SEI, and the disparity between the first and second discharge curves corresponded to the maximum irreversible capacity (Fig. S11b†). Compared to G-TFH1400, G-CTS2800 exhibited an increased capacity of 64.1 mA h g−1 and a decreased capacity loss (Fig. 4A and S11d†) with a highest reversible capacity of 357.1 mA h g−1. Remarkably, the plateau capacity increased by 77.6 mA h g−1. The voltage–capacity curves of WG-CTS2800 exhibited excellent overlap with those of G-CTS2800, with nearly identical ratios of initial capacity loss. WG-CTS2800 exhibited a reduction of 39.8 mA h g−1 in the initial reversible capacity, primarily attributed to a reduction of 35.3 mA h g−1 from the plateau capacity.The relationship between the pore structure, potassium-escape ratio and plateau-capacity variation is illustrated in Fig. 4B, indicating that pore channel formation is induced by potassium and finally boosting plateau-capacity. This effect is further supported by the dQ/dV–V curve, as G-CTS2800 exhibited the highest reduction peak intensity in the plateau region, suggesting abundant Na+ storage sites (Fig. S11a, c and e†), corresponding to its richest pore volume. G-CTS2800 also demonstrated excellent rate performance (Fig. S12†). Even at a high current density of 1000 mA g−1, it retained a reversible capacity of 299.8 mA h g−1 and recovered to 346.8 mA h g−1 when the current density reverted to 50 mA g−1, highlighting the structural stability during the discharge/charge process. This was further demonstrated in long cycling tests at 1000 mA g−1, where a mere 13.2% capacity loss occurred after 500 cycles (Fig. 4C). Table S4† shows a comparison of the sodium storage performance and synthesis time between our work and the reported literature, indicating the advantage of G-CTS2800 with high reversible capacity and low synthesis time and still with an excellent sodium storage performance.
The galvanostatic discharge/charge curve of HC consists of three segments characterized by different slopes, thus distinguishing the macroscopic sodium storage capacity into three microscopic behaviors is accurate, and the overall capacity is distinguished into capacity I/II/III (Fig. 4D–F). The three sodium storage behaviors are further illustrated by kinetic processes of Na+ storage from the galvanostatic intermittent titration technique (GITT) in Fig. S13.† All exhibit a slight decrease followed by a sharp decrease, but recover prior to the end of discharge (Fig. 4G). At the initial stage, DNa+ was high, because Na+ tends to store at defective sites,24,25 which have a strong electron affinity and are energetically favorable for Na+ due to its low-energy unoccupied electronic orbitals.26 At the middle stage, the sharply decreased DNa+ is imposed by the barriers from the SEI and the repulsion from pre-adsorbed Na+,24,25 and the difficulty in forming a stable Na–graphite compound.27 However the reverse sharp increase of DNa+ is due to the quasi-metallic sodium-cluster in pores because the formation of the Na–Na bond is more energetically favorable than Na–C.28 The relationship between microscopic structural parameters and different-stage capacities (Fig. S14†) indicates that the capacity I primarily arises from the adsorption of Na+ at defect sites.29 The capacity II may result from the combination of intercalation and pore adsorption, warranting further investigation for clarification. For the capacity III, a study suggests that the accumulation of Na* with a reduced positive charge (0 < * < 1) diminishes the repulsion between Na* towards the end of the discharge, which may induce the formation of sodium clusters.9 We then attribute capacity III to sodium-cluster formation. Capacity II is the largest contribution of whole reversible capacity, benefiting from the balance between the pore structure and graphitization. The concept is illustrated in an ex situ process. In general, potassium progressively escapes from the gourd with increased thermal input, facilitating the formation of pore channels that act as storage sites for Na+ (Fig. 4I), and finally enhancing plateau capacity (Fig. 4I), reversible capacity and ICE (Fig. 4H and S15†). Interestingly, despite the continuous effects of increased thermal input, HC-86s, with the highest pore volume, exhibited a decrease in plateau capacity. This is attributed to excessive thermal input causing over-graphitization and a reduction in interlayer spacing (Fig. S9†), affecting the ease of Na+ entry into pore channels and potentially leading to incomplete filling,7 despite having the most pore channels in HC-86s. Therefore, to achieve the highest capacity, it is crucial to balance the pore structure and the degree of graphitization.
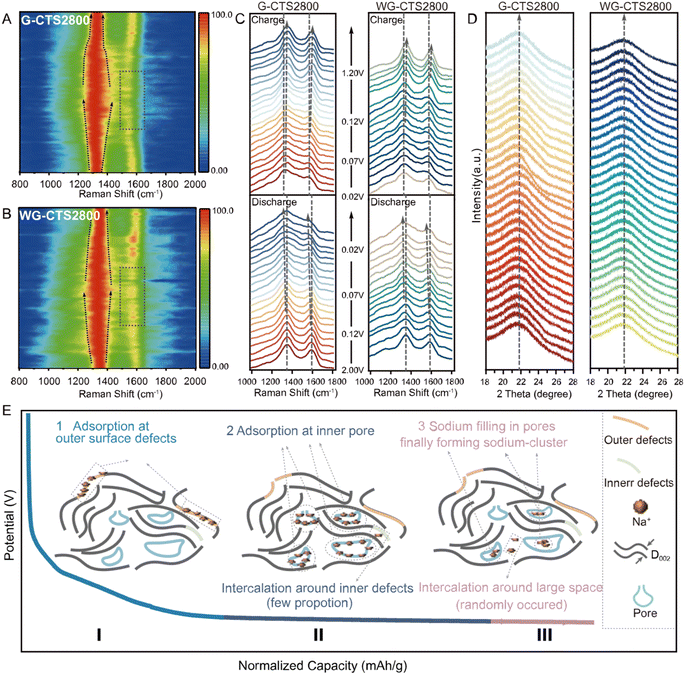
In situ Raman spectroscopy and in situ XRD were conducted to further elucidate the sodium storage mechanism. In the results of in situ Raman spectroscopy (Fig. 5A and B), the D-band peak gradually broadened in the whole discharge process, indicating that adsorption primarily controls the mechanism.30 The intensity of the G-band and the D-band decreases in the voltage corresponding to capacity II/III (Fig. 5C), which is triggered by the suppression of carbon ring breathing vibrations due to Na+ adsorption on the pore surface.31 This indicates that Na+ adsorption on pore walls is responsible for capacity II/III. The G-band shows no shift in the voltage region corresponding to capacity I (2.0–0.07 V), but shows a red-shift in the voltage region corresponding to capacity II and capacity III (0.07–0.0 V), which is attributed to Na+ insertion into the carbon layers, weakening and lengthening C–C bonds, and causing electron transfer to π* anti-bonding bands.32 Thus, Na+ intercalation behavior somewhat contributes to capacity II and capacity III. However, no (002) peak shift was observed in in situ XRD throughout the entire discharge/charge process (Fig. 5D), and this may be because the large D002 and amorphous structure of G-CTS2800/WG-CTS2800 can suppress the expansion induced by Na+ intercalation.33 So, Na+ may randomly intercalate into the carbon layers rather than forming a staged GIC compound in capacity II/III.8,31 But a slight narrowing of the (002) peak was observed at the end of discharge corresponding to capacity III (Fig. S16†), indicating the sodium filling in nanopores and ultimately forming quasi-metallic sodium-clusters.34
In light of the comprehensive analysis, we propose that the storage of Na+ in HC involves four distinct electrochemical behaviors: (1) adsorption at surface active sites; (2) adsorption at inner pores; (3) intercalation into the interlayer space; (4) filling in nanopores and finally forming sodium-clusters, which can be categorized into three parts of capacity (Fig. 5E). Initially, Na+ adsorbs at defect sites and oxygen functional groups on the HC surface, constituting the primary portion of capacity I. Subsequently, Na+ adsorbs on the pore walls, forming capacity II, which constitutes the majority of the overall capacity. It is worth noting that, a fraction of Na+ intercalates near defects, collectively contributing to capacity II. As the discharge process progresses, Na+ tends to act as electron acceptors compared to pore walls, and some Na+ share electrons, leading to a reduction in their positive charge and the potential formation of quasi-metallic sodium-clusters, giving rise to capacity III along with randomly occurring intercalation behavior.
Real implications
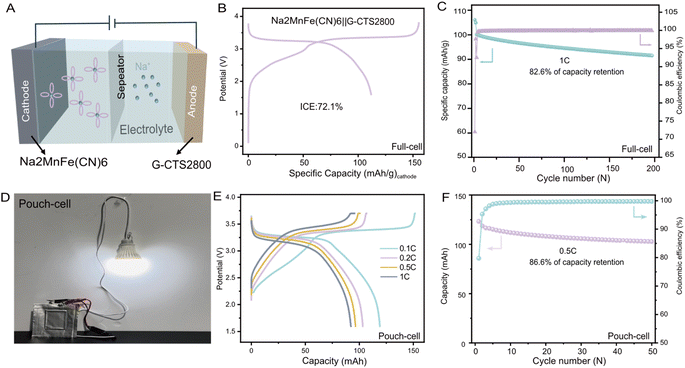
To further validate its practicality, G-CTS2800 was paired with the Na2MnFe(CN)6 cathode material (more detailed information about Na2MnFe(CN)6 can be seen in Fig. S17†) to assemble a full cell (Fig. 6A), and the positive/negative ratio was 1.04. The full cell demonstrated a high discharge capacity of 111.8 mA h g−1 at 0.25C (based on the cathode material mass), accompanied by a relatively high output voltage of 3.4 V (Fig. 6B). Even after 200 cycles at 1C, the assembled full cell retained a high discharge capacity of 82.7 mA h g−1 (based on the cathode material mass) with a capacity retention of 82.6%, demonstrating its exceptional cycling stability (Fig. 6C). The energy density of the full cell was calculated to be 278.6 W h kg−1 using Formula (S1).† Additionally, a pouch cell of Na2MnFe(CN)6‖G-CTS2800 was assembled and successfully lit a light bulb (Fig. 6D), demonstrating its technological feasibility for energy storage applications. Rate performance tests indicate superior kinetics of the Na2MnFe(CN)6‖G-CTS2800 SIB with a high capacity of 103.642 mA h at 1C, as shown in Fig. 6E. The long-term cycling performance of the pouch cell at 0.5C, as shown in Fig. 6F, revealed a capacity retention of 86.6% after 50 charge–discharge cycles.Conclusions
It is generally believed that potassium has adverse effects on HC and should be avoided as much as possible. However, the dual beneficial effects of potassium have been revealed in this work: it acts as a pore-forming agent and expands interlayer spacing, but only with an appropriate heating method (such as CTS conducted in this work), resulting in boosted capacity at low potential. The optimized HC exhibits a high reversible capacity of 357.1 mA h g−1 and an ICE of 90.1%. Importantly, with the aim of practical application, the full coin cell and pouch cell were constructed with prussian blue cathode, showing excellent electrochemical performance. With the help of in situ characterization techniques, the sodium storage mechanism in HC is elucidated clearly. Looking ahead, our findings contribute to ongoing efforts in designing and optimizing advanced HC anodes, specifically focusing on boosting plateau capacity.Data availability
The data supporting this article have been included as part of the ESI.†Author contributions
The initial idea was conceived by N. B. LeGe, X. X. He, and X. Q. Wu. N. B. LeGe, and Y. H. Zhang conducted the experiments and data analysis. W. H. Lai, Y. X. Wang and L. F. Zhao performed the in situ XRD test. The initial draft of the manuscript was written by N. B. LeGe and later refined by X. Q. Wu, M. Liu, and S. L. Chou. All authors have reviewed and approved the final manuscript.Conflicts of interest
There are no conflicts to declare.Acknowledgements
This work was financially supported by the National Natural Science Foundation of China (No. 52402302; 52250710680), High-end Foreign Experts Recruitment Plan of China (G2023016009L), National Key R&D Program of China 2021YFB3500800, Zhejiang Provincial Natural Science Foundation of China (LQ24E020001), Science and Technology Program of Anhui Province (201903a07020002), Key Research and Development Program of Zhejiang Province (2024C01057 and 2023C01232), and Wenzhou Natural Science Foundation (G2023016).References
- (a) K. S. Nielsen, S. van der Linden and P. C. Stern, Joule, 2020, 4, 1613 CrossRef; (b) N. LeGe, X.-X. He, Y.-X. Wang, Y. Lei, Y.-X. Yang, J.-T. Xu, M. Liu, X. Wu, W.-H. Lai and S.-L. Chou, Energy Environ. Sci., 2023, 16, 5688 RSC; (c) Y. Zhao, Y. Q. Kang, J. Wozny, J. Lu, H. Du, C. L. Li, T. Li, F. Y. Kang, N. Tavajohi and B. H. Li, Nat. Rev. Mater., 2023, 8, 623 CrossRef CAS.
- X. Shen, X.-Q. Zhang, F. Ding, J.-Q. Huang, R. Xu, X. Chen, C. Yan, F.-Y. Su, C.-M. Chen, X. Liu and Q. Zhang, Energy Mater. Adv., 2021, 2021, 1205324 Search PubMed.
- (a) C. Wu, Y. Yang, Y. Zhang, H. Xu, W. Huang, X. He, Q. Chen, H. Dong, L. Li, X. Wu and S. Chou, Angew. Chem., Int. Ed., 2024, 63, e202406889 CrossRef CAS PubMed; (b) F. Wang, Z. Jiang, Y. Zhang, Y. Zhang, J. Li, H. Wang, Y. Jiang, G. Xing, H. Liu and Y. Tang, eScience, 2024, 4, 100181 CrossRef; (c) Y. Li, F. Wu, Y. Li, M. Liu, X. Feng, Y. Bai and C. Wu, Chem. Soc. Rev., 2022, 51, 4484 RSC.
- Y. Li, Y. Lu, C. Zhao, Y.-S. Hu, M.-M. Titirici, H. Li, X. Huang and L. Chen, Energy Storage Convers. Mater., 2017, 7, 130 CrossRef.
- S. Qiu, L. Xiao, M. L. Sushko, K. S. Han, Y. Shao, M. Yan, X. Liang, L. Mai, J. Feng, Y. Cao, X. Ai, H. Yang and J. Liu, Adv. Energy Mater., 2017, 7, 1700403 CrossRef.
- X.-X. He, W.-H. Lai, Y. Liang, J.-H. Zhao, Z. Yang, J. Peng, X.-H. Liu, Y.-X. Wang, Y. Qiao, L. Li, X. Wu and S.-L. Chou, Adv. Mater., 2023, 35, e2302613 CrossRef PubMed.
- L. K. Iglesias, E. N. Antonio, T. D. Martinez, L. Zhang, Z. Zhuo, S. J. Weigand, J. Guo and M. F. Toney, Adv. Energy Mater., 2023, 13, 172 Search PubMed.
- X. Chen, N. Sawut, K. Chen, H. Li, J. Zhang, Z. Wang, M. Yang, G. Tang, X. Ai, H. Yang, Y. Fang and Y. Cao, Energy Environ. Sci., 2023, 16, 4041 RSC.
- Q. Li, X. Liu, Y. Tao, J. Huang, J. Zhang, C. Yang, Y. Zhang, S. Zhang, Y. Jia, Q. Lin, Y. Xiang, J. Cheng, W. Lv, F. Kang, Y. Yang and Q.-H. Yang, Natl. Sci. Rev., 2022, 9, nwac084 CrossRef CAS PubMed.
- (a) K. Wang, F. Sun, H. Wang, D. Wu, Y. Chao, J. Gao and G. Zhao, Adv. Funct. Mater., 2022, 32, 2203725 CrossRef CAS; (b) Q. Meng, Y. Lu, F. Ding, Q. Zhang, L. Chen and Y.-S. Hu, ACS Energy Lett., 2019, 4, 2608 CrossRef CAS; (c) Z. Tang, R. Zhang, H. Wang, S. Zhou, Z. Pan, Y. Huang, D. Sun, Y. Tang, X. Ji, K. Amine and M. Shao, Nat. Commun., 2023, 14, 6024 CrossRef CAS PubMed.
- (a) Y. Yang, C. Wu, X. -X. He, J. Zhao, Z. Yang, L. Li, X. Wu, L. Li and S. -L. Chou, Adv. Funct. Mater., 2023, 33, 2302277 Search PubMed; (b) C. Wu, Y. Yang, Y. Zhang, H. Xu, X. He, X. Wu and S. Chou, Chem. Sci., 2024, 15, 6244 RSC.
- F. Xie, Z. Xu, Z. Guo and M.-M. Titirici, Prog. Energy, 2020, 2, 42002 CrossRef.
- H. Wang, P. Feng, F. Fu, X. Yu, D. Yang, W. Zhang, L. Niu and X. Qiu, Carbon Neutralization, 2022, 1, 277 CrossRef.
- (a) Y. Zhang, C. Wu, Q. Chen, C. Li, W. Huang, Q. Wen, X. He, X. Wu and S. Chou, Chem. Commun., 2024, 60, 13380 RSC; (b) L. Xie, C. Tang, Z. Bi, M. Song, Y. Fan, C. Yan, X. Li, F. Su, Q. Zhang and C. Chen, Adv. Energy Mater., 2021, 11, 2101650 CrossRef CAS.
- A. Beda, J.-M. Le Meins, P.-L. Taberna, P. Simon and C. M. Ghimbeu, Sustainable Mater. Technol., 2020, 26, e00227 CrossRef CAS.
- X. Dou, I. Hasa, D. Saurel, M. Jauregui, D. Buchholz, T. Rojo and S. Passerini, ChemSusChem, 2018, 11, 3276 CrossRef CAS PubMed.
- Y. Li, J. Shi, F. Wu, Y. Li, X. Feng, M. Liu, C. Wu and Y. Bai, ACS Appl. Mater. Interfaces, 2024, 16, 2397 CrossRef CAS PubMed.
- D. Saurel, J. Segalini, M. Jauregui, A. Pendashteh, B. Daffos, P. Simon and M. Casas-Cabanas, Energy Storage Mater., 2019, 21, 162 CrossRef.
- V. Simone, A. Boulineau, A. de Geyer, D. Rouchon, L. Simonin and S. Martinet, J. Energy Chem., 2016, 25, 761 CrossRef.
- F. Wu, L. Liu, Y. Yuan, Y. Li, Y. Bai, T. Li, J. Lu and C. Wu, ACS Appl. Mater. Interfaces, 2018, 10, 27030 CrossRef CAS PubMed.
- (a) A. Sadezky, H. Muckenhuber, H. Grothe, R. Niessner and U. Pöschl, Carbon, 2005, 43, 1731 CrossRef CAS; (b) A. Pozio, M. Di Carli, A. Aurora, M. Falconieri, L. Della Seta and P. P. Prosini, Nanomaterials, 2022, 12, 1349 CrossRef CAS PubMed.
- (a) Q. Meng, Y. Lu, F. Ding, Q. Zhang, L. Chen and Y.-S. Hu, ACS Energy Lett., 2019, 4, 2608 CrossRef CAS; (b) Y. Li, Y. Lu, Q. Meng, A. C. S. Jensen, Q. Zhang, Q. Zhang, Y. Tong, Y. Qi, L. Gu, M. -M. Titirici and Y. -S. Hu, Adv. Energy Mater., 2019, 9, 1902852 CrossRef CAS.
- J. J. Kipling, J. N. Sherwood, P. V. Shooter and N. R. Thompson, Carbon, 1964, 1, 321 CrossRef CAS.
- Y. Li, Y.-S. Hu, M.-M. Titirici, L. Chen and X. Huang, Adv. Energy Mater., 2016, 6, 1600659 CrossRef.
- Z. Li, C. Bommier, Z. Sen Chong, Z. Jian, T. W. Surta, X. Wang, Z. Xing, J. C. Neuefeind, W. F. Stickle, M. Dolgos, P. A. Greaney and X. Ji, Adv. Energy Mater., 2017, 7, 1602894 CrossRef.
- J. Um, S. U. Yoon, H. Kim, B. S. Youn, H.-J. Jin, H.-K. Lim and Y. S. Yun, J. Energy Chem., 2022, 67, 814 CrossRef CAS.
- Y. Wen, K. He, Y. Zhu, F. Han, Y. Xu, I. Matsuda, Y. Ishii, J. Cumings and C. Wang, Nat. Commun., 2014, 5, 4033 CrossRef CAS PubMed.
- (a) I. Escher, G. A. Ferrero, M. Goktas and P. Adelhelm, Adv. Mater. Interfaces, 2022, 9, 2100596 CrossRef CAS; (b) Y. Jin, S. Sun, M. Ou, Y. Liu, C. Fan, X. Sun, J. Peng, Y. Li, Y. Qiu, P. Wei, Z. Deng, Y. Xu, J. Han and Y. Huang, ACS Appl. Energy Mater., 2018, 1, 2295 CrossRef CAS.
- R. Dong, F. Wu, Y. Bai, Q. Li, X. Yu, Y. Li, Q. Ni and C. Wu, Energy Mater Adv, 2022, 2022, 9896218 Search PubMed.
- J. Zhao, X. -X. He, W. -H. Lai, Z. Yang, X. -H. Liu, L. Li, Y. Qiao, Y. Xiao, L. Li, X. Wu and S. -L. Chou, Adv. Energy Mater., 2023, 13, 2830 Search PubMed.
- L. J. Hardwick, P. W. Ruch, M. Hahn, W. Scheifele, R. Kötz and P. Novák, J. Phys. Chem. Solids, 2008, 69, 1232 CrossRef CAS.
- H. Euchner, B. P. Vinayan, M. A. Reddy, M. Fichtner and A. Groß, J. Mater. Chem. A, 2020, 8, 14205 RSC.
- S. Alvin, D. Yoon, C. Chandra, H. S. Cahyadi, J.-H. Park, W. Chang, K. Y. Chung and J. Kim, Carbon, 2019, 145, 67 CrossRef CAS.
- C. Cai, Y. Chen, P. Hu, T. Zhu, X. Li, Q. Yu, L. Zhou, X. Yang and L. Mai, Small, 2022, 18, 2105303 CrossRef CAS PubMed.
Footnotes |
| † Electronic supplementary information (ESI) available. See DOI: https://doi.org/10.1039/d4sc04584j |
| ‡ These authors contributed equally. |
| This journal is © The Royal Society of Chemistry 2025 |

