 Open Access Article
Creative Commons Attribution 3.0 Unported Licence
Faraday cup measurements of triboelectrically charged granular material: a modular interpretation methodology
Tom F.
O’Hara
 *,
David P.
Reid
,
Gregory L.
Marsden
and
Karen L.
Aplin

Faculty of Science and Engineering, University Walk, Bristol, BS8 1TR, UK. E-mail: tom.ohara@bristol.ac.uk
First published on 19th December 2024
Abstract
The triboelectric charging of granular material is a long-standing and poorly understood phenomenon, with numerous scientific and industrial applications ranging from volcanic lightning to pharmaceutical production. The most widely utilised apparatus for the study of such charging is the Faraday cup, however, existing analysis of the resulting measurements is often simplistic and fails to distinguish charging due to particle–particle interactions from charging occurring through other mechanisms. Here, we outline a modular approach for interpreting these measurements, enabling triboelectric phenomena to be explored in greater detail. Our approach fits approximated charge distribution shapes to experimental Faraday cup traces. The fitting process uses measured size distributions in combination with simplified models of charge distribution and particle dynamics to predict the relative charging contributions. This modular approach allows scope for adaptation of each aspect to fine-tune the process to specific application cases, making the technique broadly generalisable to any insulating granular material. An example case of volcanic ash showed that samples from the Grímsvötn volcano charged with a greater proportion of particle–particle interactions than ash from Atitlán. Experimental validation is provided using sieved fractions of volcanic ash, where the broader size fractions were found to exhibit greater particle–particle charging. Non-particle–particle charging was also shown to scale with particle size as ∝ d−0.85±0.03p, roughly scaling with the particles' effective surface area.
1 Introduction
Triboelectric phenomena are ubiquitous in both natural and industrial settings, influencing critical processes ranging from volcanic lightning and dust devils to planetary atmospheric electricity.1–5 They also cause electrostatic ignition hazards in chemical processing and can reduce the powder-feeding performance of pharmaceuticals.6,7 Yet despite the wide-ranging impacts of these phenomena, their underpinning mechanisms remain poorly understood. It is unclear whether the transfer of electrons, ions, or bulk material governs this process. Furthermore, efforts to unravel these phenomena are hindered by inconsistencies in how triboelectric charging of granular material is measured and interpreted.8The description of charge transfer is well understood for metals, compared to the insulators responsible for typically stronger triboelectric charging. On contact, metals transfer electrons according to their well-defined work functions. This results in a net negative charge remaining on the metal with a higher work function upon separation. However, the mechanisms behind triboelectric charging in insulators remain poorly understood. Proposed mechanisms include electron or ion transfer, mechanically induced bond breakages, and bulk material movement, each supported and refuted by varying evidence.8,9 Some empirical understanding can be gained by placing materials in a “Triboelectric Series”, in which the polarity of charge obtained from the rubbing of two materials can be predicted.10 Unfortunately, this approach is highly system-dependent, with changes in environmental factors such as temperature and humidity changing the magnitude or even polarity of charging.11–16 It also fails to explain the charging between the same material, such as identical grains that have been shown to charge with a varying size dependence.17
More reliable and well-understood measurements are required to better understand the system dependence of charge transfer in granular materials. Faraday cups are the most widespread and commonly used apparatus for charge measurements of powders.1,18–20 A Faraday cup is a typically cylindrical and shielded conductive vessel that exhibits “electrification by induction” as observed by Faraday in 1849.21 When a charged species impacts the cup, charge is transferred by conduction to the inner electrode, which can be measured using a connected electrometer.22 These charge measurements have a vast array of applications from ion beam characterisation and plasma diagnostics to the charged granular material relevant to this work.23,24 A Faraday cup can be employed to measure the net charge of a sample landing in the cup, as in this work. Measurements can also be obtained purely from electrostatic induction in cases where particles do not make contact, which may be referred to as a “Faraday pail”, although the terms of “cup” and “pail” are used inconsistently in the literature.18,25 The charge carrier may also pass freely through the system, allowing for the measurement of a charged particle's velocity or be used as part of an array of cups to analyse subsets of the sample.22 Electrometers are used to obtain the transferred or induced charge, by measuring the voltage or current and calculating the charge.15
Faraday cups can be used to study the triboelectric charging of single-particles or small clumps of particles charging against different surfaces.19,26 Other techniques involve impacting individual particles on plates, which can be made of the same material to emulate same-material particle charging.27 Charge measurements can also be achieved by measuring the charge on the impacted plate or with particle tracking velocimetry (PTV) where particles in an applied external electric field have their charge deduced from displacement, tracked by a high-speed camera.28,29 PTV can also be employed to probe individual particle–particle collisions.30
When looking at bulk powders, Faraday cups are usually able to detect the polarity and magnitude of powders' net charge, or subsets of sizes of the powder, but are not yet able to characterise the overall charge distribution with respect to size.31 Other techniques can therefore be employed to assist in resolving charge measurements spatially or by size. Electrostatic charge separation, which sorts particles by applying an external electric field, is widely used in industries such as recycling and coal processing and can complement Faraday cup measurements.32–34 PTV approaches can also be applied to groups of particles and have recently detected charges on individual grains up to 76 times greater than their samples' average, which traditional Faraday cup methods would produce.35,36 This work aims to formulate a model in which contributions to Faraday cup charge measurements of granular material can be separated utilising the temporal resolution provided by powders falling, using relatively low-cost apparatus at room temperature and pressure.
Existing techniques for analysis of powder traces from Faraday cups predominantly consist of taking the net difference before and after the charged granular material enters the cup, or by using the range of values acquired.18,37 Here “trace” refers to the variation of a derived quantity, primarily specific charge in this work, over time. (The quantity measured is voltage, which is linearly related to charge via the instrument capacitance, discussed in Section 2). In some cases, the maximum may be assumed to be an asymptotic value when the smaller particles remain dispersed in the air as aerosol and may take far longer to deposit, if at all.1 These measurements of net charge are quick and easy and can be carried out with individual particles or larger assemblies, however, the shape of the trace contains more information on the granular charging than has typically been extracted previously.1,19
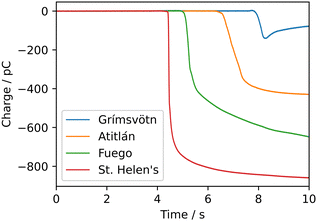
Simply using the net charge yields a single value that, in many cases, is taken to indicate the relative extent of triboelectric charging, its polarity, or both. However, in cases where particle–particle charging is being investigated, this charge could be due to either contact with the container or from a pre-existing charge distribution that could have been generated by handling (for example, loading the sample into the measurement apparatus). Some works aim to study particle–particle charging in isolation by minimising particle–wall charging by reducing contact with container walls, which may be grounded, employing fluidized beds, or by using a “fountain-like” flow in a low-pressure environment.1,38,39 Powders can be exposed to positive and negative ions to neutralise some pre-existing charge.40,41 However, it is very difficult to entirely negate the effects of pre-existing charges and particle–wall contacts under most conditions. For instance, a granular sample with an initially positive trace from particle–particle charging and a negative charge from loading could yield a net result similar to or less than a case with less particle–particle charging but the same polarity as the non-particle–particle charge. A few example traces from samples of volcanic ash that will be used later in this work can be seen in Fig. 3 to demonstrate some of the different shaped traces that can be obtained. The goal of this paper is to develop a more sophisticated approach that feeds the entire Faraday cup trace into a model that predicts the extent of particle–particle charging separated from the other sources of charge, exploiting information stored in the overall shape of the trace. The aim is not to simulate the triboelectric charging of a specific case in detail, but rather to create a general methodology, suitable for a range of applications, using simple yet justified assumptions which can give information on the extent of the measured charge arising from particle–particle interactions.
In this paper, a new modular approach for interpreting the Faraday cup measurements of triboelectrically charged granular material is outlined, applied, and verified. The experimental apparatus is detailed in Section 2 and then illustrated with example traces before specifying the numerical and simulation techniques employed at each step in the interpretation methodology. In Section 3 the approach is initially applied to samples of volcanic ash, and then sieved fractions of ash are used to provide experimental validation for the new interpretation methodology, before investigating the scale-up of the non-particle–particle charging for simplified material. Finally, the work is concluded with a discussion of the limitations and potential application areas in Section 4.
2 Methodology
2.1 Model overview
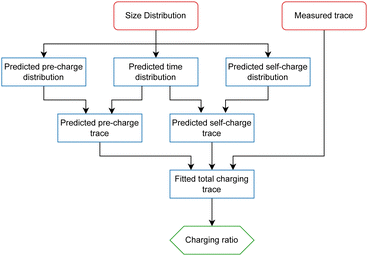
The approach taken in this work utilises the natural separation by size that occurs for granular materials (used here as a term encompassing powders and aerosols) falling under gravity at surface atmospheric pressure. For this modular approach, a size-dependent particle dynamics model for the particles' fall time was required, along with a size distribution of the particles and a prediction for the shape of the charge distribution function. These distributions were then combined to predict the expected shape of the experimental trace. This process was applied to both net-zero charging, where total positive and negative charges balance and is expected to result from particle–particle interactions (referred to in this work as self-charging), and the net-charged component, attributed to non-particle–particle charging (pre-charging). The pre- and self-charging were then added to get the total charge. This total trace was then fitted to the experimentally acquired Faraday cup data by optimising for the relative ratios and polarities of the two types of charging. This procedure overall gives rise to predicted ratios of pre- and self-charging, such that the dependencies of the charge on other factors can be investigated. An overall schematic for this model can be seen in Fig. 1.In the examples used here, two charge distributions are defined, one for the pre-charging and one for the self-charging, each giving rise to an expected contribution to the final Faraday cup trace. However, the principle of this model is easily generalisable to a greater number of charge generation mechanisms. For example, if the expected shape of the size dependencies for pre-charging arriving from different sources were known separately then the same model would, in principle, be able to resolve the relative charging arising from each source.
2.2 Experimental setup
The experimental setup used in this work can be seen in Fig. 2. The basic principle is that granular samples can be loaded into the delivery tubes on top of the rotating turntable. The delivery tubes and turntable are grounded so that samples can be exposed to bipolar ions from an ion gun (Zerostat 3 Milty) and left for a period of time (usually around 20 minutes) to reduce the residual charge,1,40 although in most cases it is still expected to be non-zero. The samples can then be dropped through a wider grounded tube, through two ring probes, before finally landing in the Faraday cup below. The charge transferred to the Faraday cup (ΔQ) is then detected by the electrometer as a voltage (ΔV). The measured voltage is related to the transferred charge and the capacitance (C) of the system by . The capacitance for this setup was previously estimated by Houghton et al. as 130 pF. This was done by measuring current (I) whilst applying a constant voltage change over time
  using the relation
  to calculate the capacitance.1 Overall, this methodology gives rise to traces of charge (or specific charge) over time, as the various charged particles enter the cup, as can be seen in Fig. 3.
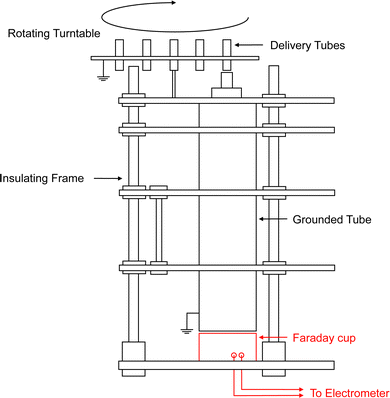 | ||
| Fig. 2 A schematic of the ash charge apparatus for this work, adapted from Houghton et al. with the Faraday cup highlighted in red.1 | ||
The geometry of the tube the particles fall in is not particularly important for this approach, but the key quantity that will be used in Section 2.4 for the particle dynamics model is the drop height, which in this case was 37.25 cm. Any inductive effects before contact with the cup is assumed to be negligible (though they could be included subsequently). The cylindrical delivery tubes had heights of 13 mm and diameters of 7 mm. This means the available volume for a sample was 500 mm3, hence the dropped samples had masses of grams. For each trace, the variation in mass can be adjusted for by dividing by the mass of the sample dropped, yielding the specific mass in each case if required. The Faraday cup was connected through BNC connectors to a Keithley 6514 system electrometer. Short rigid BNC connectors were utilised to minimise noise in the low-level measurements.42 The output of the electrometer was plugged into a USB-6210 Data Acquisition (DAQ) device from National Instruments that was processed using LabVIEW® 2024-Q1 before post-processing with the outlined model. The DAQ was also connected to a DHT11 humidity and temperature sensor via an Arduino Mega 2560 to record the environmental conditions of each drop. The temperature and humidity were not controlled but were recorded for reference at the time of each drop with common values around 24 °C and 40%, respectively. Over a 2 h measuring period typical variations of around 1 °C and 2% relative humidity were observed, which did not significantly affect the measurements.
2.3 Size distribution fitting
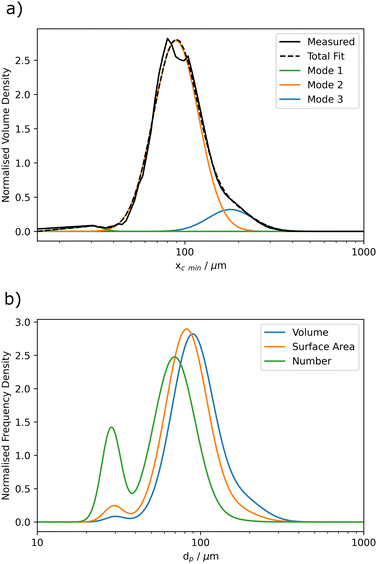
The first step, as outlined in Section 2.1, is to find the size distribution of the particles being modelled. Naturally occurring powders tend to fit log-normally distributed modes.43 Volumetric optical size distributions for the samples were obtained from the CAMSIZER X2® (as can be seen in Fig. 4) and the Malvern Mastersizer 3000®. The data from these were found to fit multi-modal log-normal distributions as would be expected from naturally occurring granular materials.When converted to surface area distributions the smaller modes become more significant and are further amplified in their respective number distributions. This conversion assumes that the particles are spherical and uses the measured optical diameter, even though the aerodynamic diameter is the more relevant factor. Conversions can be made between the two quantities either utilising the particles' shape factor or empirically through measurements. In this case, no conversion was made as the relatively small adjustment (usually around 20%44) would make an insignificant difference to the broad size distributions which span multiple orders of magnitude. The Mastersizer and Camsizer were chosen due to the operating size ranges of 10 nm to 3.5 mm and 0.8 μm to 8 mm, respectively. Multi-modal distributions with the form
 | (1) |
2.4 Particle dynamics model
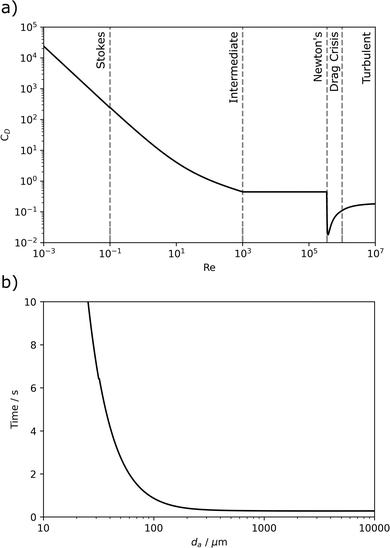
Now that the size distributions have been found, we can look at the particle dynamics model employed to calculate the fall time for each particle to reach the cup. Similarly to Section 2.3, the particles were assumed to be spherical, such that a standard set of equations could be employed and total fall time could be calculated for each particle size. To resolve the forces acting upon each particle, the following set of equations can be employed.For a spherical particle the drag force (FD) exerted on the particle by the surrounding fluid, which is air in this case, can be expressed as
 | (2) |
 for spherical particles), ρf is the density of the fluid, and u is the relative velocity of the particle and the fluid. The drag coefficient is dependent on the Reynolds number (Re) in a non-simplistic way. The Reynolds number is a dimensionless quantity that represents the ratio of inertial to viscous forces and can be expressed as
 | (3) |
 | (4) |
 | (5) |
The only other force that is assumed be acting on the particles is the force due to gravity (Fg), which naturally acts downwards with Fg = mpg, where g is the acceleration due to gravity and the mass of the particles mp is related to their diameter and density (ρp) by  . In this work, ρp was assumed to be constant throughout each sample and was measured using the Anton Paar Ultrapyc 3000® gas pycnometer.
These forces can be resolved and used with Newton's second law to find each particle's acceleration. Each time step the position and velocity of the particles can be updated, recalculating Re, CD, and FD. For numerical stability, the time step must be updated to hold the Courant–Friedrichs–Lewy (CFL) condition at one. The CFL condition is the ratio of the simulation time step to the system's characteristic length scale. In this case, the particle can move roughly its diameter within each time step. At the very beginning, the particles start stationary, meaning the CFL condition number would be zero so a minimum time step of 0.1 ms is also implemented. Overall, this allows for the total time for each particle size to reach the cup to be determined, with the results shown in Fig. 5b. The aerodynamic diameter here is equated to the geometric diameter, as a spherical approximation is made, although empirical measurements could be made to account for this discrepancy.
Only particles that land within the final trace time need to be calculated, as the rest will not land and hence be shown on the trace. In the case of Fig. 5b, only particles larger than 20 μm contribute to the predicted trace; however, for longer traces or higher densities, smaller particles are also included in the calculations. Additionally, as particles approach and pass below 10 μm in size they would begin to behave diffusively and deposit on the container walls or remain dispersed in the air rather than impacting the Faraday cup.49
2.5 Charge frequency density
The next step of the modular approach requires a prediction of the separate charge contributions' dependency upon particle size. In the majority of this work the simplest cases for both the pre- and self-charging were chosen. For the pre-charging that is imparted from the loading and contact with walls, the simplest case is to assume this charging is uni-polar and is proportional to the surface area of each particle. As the particles' aerodynamic diameter is used in this model the surface area is then assumed to scale with dp2. Validation for this scaling is provided by Section 3.3. Critically, only the shape of the distribution is assumed, so when the fitting takes place the fitted parameters may predict that the particles may be pre-charging positively or negatively and the magnitude may vary.A slightly more involved approach is required for the self-charging (particle–particle interactions). In this work, an event-driven molecular dynamics (EDMD) hard-sphere approach was adopted, which reduces computational expense. Due to the unknown nature of tribocharging,32 this work does not assume the nature of the charge carrier. Therefore, a complex charge transfer mechanism, such as electron tunnelling, as employed by Kok et al. cannot be used.50 Instead, the simple case of transferring a single charge from a high-energy to a low-energy state is assumed. This can be thought of as negative (e.g. an electron) initially, although again when the fitting takes place only the shape is important and the polarity may be flipped, such that the charge carrier could be of either polarity. As the charge carriers are not known, this approach seems more robust than arbitrarily assuming one sign.
In this EDMD model, distributions of 300 particles were used, as a trade-off between accuracy and computational cost, matching the size distribution described in Section 2.3. These particles were then randomly placed in a box such that their density was held constant, at a packing fraction of 0.1, by calculating the required box length for each volume of particles. A packing fraction of 0.1 is large enough to prevent particles from being trapped locally, yet small enough to avoid excessive interactions with the walls, which would reduce computational efficiency. This value is also consistent with the range used in previous studies.50–52 If particles overlapped then one of the overlapping particles was replaced elsewhere in the box until there were no overlaps present. The time until a particle–particle collision event (tcol) between each pair of particles, such as i and j, can be calculated from the initial distance rij = rj(t) − ri(t) and velocity vij = vj(t) − vi(t) vectors by
 | (6) |
After an elastic collision, the change in the particles' velocity was calculated using the particles' respective masses (mi and mj), their velocities and their unit vector of separation ![[r with combining circumflex]](https://www.rsc.org/images/entities/b_i_char_0072_0302.gif) ij. By first calculating the effective mass meff and impact speed vimp,
ij. By first calculating the effective mass meff and impact speed vimp,
 | (7) |
| J = (1 + ε)meffvimp, | (8) |
 | (9) |
A hard wall treatment was used in this case for simplicity, meaning if a particle collided with a wall its velocity vector in the direction of the wall would be inverted, although a periodic boundary condition could also be used.53
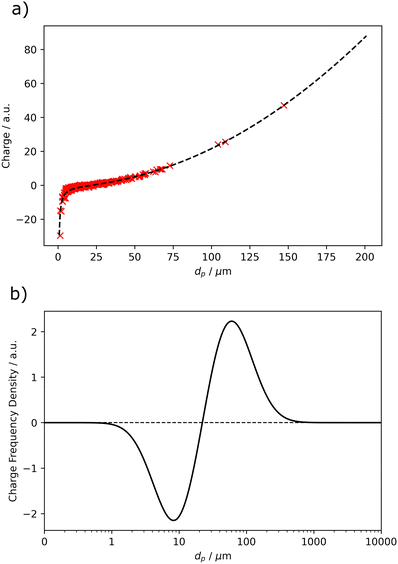
Initially, these particles were assigned random velocities before being allowed to equilibrate for a few thousand steps, such that they could reach a thermodynamic equilibrium (defined as their kinetic energies fitting a Maxwell–Boltzmann distribution) before the charge transfer mechanism was turned on. The final arbitrary charges were then fit to a polynomial of the form f(dp) = adbp + cddp + e, where dp is the particle diameter and a, b, c, d, and e are fitting parameters, such that a > 0 and c < 0. For the positive term it was found that b was usually around 2 as at large diameters the surface area (∝ dp2) dominates the fitting. For the negative term d was usually around −1, which is close to what may be expected from the increased collisions of smaller particles due to their greater velocity at the same kinetic energy  but slightly offset by the smaller collision diameter reducing the effective collision cross-section. The fit with constraints b = 2, d = − 1, and e = 0 shows very good agreement with the data, giving an R2 value of 0.996 in Fig. 6a. Overall, this fit is in line with expectations where the small particles are negatively charged and large particles are positively charged for a negative charge carrier, such as an electron.32,54
As the size distribution is represented as frequency density and the charge distribution shape is known as a function of size, the two can be multiplied to give a charge frequency density distribution, demonstrated in Fig. 6b. The calculated charge frequency density represents the total relative amount of charge expected over all particles of a given diameter. In the case of Fig. 6b, at around 20 μm there would be a net-zero charge on the particles arising from particle–particle interactions. Particles any smaller than this would be predicted negative (if the charge carrier is negative) and any bigger would be predicted positive. This distribution is useful in this work as integration between size limits will give the net charge predicted for that specific size range. For self-charging, there should naturally be no net charge across the whole distribution due to the conservation of charge, meaning the total integral of the charge frequency density distribution should be zero. In reality, the distributions integrate to near zero but not exactly due to the discretisation of the particle sizes used in the EDMD simulation. If an infinite number of particles were used the integral of the arising charge frequency density distributions of self-charging should limit to zero. In the case of Mount St. Helen's, the total integration deviates from zero by 2.2% as a fraction of the functions' total variation. This process was then repeated for expected charge distribution arising from pre-charging sources (Q ∝ dp2) to obtain the respective pre-charging frequency density distribution.
2.6 Overall trace and fit
Finally, the charge frequency densities from Section 2.5 can be combined with the drop time function from Section 2.4 to get the overall charge trace expected over time. This is done by checking, at each time step, which particles are predicted to have landed and integrating the charge frequency density from infinity to that point. These total charging traces were then fit to the experimentally obtained charging traces, similarly to those laid out in Section 2.3, minimising the R2 values of the fits by solving for the ratios between the pre- and self-charging with a Nelder–Mead algorithm utilising the scipy.optimize.minimize package for Python 3.12.2. To quantify the pre- to self-charging ratio, the total integral of both charge frequency density distributions was taken and then multiplied by the relative amount of pre- to self-charging required for the predicted trace fitted. In these fits, the start time of the trace is found, and then the traces are fit with two degrees of freedom: one for the pre- to self-charging ratio and another for scaling the magnitude of charging.The methodology outlined here assumes that the pre- and self-charged populations do not interact, simply because the nature of an interaction is not well understood. However, due to its modular nature, our model is flexible enough to allow for such interactions in future.
3 Results and discussion
3.1 Volcanic ash
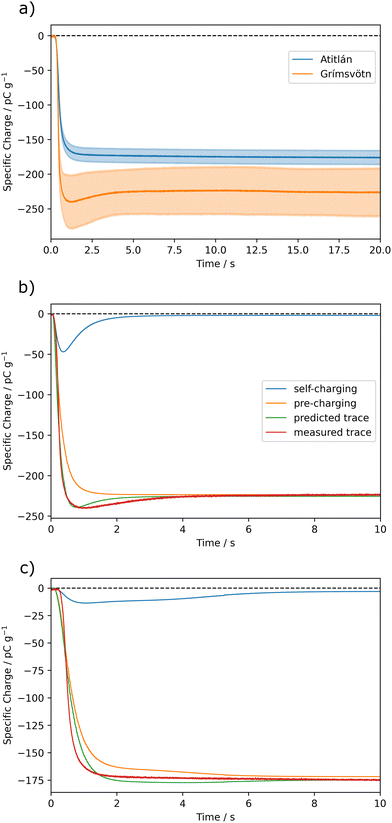
Now that we have a method to separate the charging contributions, the powder charging for various application cases can be investigated. Volcanic ash was used due to the availability of suitable samples, and the role of near-vent triboelectrification in volcanic lightning.5 The previously outlined methodology was followed, taking measured traces and size distributions of volcanic ash samples, to produce fitted charging components as seen in Fig. 7.For each ash sample, the smallest particle fraction (dp < 63 μm) was removed. This is because the smallest particles are harder to model, due to some falling in the diffuse regime so will stick to walls and form agglomerates. The charge on some samples, such as Grímsvötn ash, appeared to decay after being dropped due to the conductivity of air. This can be accounted for by calculating the expected decay at each time step from the equation ΔQ = Q0(1 − e−t/τ), where the change in charge (ΔQ) after a time step (t) is found using the charge before the decay (Q0) and the time constant of air (τ).55 ΔQ can be subtracted from the measured trace to get the trace without decay. The conductivity of air in the lab has previously been measured as 2.85 × 10⁻¹⁴ S m−1, yielding a time constant of 310.5 s.2 This charge decay in air is only observed in certain materials, possibly due to the particles' electrical conductivity or surface chemistry playing a role in the decay of the static charge. For the fits seen in Fig. 7 the R2 value is minimised, prioritising the immediate drop where there is more deviation from the fit. However, a minimisation of the total residuals, which prioritises fitting the later tail of the trace can also help indicate the extent of pre- and self-charging.
From the charge trace fits, we can now determine the extent of self- and pre-charging contributions. One approach to assigning an overall value to the ratio of these components' relative contributions is to take the ratio of the integrals of the respective absolute size frequency density distributions. For Grímsvötn ash the ratio of pre-![[thin space (1/6-em)]](https://www.rsc.org/images/entities/char_2009.gif) :
:![[thin space (1/6-em)]](https://www.rsc.org/images/entities/char_2009.gif) self-charging is 2.7
self-charging is 2.7![[thin space (1/6-em)]](https://www.rsc.org/images/entities/char_2009.gif) :
:![[thin space (1/6-em)]](https://www.rsc.org/images/entities/char_2009.gif) 1, indicating the two types of charging have initially the same polarity with 27% of the charging originating from particle–particle interactions. For Atitlán, this pre-charging only makes up 7% of the total charging. Overall, the greater self-charging indicates that the ash from Grímsvötn is expected to charge more from particle–particle interactions in a less-bounded system such as a volcanic vent. However, the total charging (including pre-charging) is still significant in some cases as it may give information on the saturation charge of the sample. The larger degree of self-charging for Grímsvötn ash is not inconsistent with observations of many registered lightning events per day upon eruption of the Grímsvötn volcano.56 However, it is hard to make a direct comparison between laboratory charging investigations and observed lightning events due to the many other variables and charging mechanisms involved, such as fractoelectrification and “dirty thunderstorms”.5,57
1, indicating the two types of charging have initially the same polarity with 27% of the charging originating from particle–particle interactions. For Atitlán, this pre-charging only makes up 7% of the total charging. Overall, the greater self-charging indicates that the ash from Grímsvötn is expected to charge more from particle–particle interactions in a less-bounded system such as a volcanic vent. However, the total charging (including pre-charging) is still significant in some cases as it may give information on the saturation charge of the sample. The larger degree of self-charging for Grímsvötn ash is not inconsistent with observations of many registered lightning events per day upon eruption of the Grímsvötn volcano.56 However, it is hard to make a direct comparison between laboratory charging investigations and observed lightning events due to the many other variables and charging mechanisms involved, such as fractoelectrification and “dirty thunderstorms”.5,57
3.2 Validation case
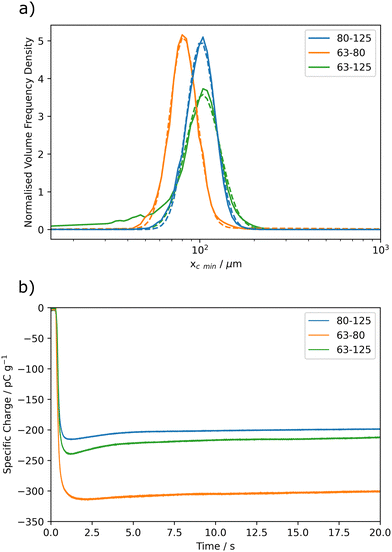
To validate the new Faraday cup modular analysis approach a case with an expected outcome has to be chosen to test the preliminary results against. One expected outcome is that broader size distributions would be expected to exhibit more self-charging due to the greater asymmetry between particle sizes, of otherwise similar particles. Comparable amounts of pre-charging and self-charging would also be preferable to show greater variation in charging ratios between the different samples. For this purpose, sieved fractions of Grímsvötn ash with differing breadths of size distribution were sieved and analysed. The size distributions of the sieved fractions and their Faraday cup traces can be seen in Fig. 8.By applying the modular analysis approach for the broad sieving fraction (63 < dp < 125 μm) of Grímsvötn ash, as seen in Fig. 8c, the pre![[thin space (1/6-em)]](https://www.rsc.org/images/entities/char_2009.gif) :
:![[thin space (1/6-em)]](https://www.rsc.org/images/entities/char_2009.gif) self-charging ratio was found to be 2.4
self-charging ratio was found to be 2.4![[thin space (1/6-em)]](https://www.rsc.org/images/entities/char_2009.gif) :
:![[thin space (1/6-em)]](https://www.rsc.org/images/entities/char_2009.gif) 1. This indicates that nearly a third of the charging originated from self-charging. For the slightly narrower fraction (80 < dp < 125 μm) the ratio was 2.9
1. This indicates that nearly a third of the charging originated from self-charging. For the slightly narrower fraction (80 < dp < 125 μm) the ratio was 2.9![[thin space (1/6-em)]](https://www.rsc.org/images/entities/char_2009.gif) :
:![[thin space (1/6-em)]](https://www.rsc.org/images/entities/char_2009.gif) 1 indicating around a quarter of the charging was from self-charging. This trend continued to the much narrower fraction of (80 < dp < 125 μm) with a ratio of 1
1 indicating around a quarter of the charging was from self-charging. This trend continued to the much narrower fraction of (80 < dp < 125 μm) with a ratio of 1![[thin space (1/6-em)]](https://www.rsc.org/images/entities/char_2009.gif) :
:![[thin space (1/6-em)]](https://www.rsc.org/images/entities/char_2009.gif) 4.8 indicating only around a sixth of the charging is arising from self-charging. The analysis demonstrates that the broader size fractions show both a greater proportion and magnitude of their electrification arising from particle–particle interactions. This is expected based on the increased asymmetry in particle size, providing evidence for the validity of the new analysis.
4.8 indicating only around a sixth of the charging is arising from self-charging. The analysis demonstrates that the broader size fractions show both a greater proportion and magnitude of their electrification arising from particle–particle interactions. This is expected based on the increased asymmetry in particle size, providing evidence for the validity of the new analysis.
3.3 Size dependence of pre-charging
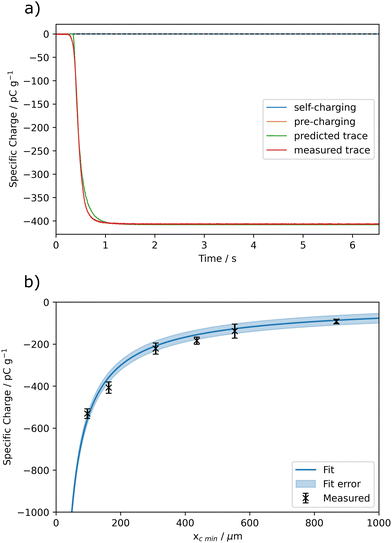
Utilising the charging interpretation methodology outlined in the previous section, different charging components can now be investigated in isolation. The size dependence of these charging processes is of great importance to both natural and industrial applications, for example with regards to ignition risks of chemical processes which may be carried out over a variety of operational scales and particle sizes. To begin with, powdered samples of labradorite, which were prepared in-house and are therefore more repeatable than the ash samples, were chosen to investigate the scaling of pre-charging – it was found to charge with almost exclusively pre-charging in this setup, as can be seen in Fig. 9a. Labradorite is expected to tribocharge similarly to volcanic ash as X-ray diffraction (XRD) analysis found a reasonable match between labradorite and ash from Volcán de Fuego.58 Samples were sieved to change their size distributions and then dropped to get their charging traces.The measured labradorite self-charging was found to fit a power-law function as shown in Fig. 9b with an R2 value of 0.98, with a power of −0.85 ± 0.03. This is likely due to the increased contact area between the particles and the container walls or any other handling apparatus. To approximate this effect we could assume the container walls are effectively flat and the particles are mono-disperse spheres of radius r. Then the approximate amount of each particle's surface area that is within a distance (L) of the surface is 2πrL. If the spheres are close packing hexagonally in 2D against an area of the flat surface, then the packing fraction is constant at  giving
  particles per area of the flat surface (A). Therefore, the total effective area (Aeff) can be approximated by:
 | (10) |
This trend explains why the smallest size fraction in Section 3.2 displayed the greatest overall magnitude of charging despite having a smaller self-charging component than the broader size fraction. More investigation is needed to include other variables such as accounting for differently shaped particles to probe the relation to contact area and the dependence of the self-charging on average particle size.
4 Conclusions
This work has developed a novel modular approach to understanding the triboelectric charging contributions from different sources in the analysis of Faraday cup measurements of insulating granular material. This allowed for the comparison of ash from the Grímsvötn and Atitlán volcanoes, which found that 27% of the charging for Grímsvötn ash came from particle–particle interactions but only 7% for Atitlán. Analysis of sieved Grímsvötn ash validated the modular approach as broader size fractions were found to show a greater proportion and magnitude of particle–particle charging, as would be expected from the increased particle asymmetry. Our findings suggest that in cases where some samples may have appeared to charge more than others in previous analyses, the observed charging may have been primarily due to pre-charging. As a result, these samples may exhibit reduced charging in unbounded systems such as volcanic plumes or dust devils. Conversely, samples that exhibit more self-charging, rather than pre-charging, are likely to exhibit a greater degree of charge build-up in such environments. Finally, for simplified samples of powdered labradorite the pre-charging was found to have an inverse relation with average particle size, indicating the contact area is significant in this charging contribution. Future work could investigate the scale-up of self-charging triboelectrification and the dependency of particle shape on the charging behaviour.The outlined approach is broadly generalisable to any insulating granular material, although the experimental setup outlined in this work operates best for materials with average particle diameters (dp) in the range 20 μm < dp < 200 μm (for particles with a density of around 1.5 to 3.0 g cm−3). This operating range could be altered by utilising a different drop height, whereby a taller experimental setup would allow for particles of greater diameter or lower density to be distinguished. The modular nature of the approach also allows for fine-tuning to each application case. Overall, this novel interpretation methodology will allow for greater insights into the granular triboelectric charging behaviour for a host of natural and industrial applications.
Author contributions
Tom O'Hara: conceptualisation, methodology, software, formal analysis, validation, data curation, writing – original draft, writing – review and editing, project administration. David Reid: software, writing – review and editing. Gregory Marsden: investigation, writing – review and editing. Karen Aplin: supervision, resources, writing – review and editing, funding acquisition.Data availability
All the data for this article, including Faraday cup traces, size distributions, simulation outputs, and density measurements are available through the Materials Data Facility.58 The full code for the EDMD simulation and data processing are available under a GPL-3.0 license.59,60Conflicts of interest
There are no conflicts to declare.Acknowledgements
The authors acknowledge funding from the Engineering and Physical Sciences Research Council through the Centre for Doctoral Training in Aerosol Science (no. EP/S023593/1) and UK Space Agency Aurora program (no. ST/W002485/1). We extend our thanks to Rowan Dejardin from the School of Geographical Sciences and Hayley Goodes from the School of Earth Sciences (University of Bristol) for their assistance with access to equipment. We would also like to thank þorður Arason and Kristín Hermannsðóttir (Icelandic Meteorological Office) as well as Matthew Watson and Alec Bennett (University of Bristol) for providing the volcanic ash samples used.Notes and references
- I. M. P. Houghton, K. L. Aplin and K. A. Nicoll, Phys. Rev. Lett., 2013, 111, 118501 CrossRef PubMed.
- D. P. Reid and K. L. Aplin, J. Phys.: Conf. Ser., 2024, 2702, 012020 CrossRef.
- R. G. Harrison, K. L. Aplin, F. Leblanc and Y. Yair, Space Sci. Rev., 2008, 137, 5–10 CrossRef.
- L. Rayborn and A. M. Jellinek, J. Geophys. Res.: Solid Earth, 2022, 127, e2021JB023599 CrossRef.
- C. Cimarelli, S. Behnke, K. Genareau, J. M. Harper and A. R. Van Eaton, Bull. Volcanol., 2022, 84, 78 CrossRef PubMed.
- NFPA, Recommended Practice on Static Electricity, NFPA, 2019 Search PubMed.
- M. Beretta, T. Hörmann, P. Hainz, W. Hsiao and A. Paudel, Int. J. Pharm., 2020, 591, 120015 CrossRef CAS PubMed.
- D. J. Lacks and T. Shinbrot, Nat. Rev. Chem., 2019, 3, 465–476 CrossRef CAS.
- S. D. Cezan, A. A. Nalbant, M. Buyuktemiz, Y. Dede, H. T. Baytekin and B. Baytekin, Nat. Commun., 2019, 10, 276 CrossRef PubMed.
- J. C. Wilcke, Dispvtatio Physica Experimentalis, De Electricitatibvs Contrariis: Qvam Consentiente… In Academia Rostochiensi, Ad D. XIII. Octobr. A. MDCCLVII…. Dissertation, 1757.
- W. Xu and H. Grosshans, J. Loss Prev. Process Ind., 2023, 81, 104970 CrossRef CAS.
- L. J. Jallo and R. N. Dave, J. Pharm. Sci., 2015, 104, 2225–2232 CrossRef CAS PubMed.
- K. W. Biegaj, M. G. Rowland, T. M. Lukas and J. Y. Y. Heng, ACS Omega, 2017, 2, 1576–1582 CrossRef CAS PubMed.
- R. D. Cruise, K. Hadler, S. O. Starr and J. J. Cilliers, J. Phys. D: Appl. Phys., 2022, 55, 185306 CrossRef CAS.
- J. Peart, KONA Powder Part. J., 2001, 19, 34–45 CrossRef CAS.
- R. D. Cruise, S. O. Starr, K. Hadler and J. J. Cilliers, Sci. Rep., 2023, 13, 15178 CrossRef CAS PubMed.
- S. R. Waitukaitis, V. Lee, J. M. Pierson, S. L. Forman and H. M. Jaeger, Phys. Rev. Lett., 2014, 112, 218001 CrossRef.
- H. Zhao, G. Castle and I. Inculet, J. Electrost., 2002, 55, 261–278 CrossRef.
- L. H. Yeo, X. Wang, A. Dove and M. Horányi, Adv. Space Res., 2023, 72, 1861–1869 CrossRef.
- A. Thomas, K. Saleh, P. Guigon and C. Czechowski, J. Phys.: Conf. Ser., 2008, 142, 012031 CrossRef.
- J. C. Maxwell, Landmark Writings in Western Mathematics, 1873, 2, 3408–3425 Search PubMed.
- D. Kucerovsky and Z. Kucerovsky, J. Phys. D: Appl. Phys., 2003, 36, 2407–2416 CrossRef CAS.
- C. E. Sosolik, A. C. Lavery, E. B. Dahl and B. H. Cooper, Rev. Sci. Instrum., 2000, 71, 3326–3330 CrossRef CAS.
- K. Sunil, R. Shukla and A. Sharma, Plasma Sci. Technol., 2023, 045402 Search PubMed.
- J. Méndez Harper, D. Harvey, T. Huang, J. McGrath, D. Meer and J. C. Burton, PNAS Nexus, 2022, 1, pgac220 CrossRef PubMed.
- J. Haeberle, A. Schella, M. Sperl, M. Schröter and P. Born, Soft Matter, 2018, 14, 4987–4995 RSC.
- S. Matsusaka, M. Ghadiri and H. Masuda, J. Phys. D: Appl. Phys., 2000, 33, 2311 CrossRef CAS.
- M. Kaponig, A. Mölleken, H. Nienhaus and R. Möller, Sci. Adv., 2021, 7, eabg7595 CrossRef PubMed.
- G. Grosjean and S. Waitukaitis, Phys. Rev. Lett., 2023, 130, 098202 CrossRef CAS PubMed.
- F. Chowdhury, M. Ray, A. Passalacqua, P. Mehrani and A. Sowinski, Powder Technol., 2021, 381, 352–365 CrossRef CAS.
- D. Carter and C. Hartzell, J. Electrost., 2020, 107, 103475 CrossRef CAS.
- J. R. Toth, A. K. Phillips, S. Rajupet, R. M. Sankaran and D. J. Lacks, Ind. Eng. Chem. Res., 2017, 56, 9839–9845 CrossRef CAS.
- R. Zhao, Z. Zhang, X. Bai, H. Wang, H. Zhang, J. Hao and C. Wang, Miner. Eng., 2024, 216, 108901 CrossRef CAS.
- J. Méndez Harper, C. S. McDonald, E. J. Rheingold, L. C. Wehn, R. E. Bumbaugh, E. J. Cope, L. E. Lindberg, J. Pham, Y.-H. Kim, J. Dufek and C. H. Hendon, Matter, 2023, 266–283 Search PubMed.
- S. R. Waitukaitis and H. M. Jaeger, Rev. Sci. Instrum., 2013, 84, 025104 CrossRef CAS PubMed.
- W. Xu, S. Jantač, T. Matsuyama and H. Grosshans, Exp. Fluids, 2024, 65, 54 CrossRef.
- N. Preudhomme, J. Schockmel, E. Opsomer and G. Lumay, Soft Matter, 2024, 20, 9060–9067 RSC.
- P. Mehrani, H. T. Bi and J. R. Grace, J. Electrost., 2005, 63, 165–173 CrossRef CAS.
- K. M. Forward, D. J. Lacks and R. Mohan Sankaran, J. Electrost., 2009, 67, 178–183 CrossRef CAS.
- X. Zhang, C. K. Ao and S. Soh, ACS Appl. Mater. Interfaces, 2020, 12, 5274–5285 CrossRef CAS PubMed.
- K. Daioui, M. Rezoug, A. Bendaoud, K. Medles and L. Dascalescu, IEEE Trans. Dielectr. Electr. Insul., 2018, 25, 441–447 CAS.
- J. F. Keithley, Low Level Measurements. Precision DC Current, Voltage and Resistance Measurements, Keithley Instruments, 1998 Search PubMed.
- K. T. Whitby, Sulfur in the Atmosphere, Elsevier, 1978, pp. 135–159 Search PubMed.
- W. Chen and D. W. Fryrear, J. Sediment. Res., 2001, 71, 365–371 CrossRef.
- J. Watson, J. Chow, L.-W. A. Chen and X. Wang, Measurement system evaluation for fugitive dust emissions detection and quantification, Desert Research Institute, 2010 Search PubMed.
- R. H. Perry and D. W. Green, Perry's chemical engineers' handbook, McGraw-Hill Professional, New York, 8th edn, 2008 Search PubMed.
- R. Balevičius and P. Miškinis, Mokslas – Lietuvos ateitis, 2020, 12, 1–4 CrossRef.
- M. Venczel, G. Bognár and A. Veress, Processes, 2021, 9, 331 CrossRef CAS.
- L. S. Ruzer and N. H. Harley, Aerosols Handbook: Measurement, Dosimetry, and Health Effects, CRC Press, 2nd edn, 2012 Search PubMed.
- J. F. Kok and D. J. Lacks, Phys. Rev. E: Stat., Nonlinear, Soft Matter Phys., 2009, 79, 051304 CrossRef PubMed.
- N. Duff and D. J. Lacks, J. Electrost., 2008, 66, 51–57 CrossRef.
- D. J. Lacks, N. Duff and S. K. Kumar, Phys. Rev. Lett., 2008, 100, 188305 CrossRef PubMed.
- F. Smallenburg, Eur. Phys. J. E: Soft Matter Biol. Phys., 2022, 45, 22 CrossRef CAS PubMed.
- D. J. Lacks and A. Levandovsky, J. Electrost., 2007, 65, 107–112 CrossRef CAS.
- J. A. Chalmers, Atmospheric Electricity, Pergamon Press, Oxford, 2nd edn, 1967 Search PubMed.
- P. Arason, A. J. Bennett and L. E. Burgin, J. Geophys. Res.: Solid Earth, 2011, 116, 1–15 Search PubMed.
- S. R. McNutt and E. R. Williams, Bull. Volcanol., 2010, 72, 1153–1167 CrossRef.
- T. F. O’Hara, G. Marsden, D. P. Reid and K. L. Aplin, Faraday Cup Measurements of Triboelectrically Charged Granular Material: A Modular Interpretation Methodology, Materials Data Facility, 2024 DOI:10.18126/N3DX-DH16.
- T. O'Hara, vb22224/Drop_Modelling_and_Fitting: Faraday Cup Modelling and Fitting, 2024, https://zenodo.org/doi/10.5281/zenodo.13774132 Search PubMed.
- T. O'Hara and D. Reid, vb22224/Simplified_EDMD_Triboelectric _Model: Simplified EDMD Triboelectric Models, 2024, https://zenodo.org/doi/10.5281/zenodo.13774615 Search PubMed.
| This journal is © The Royal Society of Chemistry 2025 |

