 Open Access Article
Role of SiO2 in enhancing CO yield by using silica-supported La0.5Ba0.5FeO3 in reverse water–gas shift chemical looping†
Hanzhong
Shi
,
Jiawei
Guo
,
Prabhsimran
Singh
,
Venkat R.
Bhethanabotla
 * and
John N.
Kuhn
 *
*
Department of Chemical, Biological, and Materials Engineering, University of South Florida, 4202 E. Fowler Ave., ENG030, Tampa, Florida 33620, USA. E-mail: bhethana@usf.edu; jnkuhn@usf.edu
First published on 4th December 2024
Abstract
Perovskite oxides, such as La0.5Ba0.5FeO3 (LBF), facilitate CO2 conversion by reverse water–gas shift chemical looping (RWSG-CL) at moderate conditions by employing an oxygen vacancy at the surface to aid CO2 adsorption and then to scavenge an oxygen atom from it to fill the vacancy. The formation of composites with silica is also known to enhance the perovskite oxide's performance. To better clarify this, experimental and computational methods are now combined to probe CO2 adsorption for both unsupported and silica-supported LBF. Chemisorption tests showed the CO2 adsorption sites increased from 12.4 to 60.6 μmol gLBF−1 after adding SiO2 (75 wt%) to LBF (25 wt%). Spectroscopic studies (DRIFTS) indicated that the carbonate formation during CO2 adsorption shifts from bidentate to monodentate because the surface morphology changes upon supporting on silica. Computational (DFT) results provide evidence for CO2 adsorbed as a monodentate and a bidentate carbonate, respectively, on the (111) and (100) surfaces. Monodentate species required lower energy, as determined by DFT, to dissociate C–O bond than bidentate species. Since XRD results identified increases in the (111) relative to (100) planes upon supporting LBF on SiO2, the combined DRIFTS and DFT approach revealed that the perovskite oxide restructures when in composite form, which explains the increased RWGS-CL process yield of CO.
Sustainability spotlightTo deal with the massive CO2 emissions and nearly daily news on climate change, a scalable technology to repurpose this waste to the carbon backbone of fuels and chemicals could revolutionize society. Such routes have been plagued by technical and economic challenges. Our ongoing efforts focus on converting CO2 to CO by chemical looping using a perovskite oxide with green hydrogen as a tandem reactant. The current research investigates the mechanism of efficient conversion, with which we can design better redox materials and processes to propel this technology forward. Our project goals align with the UN sustainable development goals of clean energy (SDG 7), industry innovation (SDG 9), responsible consumption (SDG 12), and SDG 13 (climate action). |
1 Introduction
A potential approach to repurpose CO2 emissions is the conversion of CO2, aided by intermittent renewable energy inputs, into valuable fuels and chemicals. An example of such an alternative pathway involves the conversion of CO2 into CO, followed by the further conversion of CO into high-value chemical products, such as methane and other hydrocarbons with added value.1–4 However, the pivotal step in this process, the conversion of CO2 into CO, presents a significant challenge due to the exceptionally high energy requirement needed to break a C![[double bond, length as m-dash]](https://www.rsc.org/images/entities/char_e001.gif) O bond. This is primarily attributed to the inherent stability of the symmetric CO2 molecule (ΔG = −396 kJ mol−1). To address this energy barrier and reduce the associated energy costs, researchers have explored the utilization of catalytic and non-catalytic reaction processes. A promising process is the reverse water–gas shift chemical looping (RWGS-CL).
O bond. This is primarily attributed to the inherent stability of the symmetric CO2 molecule (ΔG = −396 kJ mol−1). To address this energy barrier and reduce the associated energy costs, researchers have explored the utilization of catalytic and non-catalytic reaction processes. A promising process is the reverse water–gas shift chemical looping (RWGS-CL).
RWGS-CL operates through a two-step reaction process. In the first reduction step (eqn (1.1)) metal oxide materials (MOx) are partially reduced by reacting with hydrogen to form the oxygen vacancy. In the second oxidation step (eqn (1.2)) the oxygen vacancy on reduced; MOx−δ reacts with CO2 to produce CO. Subsequently, the regenerated oxide returns to its original structure.
| MOx + δH2 → MOx−δ + δH2O | (1.1) |
| MOx−δ + δCO2 → MOx + δCO | (1.2) |
Compared to other CO2 conversion reactions which often necessitate extremely high temperatures (generally above 1000 °C) to break the C![[double bond, length as m-dash]](https://www.rsc.org/images/entities/char_e001.gif) O bond,1–4 RWGS-CL offers an alternative energy requirement by utilizing perovskite oxides as agent materials. In our previous research, we proposed several perovskite oxide materials to operate at a moderate temperature (∼550 °C) of RWGS-CL.5–7 Perovskite oxides (ABO3) are composed of three essential components: an ‘A’ site element, a ‘B’ site element, and three oxygen atoms. Typically, ‘A’ site elements are chosen from Group II or the lanthanides, while ‘B’ site elements are primarily transition metals. The perovskite crystal structure exhibits stability across a wide range of compositions on each site, making it an ideal phase for tuning its properties to introduce oxygen vacancies and enhance its capacity for CO2 adsorption.
O bond,1–4 RWGS-CL offers an alternative energy requirement by utilizing perovskite oxides as agent materials. In our previous research, we proposed several perovskite oxide materials to operate at a moderate temperature (∼550 °C) of RWGS-CL.5–7 Perovskite oxides (ABO3) are composed of three essential components: an ‘A’ site element, a ‘B’ site element, and three oxygen atoms. Typically, ‘A’ site elements are chosen from Group II or the lanthanides, while ‘B’ site elements are primarily transition metals. The perovskite crystal structure exhibits stability across a wide range of compositions on each site, making it an ideal phase for tuning its properties to introduce oxygen vacancies and enhance its capacity for CO2 adsorption.
In our previous research, La0.5Ba0.5FeO3 (LBF) has emerged as a potential candidate for low-temperature RWGS-CL, as it is capable of converting CO2 to CO at 480 °C with a CO yield of 0.2 mmol g−1 LBF.7 To facilitate the industrial-scale use of LBF material, LBF/SiO2 composites were synthesized by adding SiO2 (quartz, 75 wt%) to pure LBF (25 wt%) to enhance LBF dispersion.8,9 Subsequently, the LBF/SiO2 powder was formed into pellets using tableting or extrusion methods. The resulting LBF/SiO2 pellets converted CO2 to CO at 550 °C with a CO yield of approximately 2.2 mmol g−1 LBF with long-term stability in 50-cycle RWGS-CL reaction.10 Notably, the materials' CO yields were increased when compared to unsupported LBF. As summarized in Table 1, the addition of SiO2 enriches the (111) plane of LBF crystals. This is noteworthy as previous studies have shown that the (111) surface of similarly related materials, such as MgO and NiO, exhibits higher adsorption strength compared to the (100) surface.11,12 Therefore, the enriched (111) plane in LBF/SiO2 composites could potentially enhance the RWGS-CL reaction, providing a plausible explanation for the observed increase in CO yield after adding SiO2 as a support material. However, a detailed explanation requires further investigation. In this study, we aim to elucidate the surface mechanism behind this phenomenon by combining experimental and computational methods.
| Reduction temperature (°C) | Oxidation temperature (°C) | H2O yield (mmol gLBF−1) | CO yield (mmol gLBF−1) | Surface area (m2 g−1) | |
|---|---|---|---|---|---|
| LBF | 430 | 480 | 0.2 | 0.2 | 8.9 |
| LBF/SiO2 | 580 | 550 | 2.2 | 2.2 | 3.2 |
The computational method employed in this study is density functional theory (DFT), which has gained popularity for its ability to compute molecular structures, vibrational frequencies, and energies of chemical reactions.13–16 DFT frequency calculations are known to be reliable and less computationally demanding.17,18 Therefore, we have used DFT to calculate the vibrational frequencies of the species adsorbed on LBF and LBF/SiO2 during the RWGS-CL reaction. To validate the DFT frequency results, diffuse reflectance infrared Fourier transform spectroscopy (DRIFTS) was utilized to measure the vibrational frequencies of the same samples.19–21 These in situ DRIFTS experiments combined with DFT calculations were utilized to provide a comprehensive understanding of the vibrational frequencies and adsorption behavior of the species on LBF and LBF/SiO2 materials. Mechanistic insights into factors contributing to the improved performance of the silica-supported LBF is gained from this study.
2 Materials and methods
2.1 Experimental method
![[thin space (1/6-em)]](https://www.rsc.org/images/entities/char_2009.gif) :
:![[thin space (1/6-em)]](https://www.rsc.org/images/entities/char_2009.gif) Ba
Ba![[thin space (1/6-em)]](https://www.rsc.org/images/entities/char_2009.gif) :
:![[thin space (1/6-em)]](https://www.rsc.org/images/entities/char_2009.gif) Fe
Fe![[thin space (1/6-em)]](https://www.rsc.org/images/entities/char_2009.gif) :
:![[thin space (1/6-em)]](https://www.rsc.org/images/entities/char_2009.gif) CA
CA![[thin space (1/6-em)]](https://www.rsc.org/images/entities/char_2009.gif) :
:![[thin space (1/6-em)]](https://www.rsc.org/images/entities/char_2009.gif) EG = 0.5
EG = 0.5![[thin space (1/6-em)]](https://www.rsc.org/images/entities/char_2009.gif) :
:![[thin space (1/6-em)]](https://www.rsc.org/images/entities/char_2009.gif) 0.5
0.5![[thin space (1/6-em)]](https://www.rsc.org/images/entities/char_2009.gif) :
:![[thin space (1/6-em)]](https://www.rsc.org/images/entities/char_2009.gif) 1
1![[thin space (1/6-em)]](https://www.rsc.org/images/entities/char_2009.gif) :
:![[thin space (1/6-em)]](https://www.rsc.org/images/entities/char_2009.gif) 10
10![[thin space (1/6-em)]](https://www.rsc.org/images/entities/char_2009.gif) :
:![[thin space (1/6-em)]](https://www.rsc.org/images/entities/char_2009.gif) 40), and SiO2 was added at the mass ratio of LBF/SiO2 25 wt% (LBF
40), and SiO2 was added at the mass ratio of LBF/SiO2 25 wt% (LBF![[thin space (1/6-em)]](https://www.rsc.org/images/entities/char_2009.gif) :
:![[thin space (1/6-em)]](https://www.rsc.org/images/entities/char_2009.gif) SiO2 = 1
SiO2 = 1![[thin space (1/6-em)]](https://www.rsc.org/images/entities/char_2009.gif) :
:![[thin space (1/6-em)]](https://www.rsc.org/images/entities/char_2009.gif) 3). The LBF sample was synthesized by the same method, but without adding SiO2 after forming the gel. Other experiments are described in ESI.†
3). The LBF sample was synthesized by the same method, but without adding SiO2 after forming the gel. Other experiments are described in ESI.†
Although both DFT and DRIFTS analyses in this study were conducted at temperatures lower than those used in the actual RWGS-CL reaction. The surface properties of the materials remain relatively stable as the temperature increases from room temperature to reaction temperature, given that both the perovskite and SiO2 are stable materials which are synthesized at a temperature much higher than reaction temperature. Therefore, it is reasonable to assume that the nature of the surface sites and the form of CO2 adsorption remain consistent across the different temperatures.23,24
2.2 Computational methods
The DFT calculations in this study were performed using Quantum ESPRESSO software (Version 6.2.1).25,26 The materials models used in the calculations are referenced from the materials project database, with corresponding index numbers.27 The plane wave basis set and gradient generalization approximation for electron densities were used.28,29 The projector augmented wave (PAW) potentials and Perdew–Burke–Ernzerhof (PBE) variant of exchange-correlation functional were employed.30,31 In this study, the energy convergence criterion was set to 10−6 eV per atom, and the force convergence criterion was set to 0.005 eV Å−1. A constant cutoff of 40 Ry (544 eV) was selected. A k-point mesh of (4 × 4 × 1) was used for the Brillouin zone sampling. The Hubbard U correction was not applied in this calculation, as the trend of energies did not show a significant shift with or without the application of the Hubbard U correction.32,33 The vibrational frequency was calculated from a 6 × 6 Hessian matrix.34 The details of DFT calculation and other experimental methods are described in ESI.†3 Result and discussion
3.1 Materials characterizations
To better understand the reason for LBF/SiO2 giving larger CO yield than LBF in the RWGS-CL process, XRF, XRD, and XPS experiments were performed on both materials. The metal elemental compositions of the samples were determined by XRF (Fig. 1), showing that LBF has 26.1% La, 26.3% Ba, and 47.6% Fe, while LBF/SiO2 (25 wt%) has 25.7% La, 25.4% Ba, and 48.9% Fe, which are close to the nominal compositions.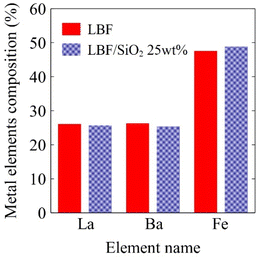 | ||
| Fig. 1 Metal elemental compositions of fresh samples in bulk calculated from XRF results, red solid bar is LBF result, and blue dotted bar is for LBF/SiO2 25 wt%. | ||
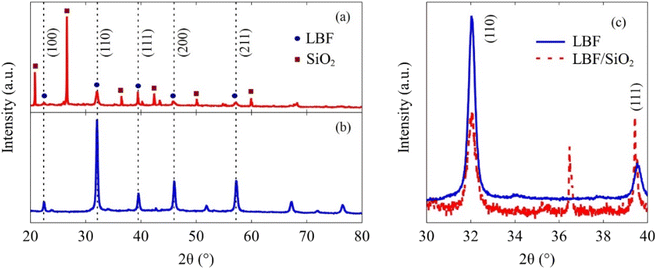
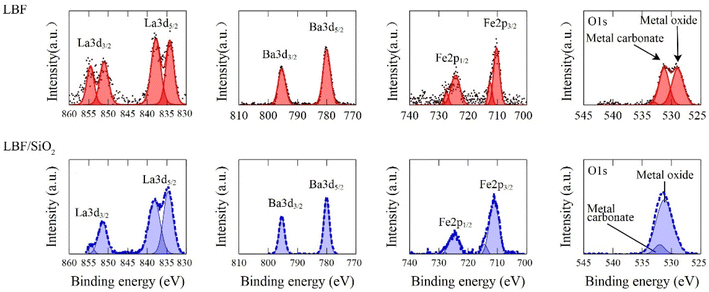
The XRD results (Fig. 2) indicate that LBF/SiO2 structure is enriched with the (111) planes, as evidenced by the intensity ratio of diffraction lines ((111) to (110)) switching from 0.2 to 1, because the relative intensities generally correlate with a greater number of crystallites oriented along a specific plane.35 This switch of crystallographic planes could be because SiO2 influences the preferential growth or orientation of the active catalytic phase.36 As demonstrated in our previous study, SiO2 exhibits a wettability effect on the perovskite particles, potentially leading to the formation of a secondary plane associated with surface wetting.37 Thus, the presence of SiO2 and the synthesis method can stabilize (111) planes more than others (110), leading to an increased intensity in the XRD pattern.38 LBF is used as the control sample for the (100) plane. The surface morphology difference is also observed from XPS results (Fig. 3). After adding SiO2 to LBF, there is a noticeable shift in the difference of La3d5/2 binding energy from 4.1 to 4.0 eV, and a shift in the difference of La3d3/2 binding energy from 3.4 to 3.1 eV. The binding energy differences between two La3d peaks are close between LBF and LBF/SiO2. The binding energy of O1s exhibits a distinct difference due to the presence of oxygen bonds from SiO2. Fe and Ba remain the same. Therefore, by combing the results from XRF, XRD, and XPS, the surface with enriched (111) is a potential reason that led to increase in the CO yield.
3.2 CO2 chemisorption
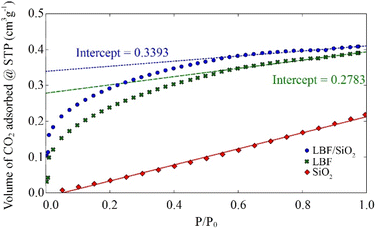
To better understand the CO2 adsorption on LBF and LBF/SiO2, CO2 chemisorption experiments were performed on these two reduced samples at room temperature (Fig. 4). Results indicate a similar volume of CO2 adsorbed by LBF and LBF/SiO2. However, a sample of SiO2 support material was tested to find that SiO2 is inert for CO2 chemisorption, and the concentration of perovskite in LBF (100%) is 4 times than LBF/SiO2 (25 wt%). Therefore, an increased CO2 chemisorption upon supporting in SiO2, increasing from 12.4 μmol gLBF−1 (LBF) to 60.6 μmol gLBF−1 (LBF/SiO2) calculated by extrapolation method (eqn (S3)†).39,40 From these results, we conclude that supporting LBF on SiO2 enhances of the number of CO2 chemisorption sites, by a factor of 5 in this case. This enhancement can be considered as one reason the improved CO yield in the reduction process.3.3 Temperature-programmed oxidation experiments
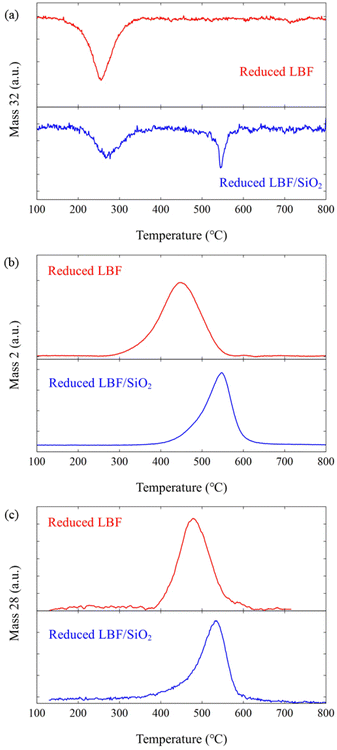
Oxygen vacancies are created during the reduction phase of the RWGS-CL process. The perovskite phase, La0.5Ba0.5FeO3, is reduced to La0.5Ba0.5FeO3−δ, where δ presents oxygen vacancy amount that is 0.1 and 0.5 for LBF and LBF/SiO2. respectively.7,10 The oxidation temperatures for samples of reduced LBF and reduced LBF/SiO2 were examined under various oxidizers (O2, H2O, and CO2) using TPO experiments. Comparing the results from TPO-O2, TPO-H2O, and TPO-CO2 experiments (Fig. 5), it is evident that a lower oxidation temperature of 250 °C is required for O2, which is the strongest oxidizer, compared to H2O and CO2, both of which require temperatures exceeding 400 °C. For the reduced LBF/SiO2, a second oxidation peak appears at 530 °C, indicating a shift in surface morphology due to the addition of SiO2. Interestingly, the oxidation temperatures for H2O and CO2 are similar, deviating from the expectation that H2O, typically a stronger oxidizer than CO2, would oxidize the sample at a lower temperature. This anomaly is attributed to the oxygen vacancies on the perovskite oxide surface, which enhance CO2 adsorption and lower the dissociation energy of CO2 making CO2 a strong oxidant in this reaction Consequently, this reduced energy requirement aligns with the lower temperature range (400 to 650 °C) for the CO2 to CO reaction in the RWGS-CL process, compared to the higher temperatures (>1000 °C) required in conventional thermochemical processes.3.4 DRIFTS–CO2–adsorption
DRIFTS–CO2–adsorption experiments were conducted to reduce the LBF and LBF/SiO2 (25 wt%) samples. The DRIFTS results (Fig. 6) show the vibrational frequencies of the adsorbed species. The experimental vibrational frequencies are νas = 1606 cm−1 and νs = 1347 cm−1 for CO2 adsorbed on reduced LBF, and νas = 1544 cm−1 and νs = 1364 cm−1 for CO2 adsorbed on reduced LBF/SiO2 (25 wt%). The difference between νas and νs decreases from 259 to 180 cm−1. This is because CO2 is adsorbed in the bidentate carbonate form on LBF whereas it is adsorbed in the monodentate carbonate form on LBF/SiO2.41 This carbonate formation differences agree with the DFT calculations presented in the next section.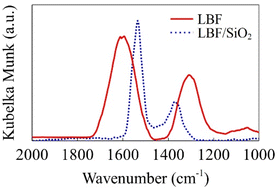 | ||
| Fig. 6 DRIFT spectra of TPD-CO2 experiments. Red solid line is the result for LBF, and blue dotted line is the result for LBF/SiO2 25 wt%. | ||
3.5 DFT calculations
| E Ovac (eV) | Fe surface | La/Ba surface |
|---|---|---|
| LBF-111 | 1.62 | 1.80 |
| LBF-100 | 3.01 | 3.24 |
![[double bond, length as m-dash]](https://www.rsc.org/images/entities/char_e001.gif) O bond distances between carbon and oxygen are presented in Table 3. C
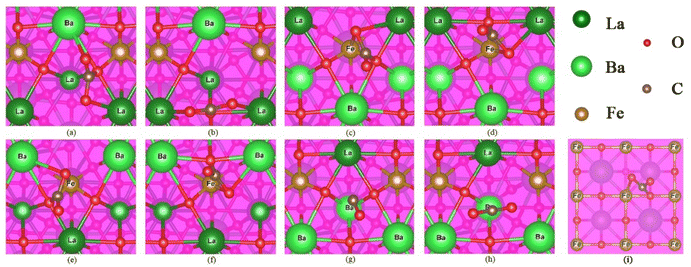
O bond distances between carbon and oxygen are presented in Table 3. C![[double bond, length as m-dash]](https://www.rsc.org/images/entities/char_e001.gif) O bond lengths falling within the range of 1.21 to 1.23 Å indicate the formation of a double bond between carbon and oxygen, while bond lengths of C–Oa and C–Ob (Table 3) in the range of 1.26 to 1.34 Å are considered as C–O single bonds.44 Therefore, the DFT calculations suggest that CO2 adsorption occurs in the carbonate form. In (Fig. 7(g) & (h)), the bond lengths of 1.16 and 1.17 Å for LBF-111(BaLa–Ba) do not follow the same trend, which could be attributed to Ba not being a site for CO2 adsorption.
O bond lengths falling within the range of 1.21 to 1.23 Å indicate the formation of a double bond between carbon and oxygen, while bond lengths of C–Oa and C–Ob (Table 3) in the range of 1.26 to 1.34 Å are considered as C–O single bonds.44 Therefore, the DFT calculations suggest that CO2 adsorption occurs in the carbonate form. In (Fig. 7(g) & (h)), the bond lengths of 1.16 and 1.17 Å for LBF-111(BaLa–Ba) do not follow the same trend, which could be attributed to Ba not being a site for CO2 adsorption.
C![[double bond, length as m-dash]](https://www.rsc.org/images/entities/char_e001.gif) O bond length (Å) O bond length (Å) |
C–Oa bond length (Å) | C–Ob bond length (Å) | |
|---|---|---|---|
| LBF-111(LaBa–La)1 | 1.23 | 1.48 | 1.28 |
| LBF-111(LaBa–La)2 | 1.23 | 1.44 | 1.26 |
| LBF-111(LaBa–Fe)1 | 1.21 | 1.43 | 1.32 |
| LBF-111(LaBa–Fe)2 | 1.21 | 1.41 | 1.34 |
| LBF-111(BaLa–Fe)1 | 1.22 | 1.42 | 1.32 |
| LBF-111(BaLa–Fe)2 | 1.22 | 1.41 | 1.33 |
| LBF-111(BaLa–Ba)1 | 1.16 | 1.16 | — |
| LBF-111(BaLa–Ba)2 | 1.17 | 1.17 | — |
| LBF-100(Fe–O) | 1.22 | 1.40 | 1.37 |
| Vibration type (surface) | DFT | DRIFTS |
|---|---|---|
| ν as (100) | 1663 | 1606 |
| ν s (100) | 1415 | 1347 |
| ν δ (100) | 248 | 259 |
| ν as (111) | 1639 | 1544 |
| ν s (111) | 1450 | 1364 |
| ν δ (111) | 189 | 180 |
In comparison, the frequency differences (νδ) between antisymmetric (νas) and symmetric (νs) vibrations from DFT calculation results are 248 cm−1 and 189 cm−1. Although there are slight differences between the calculated vibrational frequencies and the experimental data due to the limitations of DFT calculations,45,46 the νδ values are in agreement. In this study, the calculated νδ of CO2 on reduced LBF is 189 cm−1, which is close to the experimental value of 180 cm−1, while the calculated νδ of CO2 on reduced LBF/SiO2 (25 wt%) is 248 cm−1, which is close to the experimental value of 259 cm−1. Thus, it can be concluded that CO2 is adsorbed in the form of carbonates during the oxidation step in RWGS-CL. The vibrational frequency difference between antisymmetric and symmetric vibrations decreases after adding SiO2 as a support material, indicating that the adsorbed CO2 on the (111) plane is monodentate carbonate different from bidentate carbonate on the (100) plane due to the difference of νδ in carbonate species.41,47,48
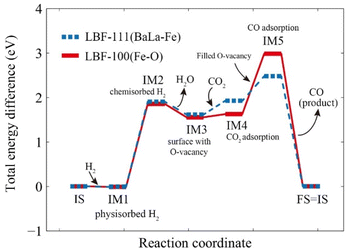 | ||
| Fig. 8 Step reaction energy for RWGS-CL. Red solid line is the reaction on (100) plane, and blue dotted line is the reaction on (111) plane. | ||
(1) IS – IM1: H2 is physisorbed on the original surface, resulting in an energy change of EIM1(100) = −0.014 eV for the (100) plane and EIM1(111) = −0.006 eV for the (111) plane.
(2) IM1 – IM2: the physisorbed H2 moves closer to the surface and forms a chemisorption state, resulting in an energy change of EIM2(100) = 1.85 eV for the (100) plane and EIM2(111) = 1.91 eV for the (111) plane.
(3) IM2 – IM3: the samples are reduced with adsorbed H2, resulting in the formation of oxygen vacancies on the surface and production of H2O, with an energy change of EIM3(100) = 1.55 eV for the (100) plane and EIM3(111) = 1.62 eV for the (111) plane.
(4) IM3 – IM4: CO2 is adsorbed on the reduced surface as carbonate form, resulting in an energy change of EIM4(100) = 1.63 eV for the (100) plane and EIM4(111) = 1.93 eV for the (111) plane.
(5) IM4 – IM5: adsorbed CO2 is converted to CO by oxidizing the oxygen-vacated surface, and the produced CO is adsorbed on the surface, resulting in an energy change of EIM5(100) = 2.98 eV for the (100) plane and EIM5(111) = 2.48 eV for the (111) plane.
(6) IM5 – FS: CO is desorbed, and the surface regains its original structure.
The intermediate energy results indicate that the reaction on the (111) plane requires a lower maximum energy (2.48 eV) compared to the reactions on the (100) plane (2.98 eV), which suggests that the (111) plane has the potential to produce a higher amount of CO at the same temperature. The reduction steps occur from IS to IM3, while the oxidation steps are described in eqn (2.1) to (2.3).
 | (2.1) |
 | (2.2) |
| CO* → CO+* | (2.3) |
4 Conclusion
Previous studies reported the increases of CO yield upon supporting on SiO2. To better describe the fundamental reason, this research focused particularly on the CO2 adsorption on both LBF and LBF/SiO2 surfaces during the oxidation step in RWGS-CL. X-ray diffraction (XRD) analysis revealed a morphology alteration upon SiO2 addition, notably a relative increase in the exposed (111) planes. TPD-CO2 combined with DRIFTS experiments further demonstrate CO2 adsorption as carbonate on the reduced perovskite surfaces. CO2 chemisorption shows CO2 sites increased from 12.4 to 60.6 μmol gLBF−1 after adding SiO2.TPO experiments under various oxidizers highlight the role of oxygen vacancies on the reduced perovskite surface. DFT calculations provided insight into the adsorption energy and structure of carbonate on different planes, identifying monodentate carbonate on the (111) plane and bidentate carbonate on the (100) plane, distinguished by variations in the carbonate species' stretching modes.
In situ DRIFTS further confirmed these findings, correlating specific νδ to monodentate and bidentate carbonate structures on the (111) and (100) planes, respectively. DFT calculations of the energy profiles for reaction intermediates suggest that the (111) surface offers a lower energy pathway for converting CO2 to CO. Collectively, these results elucidate the role of SiO2 in enhancing CO yield as the increased (111) planes facilitate monodentate carbonate formation, thereby reducing the energy requirement for converting CO2 to CO.
Data availability
The data supporting this article have been included as part of the ESI.†Conflicts of interest
J. N. K. and V. R. B. declare patents and other financial interests in this technology.Acknowledgements
This study was funded by NSF grant (IIP-1743623 and IIP-1913722), Florida High Tech Corridor, and a USF Fellowship (to HS).References
- Q. Jiang, J. Tong, G. Zhou, Z. Jiang, Z. Li and C. Li, Sol. Energy, 2014, 103, 425–437 CrossRef CAS.
- A. Le Gal and S. Abanades, J. Phys. Chem. C, 2012, 116, 13516–13523 CrossRef CAS.
- F. Fresno, R. Fernández-Saavedra, M. Belén Gómez-Mancebo, A. Vidal, M. Sánchez, M. Isabel Rucandio, A. J. Quejido and M. Romero, Int. J. Hydrogen Energy, 2009, 34, 2918–2924 CrossRef CAS.
- C. Agrafiotis, M. Roeb and C. Sattler, Renewable Sustainable Energy Rev., 2015, 42, 254–285 CrossRef CAS.
- Y. A. Daza, D. Maiti, B. J. Hare, V. R. Bhethanabotla and J. N. Kuhn, Surf. Sci., 2016, 648, 92–99 CrossRef CAS.
- A. E. Ramos, D. Maiti, Y. A. Daza, J. N. Kuhn and V. R. Bhethanabotla, Catal. Today, 2019, 338, 52–59 CrossRef CAS.
- H. Shi, V. R. Bhethanabotla and J. N. Kuhn, J. CO2 Util., 2021, 51, 101638 CrossRef CAS.
- B. J. Hare, D. Maiti, Y. A. Daza, V. R. Bhethanabotla and J. N. Kuhn, ACS Catal., 2018, 8, 3021–3029 CrossRef CAS.
- J. C. Brower, B. J. Hare, V. R. Bhethanabotla and J. N. Kuhn, ChemCatChem, 2020, 12, 6317–6328 CrossRef CAS.
- H. Shi, V. R. Bhethanabotla and J. N. Kuhn, J. Ind. Eng. Chem., 2023, 118, 44–52 CrossRef CAS.
- H. Onishi, C. Egawa, T. Aruga and Y. Iwasawa, Surf. Sci., 1987, 191, 479–491 CrossRef CAS.
- J. Hu, K. Zhu, L. Chen, C. Kübel and R. Richards, J. Phys. Chem. C, 2007, 111, 12038–12044 CrossRef CAS.
- J. K. Labanowski and J. W. Andzelm, Density Functional Methods in Chemistry, Springer Science & Business Media, 2012 Search PubMed.
- P. Politzer and J. M. Seminario, Modern Density Functional Theory: a Tool for Chemistry, Elsevier, 1995 Search PubMed.
- R. G. Parr and Y. Weitao, Density-Functional Theory of Atoms and Molecules, Oxford University Press, 1995 Search PubMed.
- T. Ziegler, Chem. Rev., 1991, 91, 651–667 CrossRef CAS.
- M. W. Wong, Chem. Phys. Lett., 1996, 256, 391–399 CrossRef CAS.
- L. J. Bartolotti and K. Flurchick, Rev. Comput. Chem., 1996, 7, 187–216 CAS.
- N. H. Elsayed, D. Maiti, B. Joseph and J. N. Kuhn, Catal. Lett., 2018, 148, 1003–1013 CrossRef CAS.
- G. H. Smudde, T. L. Slager, C. G. Coe, J. E. MacDougall and S. J. Weigel, Appl. Spectrosc., 1995, 49, 1747–1755 CrossRef CAS.
- H. Gao, H. He, Y. Yu and Q. Feng, J. Phys. Chem. B, 2005, 109, 13291–13295 CrossRef CAS PubMed.
- M. Popa and M. Kakihana, Solid State Ionics, 2002, 151, 251–257 CrossRef CAS.
- M. Bersani, K. Gupta, A. K. Mishra, R. Lanza, S. F. R. Taylor, H.-U. Islam, N. Hollingsworth, C. Hardacre, N. H. de Leeuw and J. A. Darr, ACS Catal., 2016, 6, 5823–5833 CrossRef CAS.
- L. F. Rasteiro, R. A. De Sousa, L. H. Vieira, V. K. Ocampo-Restrepo, L. G. Verga, J. M. Assaf, J. L. F. Da Silva and E. M. Assaf, Appl. Catal., B, 2022, 302, 120842 CrossRef CAS.
- P. Giannozzi, O. Andreussi, T. Brumme, O. Bunau, M. Buongiorno Nardelli, M. Calandra, R. Car, C. Cavazzoni, D. Ceresoli, M. Cococcioni, N. Colonna, I. Carnimeo, A. Dal Corso, S. de Gironcoli, P. Delugas, R. A. DiStasio, A. Ferretti, A. Floris, G. Fratesi, G. Fugallo, R. Gebauer, U. Gerstmann, F. Giustino, T. Gorni, J. Jia, M. Kawamura, H. Y. Ko, A. Kokalj, E. Küçükbenli, M. Lazzeri, M. Marsili, N. Marzari, F. Mauri, N. L. Nguyen, H. V. Nguyen, A. Otero-de-la-Roza, L. Paulatto, S. Poncé, D. Rocca, R. Sabatini, B. Santra, M. Schlipf, A. P. Seitsonen, A. Smogunov, I. Timrov, T. Thonhauser, P. Umari, N. Vast, X. Wu and S. Baroni, J. Phys.: Condens. Matter, 2017, 29, 465901 CrossRef CAS PubMed.
- K. Burke, J. Chem. Phys., 2012, 136, 150901 CrossRef.
- A. Jain, S. P. Ong, G. Hautier, W. Chen, W. D. Richards, S. Dacek, S. Cholia, D. Gunter, D. Skinner, G. Ceder and K. A. Persson, APL Mater., 2013, 1, 011002 CrossRef.
- P. Giannozzi, S. Baroni, N. Bonini, M. Calandra, R. Car, C. Cavazzoni, D. Ceresoli, G. L. Chiarotti, M. Cococcioni, I. Dabo, A. Dal Corso, S. de Gironcoli, S. Fabris, G. Fratesi, R. Gebauer, U. Gerstmann, C. Gougoussis, A. Kokalj, M. Lazzeri, L. Martin-Samos, N. Marzari, F. Mauri, R. Mazzarello, S. Paolini, A. Pasquarello, L. Paulatto, C. Sbraccia, S. Scandolo, G. Sclauzero, A. P. Seitsonen, A. Smogunov, P. Umari and R. M. Wentzcovitch, J. Phys.: Condens. Matter, 2009, 21, 395502 CrossRef PubMed.
- K. F. Garrity, J. W. Bennett, K. M. Rabe and D. Vanderbilt, Comput. Mater. Sci., 2014, 81, 446–452 CrossRef CAS.
- G. Kresse and D. Joubert, Phys. Rev. B, 1999, 59, 1758–1775 CrossRef CAS.
- J. P. Perdew, K. Burke and M. Ernzerhof, Phys. Rev. Lett., 1996, 77, 3865–3868 CrossRef CAS PubMed.
- D. Maiti, Y. A. Daza, M. M. Yung, J. N. Kuhn and V. R. Bhethanabotla, J. Mater. Chem. A, 2016, 4, 5137–5148 RSC.
- I. W. Boateng, R. Tia, E. Adei, N. Y. Dzade, C. R. A. Catlow and N. H. de Leeuw, PCCP Phys. Chem. Chem. Phys., 2017, 19, 7399–7409 RSC.
- D. S. Sholl and J. A. Steckel, Density Functional Theory: a Practical Introduction, John Wiley & Sons, 2011 Search PubMed.
- L. Zhang, A. A. S. Gonçalves and M. Jaroniec, RSC Adv., 2020, 10, 5585–5589 RSC.
- R. A. McKee, F. Walker and M. Chisholm, Phys. Rev. Lett., 1998, 81, 3014 CrossRef CAS.
- D. M. Bryan, J. Hare, Y. A. Daza, V. R. Bhethanabotla and J. N. Kuhn, ACS Catal., 2018, 8, 3021–3029 CrossRef.
- J. Arenas-Alatorre, M. Avalos-Borja and G. Díaz, Appl. Surf. Sci., 2002, 189, 7–17 CrossRef CAS.
- S. Brunauer, P. H. Emmett and E. Teller, J. Am. Chem. Soc., 1938, 60, 309–319 CrossRef CAS.
- C. Chen and W.-S. Ahn, Chem. Eng. J., 2011, 166, 646–651 CrossRef CAS.
- K. Coenen, F. Gallucci, B. Mezari, E. Hensen and M. van Sint Annaland, J. CO2 Util., 2018, 24, 228–239 CrossRef CAS.
- G. Pacchioni, Surf. Sci., 1993, 281, 207–219 CrossRef CAS.
- F. H. Allen and A. J. Kirby, J. Am. Chem. Soc., 1984, 106, 6197–6200 CrossRef CAS.
- J. Demaison and A. G. Császár, J. Mol. Struct., 2012, 1023, 7–14 CrossRef CAS.
- A. A. El-Azhary and H. U. Suter, J. Phys. Chem., 1996, 100, 15056–15063 CrossRef CAS.
- M. L. Laury, M. J. Carlson and A. K. Wilson, J. Comput. Chem., 2012, 33, 2380–2387 CrossRef CAS PubMed.
- B. H. Solis, Y. Cui, X. Weng, J. Seifert, S. Schauermann, J. Sauer, S. Shaikhutdinov and H.-J. Freund, Phys. Chem. Chem. Phys., 2017, 19, 4231–4242 RSC.
- J. Liu, Y. Li, H. Liu and D. He, Biomass Bioenergy, 2018, 118, 74–83 CrossRef CAS.
Footnote |
| † Electronic supplementary information (ESI) available. See DOI: https://doi.org/10.1039/d4su00416g |
| This journal is © The Royal Society of Chemistry 2025 |

