DOI:
10.1039/D4TB01871K
(Paper)
J. Mater. Chem. B, 2025, Advance Article
Live cell imaging of lipid droplets: fluorescent chalcones as probes for lipophagy and lipid–mitochondria interactions†
Received
17th August 2024
, Accepted 22nd November 2024
First published on 26th November 2024
Abstract
Lipid droplets are crucial organelles involved in cellular energy storage and metabolism, which is key in maintaining energy homeostasis through lipophagy. In this work, we successfully synthesized donor–acceptor chalcone derivatives (M1–M3) with improved photophysical characteristics, such as significant Stokes shifts and strong emission features. DFT and TDDFT calculations have been employed to evaluate the structure–property relationship of the chalcone derivatives. The molecules show excellent selectivity in staining lipid droplets in COS-7 cells and other cell lines. The molecule M1 was also further utilized to monitor verapamil-induced lipophagy. Using M1, we also demonstrate the link between lipid droplets and mitochondria during stress, emphasizing the significance of lipophagy in cellular energy balance and metabolism. These results not only shed light on the lipid metabolism but also have profound implications for researching and potentially treating metabolic diseases, underscoring the importance of our work in the field.
Introduction
Lipid droplets (LDs) are essential cellular organelles in energy storage, lipid metabolism, and cellular signalling. They help maintain membrane homeostasis and assist in protein quality control, and their dysregulation is linked to diseases like obesity, diabetes, cardiovascular issues, and cancer.1–3 Monitoring LD dynamics using fluorophores offers high sensitivity and spatial resolution. Fluorescent probes like Nile Red, BODIPY, and various fluorophores label LDs for visualization under fluorescence microscopy, enabling real-time live-cell imaging of their formation, growth, and interaction with other organelles.4 This approach allows quantitative analysis of LD size, number, and distribution, which is crucial for understanding their physiological and pathological roles. Monitoring lipophagy, the autophagic degradation of lipid droplets is vital for understanding lipid homeostasis. Fluorescent probes and advanced imaging techniques allow the observation of LD engulfment by autophagosomes and their subsequent degradation, shedding light on the mechanisms of lipid turnover and the role of autophagy in metabolic health. Although several compound libraries have been established, we looked at utilising a chalcone scaffold to investigate lipid droplet imaging and examine the autophagy process. Chalcones are a group of natural compounds belonging to the flavonoid family, characterized by two aromatic rings joined by a three-carbon α,β-unsaturated carbonyl system. They are precursors to flavonoids and isoflavonoids and have been found in various plants, contributing to their color, flavor, and potential health benefits.5–8 Considering their natural relevance, several fluorescent and structural derivatives of chalcones have been designed and investigated for their photophysical properties,9,10 DSSCs,11 sensing of environmental and biological analytes,12–16 protein aggregation17 and as drug candidates.7,18,19 Considering their utility, a few chalcone derivatives were also explored for investigating cellular applications, such as detecting biologically relevant analytes such as peroxynitrite,20 galactose,21 and biothiols.22 Relevant to the current work, a few chalcone derivatives (Fig. 1) were designed for imaging the sub-cellular organelles such as lysosomes (Cha-9),23 detection of the biological analytes:21,22 cysteine (Lyso-CDC),24 endogenous and exogenous glutathione (HCA-E),25 H2S (indene-chalcone with 2,4-dinitrophenyl group),26 and carboxylesterases (indene-chalcone).27 Chalcone derivatives substituted with triphenylphosphonium (Mito-HCA) have been utilized for mitochondrial labelling28 while 3-aminobenzochalcone derivatives have been employed for labelling neutrophilic granules in zebrafish29 and imaging organelles in Leishmania.30 Hydroxy phenacyl substituted chalcones with anticancer drug valproic acid (HA-DAB-VPA) and its ester (HA-DPB-VPA) were designed for specific targeting of lipid droplets and selective release of drugs through light activation.31 Considering the potential of such push–pull substituted chalcones for bioimaging, their synthetic ease and structural tunability, and limited use in cellular imaging applications made us design and synthesize naphthalene and coumarin chalcone derivatives. The molecules show strong photophysical properties with good solvatochromic emission and exquisite localization within the lipid droplets. The strong staining of the chalcones towards lipid droplets allowed us to investigate lipophagy, a specialized form of autophagy, involving the selective degradation of lipid droplets to regulate lipid turnover and maintain cellular lipid balance. Monitoring lipophagy using fluorophores allows researchers to visualize and quantify the dynamic process of lipid droplet degradation within cells, providing insights into cellular lipid metabolism and the mechanisms underlying lipid-related diseases. Further, we demonstrate the interplay between the LDs and mitochondria during the lipophagy process.
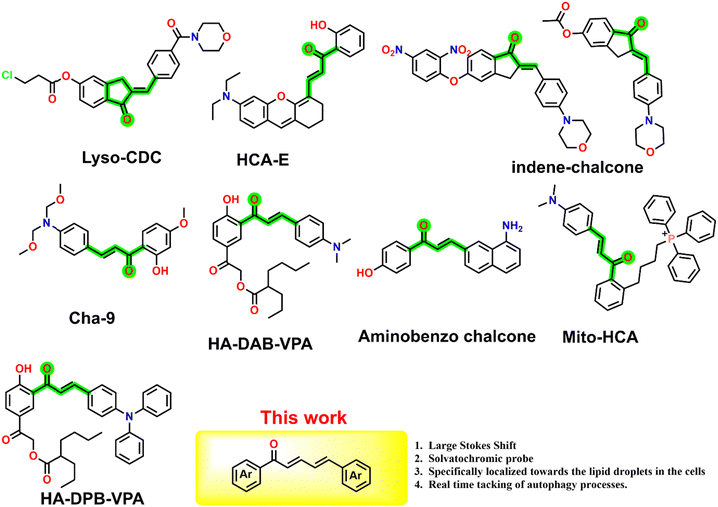 |
| | Fig. 1 Examples of a few reported chalcone-based fluorescent probes used for imaging of sub-cellular imaging. | |
Material and methods
All the chemicals and reagents used in synthesizing substituted donor–acceptor (D–A) chalcone derivatives and for spectroscopic studies were obtained from BLD Pharm, Sigma-Aldrich, Alfa Aesar, and S.D. Fine chemicals, and were used as received. The reactions were performed in a closed-cap round-bottom flask, and the reaction progress was monitored by TLC [0.23 mm pre-coated silica gel aluminium sheets]. The NMR spectral data (1H NMR, 13C NMR) in CDCl3 or DMSO-d6 were obtained from a Bruker Avance-500 MHz NMR spectrometer. Mass spectral data were obtained using an ESI-Q-ToF Waters Synapt G2-S mass spectrometer.
Photophysical experiments
The absorption and emission studies were performed using Jasco UV750 and Horiba Jobin Yvon fluorolog-3 spectrofluorometer, respectively. A concentration of 10 μM (M1–M3) was used for the photophysical investigations. The excitation wavelengths for obtaining the emission spectra are fixed at the absorption maxima of the compounds under investigation. The relative fluorescence quantum yield is obtained using the following equation.
where Φ is the quantum yield, I is the integrated intensity, A is the absorbance at the excitation wavelength, η is the refractive index of the solvent. The subscript R refers to the reference fluorophore of known quantum yield, and S refers to the sample fluorophore. Relative quantum yields were determined using fluorescein [QY = 0.95 in 0.1 M NaOH] as the quantum yield standard.32
Cell culture and cellular imaging
COS-7 (monkey kidney fibroblast from ATCC), SH-SY5Y (isolated from bone marrow biopsy taken from a four-year-old female with neuroblastoma), and McA-RH 7777 (isolated from the liver of a female rat with hepatoma) cells were grown in DMEM cell media with 10% FBS and 2 mM GluataMAX (Gibco) at 37 °C in a humidified environment with 5% CO2. For live cell imaging, 0.55 × 10⁵ cells were grown in 35 mm glass-bottomed dishes with 2% (20 μL) pen-strep in 2 mL cell culture media. The cells are incubated with the synthesized chalcone derivatives for cellular imaging with 5–10 minutes. For the colocalization experiment, each plate of COS-7, SH-SY5Y and McA-RH 7777 was treated with their respective markers: Nile Red (lipid droplets) 15 nM, LysoTrackerTM Deep Red-LTR (lysosomes), 20 nM. Live cell imaging was performed on a Leica laser scanning confocal microscope (TCS SPI8) at 37 °C in 5% CO2 and adequate relative humidity using a 63× oil immersion objective. Images were obtained using 458 nm and 488 nm, 633 nm (LysoTrackerTM Deep Red, MitoTracker Deep Red-MTR), and 514 nm (for Nile Red). Emission signals were collected using the HyD detector in the sequential imaging mode. Bright-field images were collected using a TDS detector.
Cell viability assay
MTT (4,5- dimethylthiazol-2-yl)-2,5-diphenyltetrazolium bromide) assay was used to quantify the effect of synthesized chalcones on the cell viability in the COS-7 cell lines. The COS-7 cells were seeded in 96-well plates at the concentration of 60![[thin space (1/6-em)]](https://www.rsc.org/images/entities/char_2009.gif) 000 cells per mL (cell density: 6000 cells per well) and incubated for 24 h. After a 24 h incubation, the cells were treated with different concentrations (0.50 μM, 1 μM, 2 μM, 4 μM and 8 μM). Separately, the cells treated with DMEM were taken as control. Then, 96 well plates were incubated at 37 °C for 48 h. At the end of the treatment, 100 μL of MTT solution of concentration 0.5 mg mL−1 was added to each well, and the solution, along with cells, was further incubated for 4 h at 37 °C. After incubation, allowing the dissolution of the formazan crystals formed, 65 μL DMSO was added and shaken for 10 minutes, followed by measurement of the colour intensity using a plate reader at 570 nm. All the experiments were performed six times, and the cell viability (%) was calculated using origin.
000 cells per mL (cell density: 6000 cells per well) and incubated for 24 h. After a 24 h incubation, the cells were treated with different concentrations (0.50 μM, 1 μM, 2 μM, 4 μM and 8 μM). Separately, the cells treated with DMEM were taken as control. Then, 96 well plates were incubated at 37 °C for 48 h. At the end of the treatment, 100 μL of MTT solution of concentration 0.5 mg mL−1 was added to each well, and the solution, along with cells, was further incubated for 4 h at 37 °C. After incubation, allowing the dissolution of the formazan crystals formed, 65 μL DMSO was added and shaken for 10 minutes, followed by measurement of the colour intensity using a plate reader at 570 nm. All the experiments were performed six times, and the cell viability (%) was calculated using origin.
Tracking lipid droplets during stress
COS-7 cells were cultured in two live cell plates in DMEM cell media with 10% FBS and 2 mM GlutaMAX (Gibco) at 37 °C in a humidified environment with 5% CO2 for 24 h. The serum-free DMEM media was then added to one live cell plate and cultivated for 18 h, followed by the addition of M1, which served as the control. In another live cell plate, a serum-free DMEM medium was added. After incubating cells with 100 μM oleic acid and adding M1, images were captured at different intervals.
Tracking lipophagy
COS-7 cells were grown in DMEM cell media with 10% FBS and 2 mM GlutaMAX (Gibco) at 37 °C in a humidified environment with 5% CO2 for 20 h. The cells were then pre-treated with 100 μM oleic acid for 12 h, which induces the production of lipid droplets. After that, old media was replaced with new DMEM media with 10% FBS, and then cells were incubated with 50 μM verapamil for 4 h to induce lipophagy. The cells were treated with M1 and LysoTracker deep red (LTR) for 20 min. The cells without verapamil were used as controls.
Oxidative stress
COS-7 cells were grown in DMEM cell media with 10% FBS and 2 mM GlutaMAX (Gibco) at 37 °C in a humidified environment with 5% CO2 for 18 h. Then, cells were incubated with (10 mM) H2O2 for 2 h at 37 °C with 5% CO2 to induce oxidative stress. Then old medium was changed with fresh DMEM media. Then, the cells were incubated with M1 and Mitotracker red for 10 minutes. Cells without H2O2 treatment were used as controls.
Results and discussion
One of our aims is to construct molecules that can efficiently absorb and emit light at longer wavelengths. Considering that unsubstituted chalcone has low fluorescence, we developed structural variants by introducing electron withdrawing and donating groups. Electron-donating and electron-withdrawing groups connected with π-linkers facilitate efficient intramolecular charge transfer (ICT) upon excitation.33 For extended conjugation, we utilized naphthyl, coumarin or additional double bond to bring forth solvatochromic emission. Such solvatochromic emission with large Stokes shifts is pertinent to the investigations in the biological milieu. Additionally, the naphthyl or coumarin moieties also aid in improving lipophilicity. The molecules M1–M3 (Scheme 1) are synthesized by a condensation reaction of the aldehyde (dimethylamino cinnamaldehyde; M1 and M3), trans,trans-5-[4-(dimethylamino)phenyl]-2,4-pentadienal (M2) derivatives with the ketone derivatives (Scheme 1). trans,trans-5-[4-(dimethylamino)phenyl]-2,4-pentadienal required for the synthesis of M2 is synthesized using established procedure utilizing a Wittig methodology34 and the acetylcoumarin derivative for the synthesis of M3 was synthesized as per earlier reports.35 M1 and M2 have a naphthalene scaffold, while M3 has a coumarin scaffold. M2 differs from M1 by the presence of a double bond. The molecules are characterized by electron-donating dimethylamino or methoxy groups at both terminals that would facilitate better intramolecular charge transfer and bathochromic emission shifts.
 |
| | Scheme 1 A schematic of the synthesis of chalcone derivatives (M1–M3). | |
Photophysical properties
The absorption and emission maxima of the donor–acceptor (D–A) substituted chalcones M1–M3 are given in Table 1. The molecules absorb in the range of 431–478 nm in dioxane depending on the nature of the substituents, with M3 being the longest (Fig. 2A). Compounds show small changes in absorption maxima with increased solvent polarity (Fig. 2B and Fig S1, ESI†). The additional double bond in M2 and extended conjugation due to the presence of coumarin in M3 results in bathochromic shifts owing to the enhanced delocalization. The absorption in water is broader due to their inherent solubility. The emission trends are slightly different, with M2 being lower than M1 or M3, as noted in acetonitrile (Fig. 3A). With the increase in solvent polarity, moderate to strong shifts 66–100 nm shifts from dioxane to DMSO in the emission maxima of the compounds are noted [Fig. 3B and Fig S2, ESI†]. The energy of the ground state in a polar solvent. Further, the effect of solvent polarity was also studied with a dioxane-water binary solvent system yielding bathochromic emission shift with increased water percent (Fig S3, ESI†). All the molecules show a strong Stokes shift greater than 130 nm due to the excited state stabilisation. The longer Stokes shift is also an essential parameter for developing fluorophores, particularly for biological investigations, as it minimises the crosstalk and gives a better signal/noise ratio.36
Table 1 Photophysical properties of the synthesized compounds M1–M3
| |
|
Dioxane |
THF |
MeCN |
DMF |
MeOH |
DMSO |
Water |
| *λab absorption maxima; λem emission maxima; Δν Stokes shift; Φ quantum yield; ε* 104 molar extinction coefficient; Δν is adjusted to the nearest whole number. |
| M1 |
λex (nm) |
426 |
430 |
431 |
441 |
441 |
447 |
433 |
| λem (nm) |
555 |
581 |
616 |
612 |
645 |
616 |
646 |
| Δν (cm−1) |
5456 |
6044 |
6493 |
6335 |
7171 |
6137 |
7246 |
| ε* (104) |
3.64 |
3.49 |
3.53 |
3.29 |
3.42 |
3.23 |
2.18 |
| Φ (%) |
3.67 |
12.33 |
18.83 |
2.07 |
6.05 |
12.61 |
0.71 |
| M2 |
λex (nm) |
440 |
443 |
443 |
453 |
451 |
461 |
435 |
| λem (nm) |
592 |
617 |
658 |
658 |
692 |
663 |
665 |
| Δν (cm−1) |
5835 |
6365 |
7375 |
6877 |
7722 |
6609 |
7950 |
| ε* (104) |
3.70 |
3.33 |
3.43 |
3.27 |
3.33 |
3.18 |
1.79 |
| Φ (%) |
6.78 |
4.56 |
1.08 |
4.51 |
63.67 |
4.41 |
2.34 |
| M3 |
λex (nm) |
470 |
474 |
478 |
485 |
484 |
491 |
520 |
| λem (nm) |
606 |
631 |
671 |
667 |
678 |
674 |
671 |
| Δν (cm−1) |
4774 |
5249 |
6017 |
5626 |
5911 |
5529 |
4253 |
| ε* (104) |
1.24 |
1.27 |
0.92 |
1.02 |
1.75 |
0.92 |
0.45 |
| Φ (%) |
0.19 |
0.09 |
— |
— |
— |
— |
— |
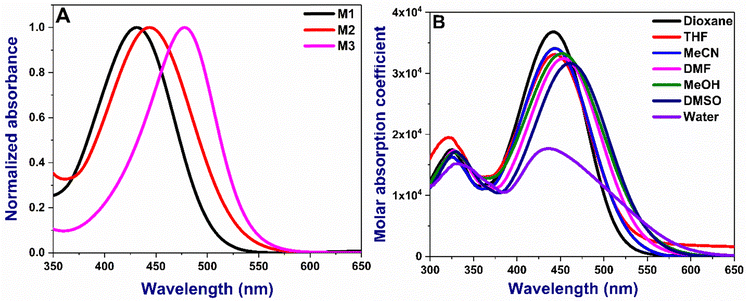 |
| | Fig. 2 (A) Normalized absorption spectra of M1–M3 in acetonitrile (B) absorption of M2 in all various solvents. Concentration: 10 μM. The absorption spectra of M2 and M3 are given in Fig. S1 (ESI†). | |
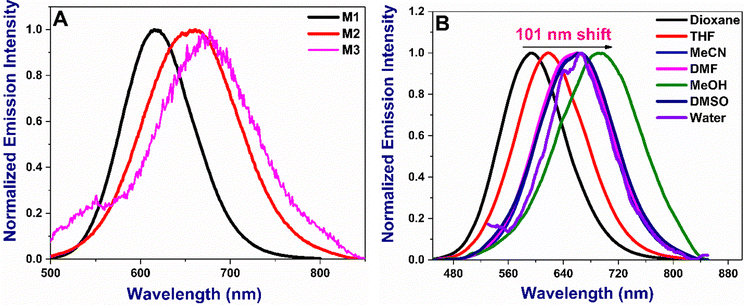 |
| | Fig. 3 (A) Normalized emission of all M1–M3 in acetonitrile (B) emission spectra of M2 in various solvents. Concentration: 10 μM. Emission spectra of M1 and M3 are given in Fig. S2 (ESI†). | |
Computational methods
Density functional theory (DFT) and time-dependent DFT (TDDFT) methods were used to compute the structural optimizations at the ground and excited state characteristics using the Gaussian 16 ab initio quantum chemical software package.37 All the optimization and single point calculations were carried out in gas and solvent phases without symmetry constraints, using the B3LYP/6-311G(d,p) level of theory. Vibrational analysis was performed for all optimised structures to confirm the absence of imaginary frequencies, ensuring a stable global minimum configuration on the potential surface (PES). The optimized geometries were subsequently used as inputs for further single-point calculations, including frontier molecular orbitals (FMOs), density of states (DOS), and absorption simulations. To model the experimental absorption spectra of the molecules, single-point time-dependent DFT (TDDFT) calculations were performed, considering the first 15 vertical singlet–singlet transitions. The integral equation formalism polarizable continuum model (IEF-PCM) within self-consistent reaction field (SCRF) theory was used to describe the solvation model, with acetonitrile as the solvent. TDDFT calculations were performed using various functionals, including B3LYP, M062X, and PBE0, with the 6-311G(d,p) basis set to approximate experimental accuracy. GaussSum 3.0.2 software was employed to simulate the absorption spectrum and interpret the nature of electronic transitions.38
Quantum chemical calculations
The extent of π-conjugation within a molecular framework provides valuable insights into its optoelectronic properties, typically assessed by examining the torsional distortions between the donor, π-linker, and acceptor units.39 As shown in Fig. 4, the HOMO–LUMO (H–L) gap decreased in the following order (eV): M1 (2.78) > M2 (2.53) > M3 (2.32). The relatively large H–L gap in M1 was attributed to steric repulsion between the α-hydrogen of the conjugated dienes (∼2.5°) and the outer ortho-hydrogen (∼11.5°) of the naphthalene, which reduced π-orbital overlap (Fig. S4, ESI†). Meanwhile, LUMO stabilization in M1 primarily resulted from extensive π-delocalization within the naphthalene unit. For M2, extending the π-conjugation from diene to triene further decreased the H–L gap through a combined effect of HOMO destabilization and LUMO stabilization. Compared to M1 and M2, M3 features a different acceptor segment, where methoxy naphthalene is replaced by N,N-diethylcoumarin. The n → π* transitions, enabled by the heteroatomic O–C![[double bond, length as m-dash]](https://www.rsc.org/images/entities/char_e001.gif) O functionality in M3, facilitated HOMO delocalization from −5.25 to −5.03 eV, contributing to significant band gap narrowing. In contrast, π → π* transitions dominate in M1 and M2. Additionally, a strong intramolecular H-contact (2.163 Å) between the α-hydrogen of the conjugated dienes and the C
O functionality in M3, facilitated HOMO delocalization from −5.25 to −5.03 eV, contributing to significant band gap narrowing. In contrast, π → π* transitions dominate in M1 and M2. Additionally, a strong intramolecular H-contact (2.163 Å) between the α-hydrogen of the conjugated dienes and the C![[double bond, length as m-dash]](https://www.rsc.org/images/entities/char_e001.gif) O group of coumarin in M3 promotes planarization and stabilizes the molecular framework (Fig. S4, ESI†). As a result, the LUMO energy of M3 is significantly lowered (−2.71 eV), making it the compound with the smallest band gap in the series. For all chalcone derivatives, the electron density in the HOMO is primarily localized on the donor and spacer units while shifting toward the acceptor unit in the LUMO. However, the electron density distribution on the acceptor segment varies depending on the electron-deficient nature of each acceptor. To obtain an accurate representation of electron density distribution across the acceptor units, DOS and PDOS analyses were conducted, dividing the molecular framework into three segments: donor, π-spacer, and acceptor (Fig. S5–S7, ESI†). The HOMO electron density remains nearly constant for M1 (61%) and M3 (59%), while the extended π-conjugation in M2's triene segment results in higher electron density (44%). In contrast, the LUMO distribution differs significantly across the chalcone derivatives. For example, the naphthalene acceptor segment in M1 bears a substantial portion of the LUMO electron density (43%). However, the increased π-conjugation in M2 reduces acceptor electron density to 34%. In M3, the coumarin segment shows a markedly high LUMO electron density (71%), underscoring the strong acceptor nature of the keto-functionalized coumarin unit (Fig. 5B). Consequently, M3 exhibits a greater extent of intramolecular charge transfer (ICT) transitions. This finding is further supported by molecular electrostatic potential (ESP) plots, which reveal a pronounced negative electrostatic region around the acceptor segment in M3, primarily due to the keto group and O–C
O group of coumarin in M3 promotes planarization and stabilizes the molecular framework (Fig. S4, ESI†). As a result, the LUMO energy of M3 is significantly lowered (−2.71 eV), making it the compound with the smallest band gap in the series. For all chalcone derivatives, the electron density in the HOMO is primarily localized on the donor and spacer units while shifting toward the acceptor unit in the LUMO. However, the electron density distribution on the acceptor segment varies depending on the electron-deficient nature of each acceptor. To obtain an accurate representation of electron density distribution across the acceptor units, DOS and PDOS analyses were conducted, dividing the molecular framework into three segments: donor, π-spacer, and acceptor (Fig. S5–S7, ESI†). The HOMO electron density remains nearly constant for M1 (61%) and M3 (59%), while the extended π-conjugation in M2's triene segment results in higher electron density (44%). In contrast, the LUMO distribution differs significantly across the chalcone derivatives. For example, the naphthalene acceptor segment in M1 bears a substantial portion of the LUMO electron density (43%). However, the increased π-conjugation in M2 reduces acceptor electron density to 34%. In M3, the coumarin segment shows a markedly high LUMO electron density (71%), underscoring the strong acceptor nature of the keto-functionalized coumarin unit (Fig. 5B). Consequently, M3 exhibits a greater extent of intramolecular charge transfer (ICT) transitions. This finding is further supported by molecular electrostatic potential (ESP) plots, which reveal a pronounced negative electrostatic region around the acceptor segment in M3, primarily due to the keto group and O–C![[double bond, length as m-dash]](https://www.rsc.org/images/entities/char_e001.gif) O functionality of coumarin. Additionally, total charge density increases notably from 2.96 to 3.44 × 10⁻² esu. In contrast, the negative electrostatic environment in M1 and M2 is localized only in the keto group. Mulliken population analysis of the chalcone derivatives shows a trend consistent with the ESP plots (Fig. S7, ESI†). The molecular geometry coordinates showing the bond length variations are shown in Fig. S8, ESI†). The dipole moments in the transient excited state (μe) for M1 and M2 are significantly higher than those in the ground state (μg). This larger μe suggests considerable structural relaxation in the excited state, aligning well with the experimental trend of positive solvatochromism (Table 2). However, M3 shows only a slight enhancement in dipole moment. The substantial dipole moment variation in M1 and M2 promotes pronounced structural shifts through interactions with solvent dipoles, resulting in a large Stokes shift.40 The rigidity enabled by the increased number of intramolecular contacts reduced the Stokes shift for M3. Extensive TDDFT simulations were conducted using a series of density functionals, including B3LYP, M062X, and PBE0, with a 6-311G(d,p) basis set and C-PCM (acetonitrile) solvation model (Fig. 5A). While B3LYP simulated absorption showed significant overestimation and deviated from the experimental trend, PBE0, despite some underestimation, followed the experimental trend more closely. Remarkably, M062X provided an excellent match with experimental absorption, offering highly accurate predictions. For M1 and M2, the primary transition upon photoexcitation is from HOMO to LUMO (91%). In M3, however, the extensive π-delocalization is somewhat reduced due to the replacement of the naphthalene unit with coumarin, decreasing the HOMO to LUMO transition to 78%, with additional contributions from HOMO−1 and LUMO+1 energy levels.
O functionality of coumarin. Additionally, total charge density increases notably from 2.96 to 3.44 × 10⁻² esu. In contrast, the negative electrostatic environment in M1 and M2 is localized only in the keto group. Mulliken population analysis of the chalcone derivatives shows a trend consistent with the ESP plots (Fig. S7, ESI†). The molecular geometry coordinates showing the bond length variations are shown in Fig. S8, ESI†). The dipole moments in the transient excited state (μe) for M1 and M2 are significantly higher than those in the ground state (μg). This larger μe suggests considerable structural relaxation in the excited state, aligning well with the experimental trend of positive solvatochromism (Table 2). However, M3 shows only a slight enhancement in dipole moment. The substantial dipole moment variation in M1 and M2 promotes pronounced structural shifts through interactions with solvent dipoles, resulting in a large Stokes shift.40 The rigidity enabled by the increased number of intramolecular contacts reduced the Stokes shift for M3. Extensive TDDFT simulations were conducted using a series of density functionals, including B3LYP, M062X, and PBE0, with a 6-311G(d,p) basis set and C-PCM (acetonitrile) solvation model (Fig. 5A). While B3LYP simulated absorption showed significant overestimation and deviated from the experimental trend, PBE0, despite some underestimation, followed the experimental trend more closely. Remarkably, M062X provided an excellent match with experimental absorption, offering highly accurate predictions. For M1 and M2, the primary transition upon photoexcitation is from HOMO to LUMO (91%). In M3, however, the extensive π-delocalization is somewhat reduced due to the replacement of the naphthalene unit with coumarin, decreasing the HOMO to LUMO transition to 78%, with additional contributions from HOMO−1 and LUMO+1 energy levels.
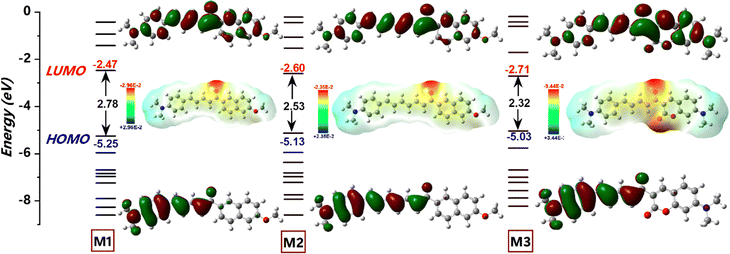 |
| | Fig. 4 A schematic diagram illustrating the frontier energy levels of the chalcone derivatives, primarily influenced by the π-spacer (diene/triene) and acceptor (naphthalene and coumarin) units, along with their corresponding isodensity surface plots of frontier molecular orbitals and electrostatic potential (ESP) surface plots, obtained from DFT/B3LYP/6-311G(d,p) level of theory. | |
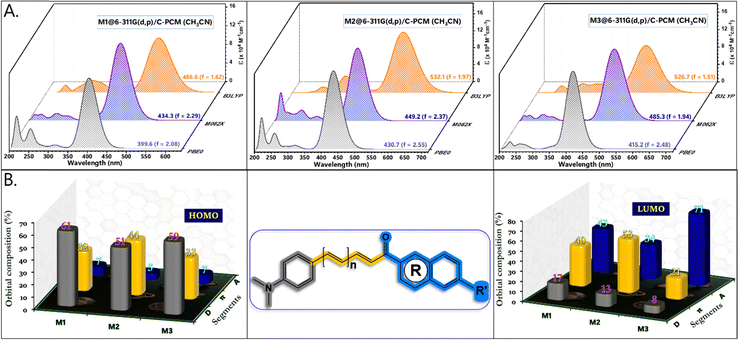 |
| | Fig. 5 (A) TDDFT simulated spectra of the chalcone derivatives obtained from B3LYP, M062X, and PBE0/6-311G(d,p)/C-PCM (acetonitrile) level of theory. (B) Percentage contributions of molecular orbital coefficients from the donor, π-spacer, and acceptor segments toward the charge transfer (CT) transitions of the molecular framework. | |
Table 2 DFT computed frontier energy levels, comparison of absorption with TDDFT simulations, oscillator strength (f), major transitions involved and ground (μg) and transient (μe) state dipole moments
| |
HOMO (eV) |
LUMO (eV) |
H–L gap (eV) |
λExp (nm) |
λm062x (nm) |
f |
Major transitions involved |
μg (debye) |
μe (debye) |
| M1 |
−5.25 |
−2.47 |
2.78 |
431 |
369.22 |
2.29 |
HOMO → LUMO (91%), HOMO → L+1 (3%) |
6.73 |
7.79 |
| M2 |
−5.13 |
−2.60 |
2.53 |
443 |
324.63 |
2.37 |
HOMO → LUMO (91%), H−2 → LUMO (3%), HOMO → L+1 (3%) |
7.50 |
9.02 |
| M3 |
−5.03 |
−2.71 |
2.32 |
478 |
366.29 |
1.94 |
HOMO → LUMO (78%), H−2 → LUMO (2%), H−1 → LUMO (8%), H−1 → L+1 (3%), HOMO → L+1 (6%) |
5.03 |
5.56 |
Cellular imaging and colocalization
The compounds are characterized by strong emission > 600 nm and a large Stokes shift. Consequently, these frameworks are well-suited for investigation of subcellular complexities.41 To evaluate their utility for cellular studies, we evaluated their cytotoxicity using an MTT assay (Fig. S9, ESI†) that revealed no adverse effect. Following this, we performed the live-cell imaging of the chalcones (M1–M3) in COS-7 cell lines, revealing a vesicle-like morphology. This morphology indicates lipid droplets. To confirm, we performed the colocalization experiment with a known commercial lipid droplet marker, Nile Red, that yielded an excellent Pearson's coefficient correlation (PCC) of 0.93, 0.89 and 0.79 for M1, M2 and M3, respectively (Fig. 6).
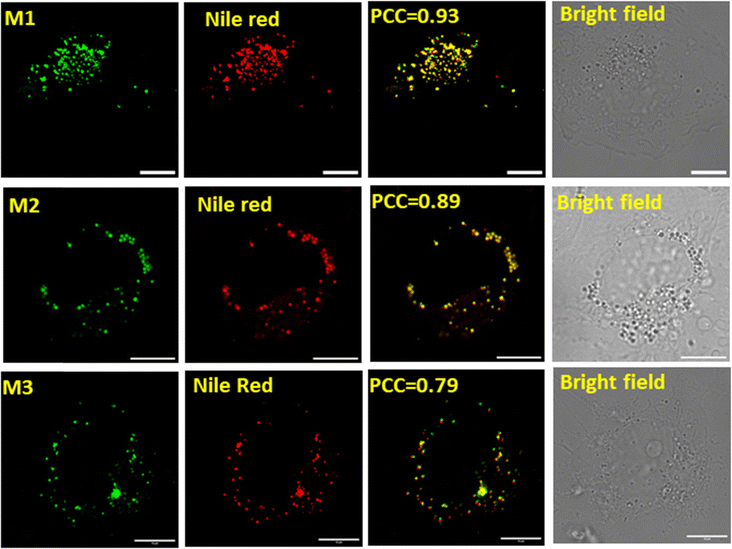 |
| | Fig. 6 Cellular imaging and colocalization in COS-7 cells: the cells were stained with M1 or M2 (2.5 μM) and Nile Red (15 nM: commercial marker): M1: λex 458 nm, λem 460–520 nm, M2: λex 458 nm, λem 465–520 nm and Nile Red λex 514 nm, λem 525–565 nm; (incubation time: 15–20 min, 37 °C, 5% CO2, scale bar = 10 μm). Green channel for M1 & M2, Red channel for Nile Red, merged image for respective green and red channel. | |
The experiments were repeated with other cell lines SH-SY5Y and McA-RH7777 to demonstrate generality. The molecule (M1) incubation in the cell lines yield similar LD localization with a strong PCC of 0.89 and 0.84, respectively (Fig S10, ESI†). Similar results are noted with M2 and M3, which yielded localization within the LDs. To investigate M1's pH sensitivity and its impact on the cellular localization, we conducted colocalization studies using Nile Red and Lysotracker Deep Red (LTR). To ensure spectral separation, additional colocalization studies were performed with LTR, M1, and Nile Red, that yielded Pearson correlation coefficients (PCC) of 0.19 and 0.09, respectively (Fig. S11 and S12, ESI†), indicating weaker influence of pH on the cellular localization. Photostability is crucial for cellular imaging, as it allows fluorescent dyes or probes to maintain brightness over time, supporting accurate and consistent visualisation of cellular processes. M1 demonstrated photostability over a 30-minute period. (Fig. S15, ESI†)
Effect of stress
Lipid droplets store the energy in the form of triglycerides and cholesterol esters and play a significant role during starvation.42 Under starvation, LD delivers nutrients to the energy-deficient cell via a specific autophagy process, lipophagy.43 Lipophagy is a specific form of autophagy in which cells break down and recycle their lipid droplets. This process involves the degradation of stored fats within cells to release fatty acids, which can be used for energy production or other cellular function.44 Initially, the cells were starved in DMEM media for 18 h, and then M1 was added for lipid droplet visualization (Fig. 7A). Through confocal imaging, we note that the initial starvation contributed to the degradation of the lipid droplets that provided the necessary nutrients to cells, leading to a significant reduction in the LD count. However, after the addition of oleic acid45 (100 μM), the number of lipid droplets increased over time (1 h, 24 h and 48 h) (Fig. 7B–D). A significant increase in green fluorescence also accompanies this. This demonstrates the buildup of LDs and the efficiency of M1 in LD targeting in live cells. Notably, when the cells are starved, they exert survival pressure and activate mechanisms such as autophagy to generate energy from LDs.44,46 Continuous nutrient deprivation causes the cells to deplete the newly formed lipid droplets for energy, reducing their number (Fig. 7E). As shown in Fig. 8, first the fluorescence of M1 increased considerably till 48 h, indicating generation of LDs in response to nutritional stress. Second, after 72 h, M1 intensity was lost compared to the previous time points, indicating that the LDs' energy reserves had been transported. These unique changes in LDs are congruent with current research into the mechanism of LD catabolism, notably starvation-induced “lipophagy”. Thus, it was observed that under starvation, cells breakdown lipid droplets via lipophagy to meet their energy needs. However, adding oleic acid restores lipid droplets, which can be consumed again if the food shortage continues. This cycle highlights the dynamic significance of lipid droplets in cellular energy homeostasis during stressful situations.
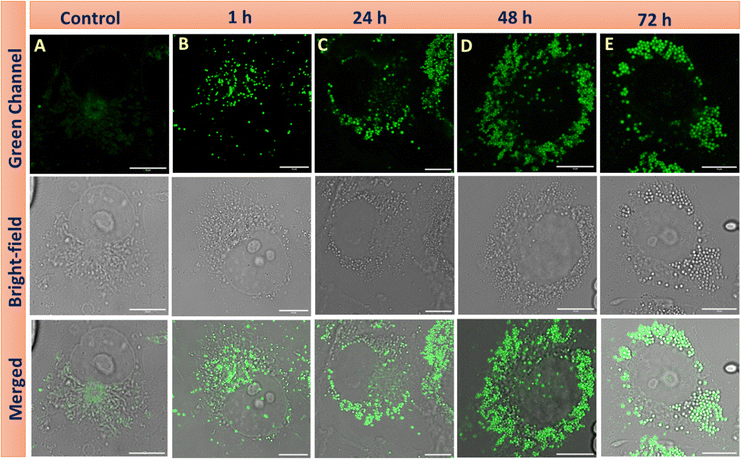 |
| | Fig. 7 Confocal images of live COS-7 cells upon incubation of M1 (2.5 μM) under starvation conditions for 18 h (B)–(E) are confocal images of M1 after the addition of the oleic acid (100 μM) at different time intervals under starvation conditions. λex: 458 nm, λem = 460–560 nm. Scale bar = 10 μm. | |
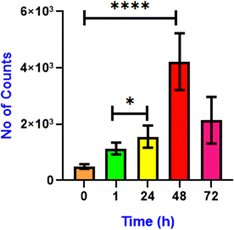 |
| | Fig. 8 Quantification of the number of lipid droplets after addition of oleic acid at 0 min (control), 1 h, 24 h, 48 h and 72 h. (n = 10, error bars represent SD. 0.05 > p*, 0.0005 > p****). Data analysis was done using GraphPad Prism 8.0.2 software. | |
Monitoring lipophagy
Lipophagy is a specific autophagy process which plays a significant role in cellular metabolism and homeostasis.47 Dysregulation of lipophagy causes metabolic diseases such as obesity, type-2 diabetes, fatty liver disease and other disorders involving lipid degradation.48–50 During lipophagy, the lipid droplets are transported to lysosomes, the digestive organelles,51 where the lysosomal enzymes convert lipids to short fatty acids. We monitored this real-time lipophagy process using M1 and Lysotracker Deep Red in COS-7 cells. Initially, we noted that the COS-7 cells have a lower lipid droplet count. The cells were thus pre-treated with 100 μM oleic acid for 12 h to generate lipid droplets. Adding verapamil (50 μM), a calcium channel blocker52,53 induced lipophagy. M1 in the green channel and LysoTracker Deep Red in the red channel without the added verapamil were used as control (Fig. 9A). The images captured at various intervals are shown in Fig. 9B–E. It was observed that there is no overlapping with lipid droplets and lysosomes in the control, suggesting no lipophagy. On the other hand, lysosome colocalization gets elevated upon treatment with verapamil, an autophagy inducer; the colocalization coefficient is 1.9, which was more than that of the control group (and 17.2 times more than 0 min), which indicates the link between lysosomes and lipid droplets. Thus, we could speculate that the lysosomes may have taken up damaged lipid droplets (Fig. 10A). Further, alteration in the lysosomal size is also noted. Initially, the average size of lysosomes was 0.4 μm, and with time, they increased to 1.15 μm. The count of lipid droplets decreased, indicating that damaged lipid droplets were engulfed by the lysosomes (Fig. 10B). It is also worth noting that the lipophagy process was monitored using Nile Red, showing 2.1 times increase in the PCC value from 0 min to 120 min after adding Verapamil (Fig. S13, ESI†).
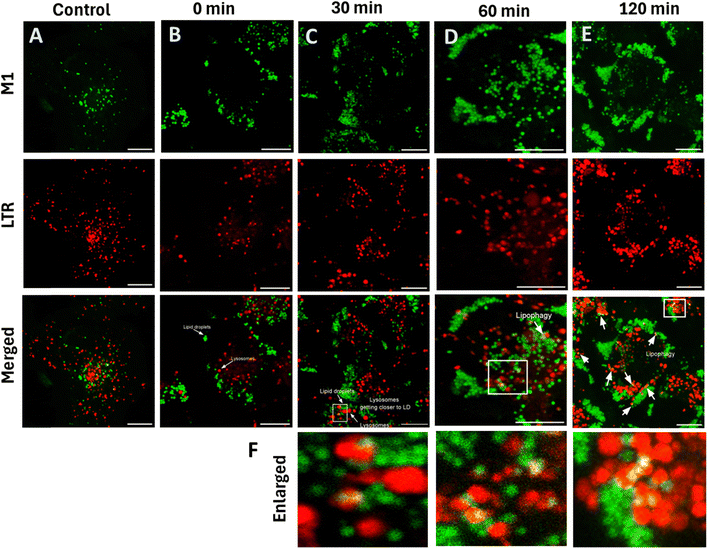 |
| | Fig. 9 Demonstration of M1 in monitoring the lipophagy process. (A) Confocal images of COS 7 cells stained with M1 (2.5 μM) and LTR (20 nM) incubated for 10 min at 37 °C; (B)–(E) cells were incubated with 50 μM verapamil for 4 h, which induces the lipophagy. Adding M1 and LTR allows us to track the lipophagy at different intervals. (F) Enlarged images of the verapamil group for respective time; M1: λex: 458 nm, λem: 480–600 nm; LTR, λex – 633 nm, λem – 650–700 nm; scale bar = 10 μm. | |
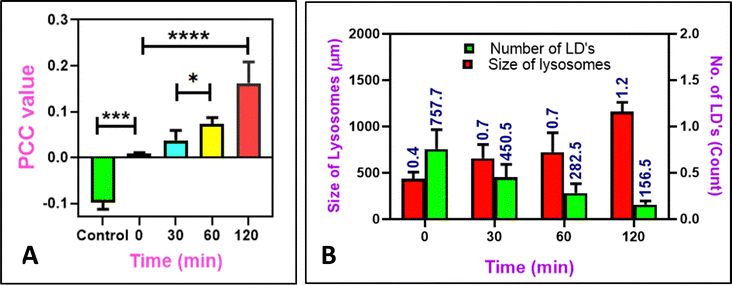 |
| | Fig. 10 (A) The colocalization coefficients of different intervals from Fig. 7 reveal the change in the PCC value of lysosomal uptake of M1 after the lipophagy process. (B) Quantifying the number of LD and the size of lysosomes after lipophagy at different intervals. (n = 10, error bars represent SD. 0.05 > p*, 0.005 > p**, 0.0005 > p****). Data analysis was done using GraphPad Prism 8.0.2 software. | |
LD–Mito interaction: cellular energy management and metabolic homeostasis under stress.
Mitochondria produce ATP by oxidative phosphorylation, whereas lipid droplets (LDs) primarily contain neutral lipids that are degraded into short-chain fatty acids. Mitochondria use the fatty acids from LDs for β-oxidation to generate energy during stress.54 However, reactive oxygen species (ROS), can cause apoptosis by lowering the mitochondrial membrane potential.55 As shown in Fig. 11, in the cells without the added H2O2, MTR specifically stains the mitochondria as visualized by the intact thread-like morphology. Addition of H2O2, causes oxidative stress56 resulting in mitophagy, disturbing the mitochondrial morphology and making them globular (Fig. 11E–H). The morphological changes are attributed to the loss of the mitochondrial membrane potential (MMP).57 However, during this process, LDs continue to remain and further the mitochondrial dysfunction contributes to the generation of the lipid droplets as a protective measure.55,58 To monitor this, the COS-7 cells were incubated with H2O2, and added M1 and MTR. It is observed that after the addition of H2O2, the fluorescence intensity of mitochondria decreases by 2.2 folds (Fig. 11B–F), and the intensity of lipid droplets rises to 3.9 folds (Fig. 11A–E and Fig. 12A). Further, the increase in the size and number of lipid droplets is also noted (Fig. 12B and C). Based on these results, we can conclude that the fluorophores such as M1 can be utilized to study dynamic connections between sub-cellular organelles, where the dysfunction of one organelle can directly influence the behaviour of the other. We also investigated the mitophagy process using Nile Red and Mito Tracker Deep Red, showing similar accumulation of damaged mitochondria around the lipid droplets (Fig. S14, ESI†). The findings suggest that M1 can substitute Nile Red for biological purposes, such as detecting lipid droplets and mitochondrial breakdown mechanisms.
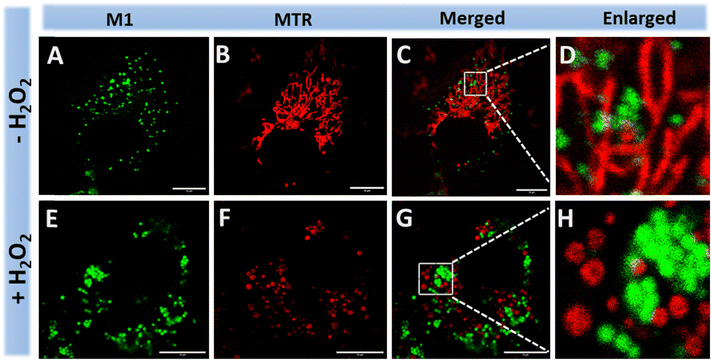 |
| | Fig. 11 Mitophagy is activated by oxidative stress and transports stressed mitochondria to lipid droplets, where they may be utilized for energy. (A)–(C) Cellular imaging and colocalization of M1 and MTR in COS-7 cells before addition of H2O2; (E)–(G) COS-7 cells are incubated for with 10 mM H2O2, followed by cellular imaging with M1 and MTR after mitophagy; (D) and (H) are the enlarged image of small section highlighted in the figure (C) and (G) respectively; M1: λex: 458 nm, λem: 485–600 nm; LysoTracker Red: λex – 633 nm, λem – 650–700 nm; scale bar = 10 μm. | |
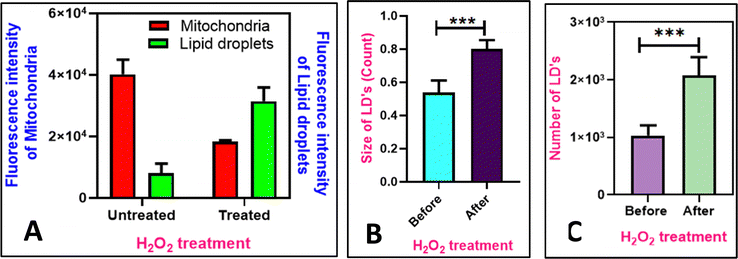 |
| | Fig. 12 (A) Quantification of intensity of mitochondria and lipid droplets before and after mitophagy (addition of 10 mM of H2O2); (B) quantification of size of LD's before and after mitophagy; (C) quantification of number of lipid droplets before and after addition of H2O2 (n = 15, error bars represent SD. 0.05 > p***). Data analysis was done using GraphPad Prism 8.0.2 software. | |
Conclusions
In conclusion, by utilizing donor–acceptor chalcones, we demonstrate excellent staining of the lipid droplets. Using M1, we effectively monitored the autophagic breakdown of lipid droplets, known as lipophagy, in living COS-7 cells. Our study revealed that lysosomes successfully engulfed the degraded lipid droplets after verapamil administration. Furthermore, M1 demonstrated the interaction between lipid droplets and mitochondria, highlighting their role in maintaining cellular energy balance under stress conditions. This underscores the critical importance of lipophagy in cellular metabolism and homeostasis, shedding light on the mechanisms underlying metabolic disorders caused by lipophagy dysregulation. The molecules therefore can be of great utility towards the investigation of lipid metabolism and related physiological processes.
Data availability
The data used for our study (eg. absorption, fluorescence, cellular imaging) will be made available upon request.
Conflicts of interest
There are no conflicts to declare.
Acknowledgements
SK acknowledges research funding from SERB (CRG/2022/007048). MG acknowledges the SERB (CRG/2022/007048) and IIT Gandhinagar for the research fellowship.
References
- J. A. Olzmann and P. Carvalho, Nat. Rev. Mol. Cell Biol., 2019, 20, 137–155 CrossRef CAS.
- A. R. Thiam, R. V. Farese Jr and T. C. Walther, Nat. Rev. Mol. Cell Biol., 2013, 14, 775–786 CrossRef CAS PubMed.
- Y. Jin, Y. Tan, J. Wu and Z. Ren, Cell Death Discovery, 2023, 9, 254 CrossRef CAS.
- Y. Zhao, W. Shi, X. Li and H. Ma, Chem. Commun., 2022, 58, 1495–1509 RSC.
- C. Zhuang, W. Zhang, C. Sheng, W. Zhang, C. Xing and Z. Miao, Chem. Rev., 2017, 117, 7762–7810 CrossRef CAS PubMed.
- M. A. Shalaby, S. A. Rizk and A. M. Fahim, Org. Biomol. Chem., 2023, 21, 5317–5346 RSC.
- C.-Q. Li, J.-H. Shi, J. Mu, A.-Q. Wang, L.-W. Zou and G.-B. Ge, J. Nat. Prod., 2023, 86, 1824–1831 CrossRef CAS.
- C. J. Trabbic, H. M. Dietsch, E. M. Alexander, P. I. Nagy, M. W. Robinson, J. H. Overmeyer, W. A. Maltese and P. W. Erhardt, ACS Med. Chem. Lett., 2014, 5, 73–77 CrossRef CAS.
- Z. Jiang, Y. Zhang, C. Du, A. Khan, R. Usman and M. Wang, Crystal Growth Design, 2024, 24, 6036–6050 CrossRef CAS.
- B. S. Al-Saadi, A. R. Ibrahim, J. Husband, A. H. Ismail, Y. Baqi and O. K. Abou-Zied, Phys. Chem. Chem. Phys., 2024, 26, 12844–12851 RSC.
- V. Pina, R. da Costa Duarte, C. Vesga-Hernández, R. dos Santos Carvalho, D. G. Melo, M. J. Pedrozo-Penãfiel, A. R. J. Barreto, A. M. dos Santos, A. G. Dal-Bó, R. Q. Aucélio, M. Cremona and J. Limberger, Opt. Mater., 2024, 149, 115039 CrossRef CAS.
- R. E. Johnson, M. T. Murray, D. J. Roby, L. J. Bycraft, Z. R. Churcher, S. Yadav, P. E. Johnson, S. D. Wetmore and R. A. Manderville, ACS Sens., 2023, 8, 4756–4764 CrossRef CAS PubMed.
- L. J. Gomes, T. Moreira, L. Rodriguez and A. J. Moro, Dyes Pigm., 2022, 197, 109845 CrossRef CAS.
- S. Erdemir, S. Malkondu and M. Oguz, Chem. Eng. J., 2023, 468, 143767 CrossRef CAS.
- M. Xing, Y. Han, Y. Zhu, Y. Sun, Y. Shan, K.-N. Wang, Q. Liu, B. Dong, D. Cao and W. Lin, Anal. Chem., 2022, 94, 12836–12844 CrossRef CAS.
- M. Fu, K. Wang, J. Xue, Y. Li, M. Bian and Q. Zhu, Org. Biomol. Chem., 2022, 20, 3359–3364 RSC.
- S. Yang, X. Liu, S. Wang, J. Song, J. Wu, B. Shen, H. Jia, S. Guo, Y. Wang, Y. Yang, Y. Jiang, H. Yang and J. Chang, Sens. Actuators, B, 2023, 395, 134514 CrossRef CAS.
- H. Cong, X. Zhao, B. T. Castle, E. J. Pomeroy, B. Zhou, J. Lee, Y. Wang, T. Bian, Z. Miao, W. Zhang, Y. Y. Sham, D. J. Odde, C. E. Eckfeldt, C. Xing and C. Zhuang, Mol. Pharm., 2018, 15, 3892–3900 CrossRef CAS PubMed.
- P. Kumar, R. Singh, D. Sharma, Q. P. Hassan, B. Gopu and J. M. H. Anal, Bioorg. Med. Chem. Lett., 2024, 107, 129795 CrossRef CAS PubMed.
- C. Parthiban, R. Manivannan and Y.-A. Son, J. Photochem. Photobiol., A, 2022, 423, 113579 CrossRef CAS.
- Y. Hu, H. Luo, L. Zhao, X. Guo, S. Wang, R. Hu and G. Yang, Org. Biomol. Chem., 2024, 22, 1850–1858 RSC.
- R. Tang, C. Wang, X. Zhou, M. Feng, Z. Li, Y. Wang and G. Chen, Spectrochim. Acta, Part A, 2023, 300, 122870 CrossRef CAS.
- N. Lin, X. Wu, Z. Cai, J. Shi, B. Tong and Y. Dong, Dyes Pigm., 2022, 199, 110091 CrossRef CAS.
- J. Dong, Y. Wang, C. Fan, Y. Tu and S. Pu, Dyes Pigm., 2023, 210, 110994 CrossRef CAS.
- C. Wang, R. Yuan, S. Ma, Q. Miao, X. Zhao, Y. Liu, S. Bi and G. Chen, Analyst, 2024, 149, 3372–3379 RSC.
- L. Zhang, J.-L. Yan, W.-N. Wu, X.-L. Zhao, Y. Wang, Y.-C. Fan and Z.-H. Xu, Microchem. J., 2022, 183, 107941 CrossRef CAS.
- L. Zhang, J.-L. Yan, Y. Wang, X.-L. Zhao, W.-N. Wu, Y.-C. Fan, Z.-H. Xu and L.-L. Yan, Spectrochim. Acta, Part A, 2022, 278, 121329 CrossRef CAS PubMed.
- C. Wang, T. Wang, M. Zhao, F. Dai, Z. Niu, W. Zhang and Y. Ma, Dyes Pigm., 2021, 194, 109593 CrossRef CAS.
- E. Colucci-Guyon, A. S. Batista, S. D. S. Oliveira, M. Blaud, I. C. Bellettini, B. S. Marteyn, K. Leblanc, P. Herbomel and R. Duval, Chem. Sci., 2019, 10, 3654–3670 RSC.
- A. S. Batista, S. D. S. Oliveira, S. Pomel, P.-H. Commere, V. Mazan, M. Lee, P. M. Loiseau, B. Rossi-Bergmann, E. Prina and R. Duval, Biomed. Pharm., 2022, 149, 112784 CrossRef CAS.
- A. K. Singh, R. Mengji, A. V. Nair, S. S. Shah, J. Avijit and N. D. P. Singh, ACS Appl. Bio Mater., 2023, 6, 4372–4382 CrossRef CAS.
- A. M. Brouwer, Pure Appl. Chem., 2011, 83, 2213–2228 CrossRef CAS.
- C. Yan, Z. Zhu, Y. Yao, Q. Wang, Z. Guo and W.-H. Zhu, Acc. Mater. Res., 2024, 5, 64–75 CrossRef CAS.
- J. P. Tillotson, G. Bogdanov, E. V. Jucov, V. N. Khrustalev, S. Rigin, J. M. Hales, J. W. Perry and T. V. Timofeeva, J. Mol. Struct., 2019, 1189, 146–154 CrossRef CAS.
- I. Yahaya, N. Seferoğlu and Z. Seferoğlu, Tetrahedron, 2019, 75, 2143–2154 CrossRef CAS.
- H. Chen, L. Liu, K. Qian, H. Liu, Z. Wang, F. Gao, C. Qu, W. Dai, D. Lin, K. Chen, H. Liu and Z. Cheng, Sci. Adv., 2022, 8(32), eabo3289 CrossRef CAS PubMed.
- M. J. Frisch, G. W. Trucks, H. B. Schlegel, G. E. Scuseria, M. A. Robb, J. R. Cheeseman, G. Scalmani, V. Barone, G. A. Petersson, H. Nakatsuji, X. Li, M. Caricato, A. V. Marenich, J. Bloino, B. G. Janesko, R. Gomperts, B. Mennucci, H. P. Hratchian, J. V. Ortiz, A. F. Izmaylov, J. L. Sonnenberg, D. Williams-Young, F. Ding, F. Lipparini, F. Egidi, J. Goings, B. Peng, A. Petrone, T. Henderson, D. Ranasinghe, V. G. Zakrzewski, J. Gao, N. Rega, G. Zheng, W. Liang, M. Hada, M. Ehara, K. Toyota, R. Fukuda, J. Hasegawa, M. Ishida, T. Nakajima, Y. Honda, O. Kitao, H. Nakai, T. Vreven, K. Throssell, J. A. Montgomery Jr., J. E. Peralta, F. Ogliaro, M. J. Bearpark, J. J. Heyd, E. N. Brothers, K. N. Kudin, V. N. Staroverov, T. A. Keith, R. Kobayashi, J. Normand, K. Raghavachari, A. P. Rendell, J. C. Burant, S. S. Iyengar, J. Tomasi, M. Cossi, J. M. Millam, M. Klene, C. Adamo, R. Cammi, J. W. Ochterski, R. L. Martin, K. Morokuma, O. Farkas, J. B. Foresman and D. J. Fox, Gaussian Inc, 2016 Search PubMed.
- N. M. O'Boyle, A. L. Tenderholt and K. M. Langner, J. Comput. Chem., 2008, 29, 839–845 CrossRef PubMed.
- M. Paramasivam, R. K. Chitumalla, S. P. Singh, A. Islam, L. Han, V. Jayathirtha Rao and K. Bhanuprakash, J. Phys. Chem. C, 2015, 119, 17053–17064 CrossRef CAS.
- M. Paramasivam and S. Kanvah, J. Phys. Chem. C, 2016, 120, 10757–10769 CrossRef CAS.
- H. Liu, G. Jiang, G. Ke, T.-B. Ren and L. Yuan, ChemPhotoChem, 2024, 8, e202300277 CrossRef CAS.
- T. C. Walther and R. V. Farese, Jr., Ann. Rev. Biochem., 2012, 81, 687–714 CrossRef CAS PubMed.
- T. B. Nguyen and J. A. Olzmann, Autophagy, 2017, 13, 2002–2003 CrossRef CAS.
- A. S. Rambold, S. Cohen and J. Lippincott-Schwartz, Dev. Cell, 2015, 32, 678–692 CrossRef CAS.
- H. B. Castillo, S. O. Shuster, L. H. Tarekegn and C. M. Davis, Chem. Commun., 2024, 60, 3138–3141 RSC.
- W. M. Henne, M. L. Reese and J. M. Goodman, EMBO J., 2018, 37, e98947 CrossRef PubMed.
- D. W. Shin, Mol. Cells, 2020, 43, 686–693 CAS.
- S. Zhang, X. Peng, S. Yang, X. Li, M. Huang, S. Wei, J. Liu, G. He, H. Zheng, L. Yang, H. Li and Q. Fan, Cell Death Dis., 2022, 13, 132 CrossRef CAS PubMed.
- C. He and D. J. Klionsky, Ann. Rev. Genet., 2009, 43, 67–93 CrossRef CAS.
- M. B. Khawar, M. H. Abbasi, M. Rafiq, N. Naz, R. Mehmood and N. Sheikh, Oxid. Med. Cell. Longevity, 2021, 2021, 5539161 CrossRef PubMed.
- C. Settembre and R. M. Perera, Nat. Rev. Mol. Cell Biol., 2024, 25, 223–245 CrossRef CAS.
- H.-W. Park, H. Park, I. A. Semple, I. Jang, S.-H. Ro, M. Kim, V. A. Cazares, E. L. Stuenkel, J.-J. Kim, J. S. Kim and J. H. Lee, Nat. Commun., 2014, 5, 4834 CrossRef CAS.
- H. Zhang, L. Shi, K. Li, X. Liu, M. Won, Y.-Z. Liu, Y. Choe, X.-Y. Liu, Y.-H. Liu, S.-Y. Chen, K.-K. Yu, J. S. Kim and X.-Q. Yu, Angew. Chem., Int. Ed., 2022, 61, e202116439 CrossRef.
- N. K. Talari, U. Mattam, N. K. Meher, A. K. Paripati, K. Mahadev, T. Krishnamoorthy and N. B. V. Sepuri, Nat. Commun., 2023, 14, 766 CrossRef CAS PubMed.
- S.-J. Lee, J. Zhang, A. M. K. Choi and H. P. Kim, Oxid. Med. Cell. Longevity, 2013, 2013, 327167 Search PubMed.
- H. U. Simon, A. Haj-Yehia and F. Levi-Schaffer, Apoptosis, 2000, 5, 415–418 CrossRef CAS.
- J. D. Ly, D. R. Grubb and A. Lawen, Apoptosis, 2003, 8, 115–128 CrossRef CAS PubMed.
- Y. Zong, H. Li, P. Liao, L. Chen, Y. Pan, Y. Zheng, C. Zhang, D. Liu, M. Zheng and J. Gao, Signal Transduction Targeted Ther., 2024, 9, 124 CrossRef PubMed.
|
| This journal is © The Royal Society of Chemistry 2025 |
Click here to see how this site uses Cookies. View our privacy policy here.  b and
Sriram Kanvah
 *a
*a

![[thin space (1/6-em)]](https://www.rsc.org/images/entities/char_2009.gif) 000 cells per mL (cell density: 6000 cells per well) and incubated for 24 h. After a 24 h incubation, the cells were treated with different concentrations (0.50 μM, 1 μM, 2 μM, 4 μM and 8 μM). Separately, the cells treated with DMEM were taken as control. Then, 96 well plates were incubated at 37 °C for 48 h. At the end of the treatment, 100 μL of MTT solution of concentration 0.5 mg mL−1 was added to each well, and the solution, along with cells, was further incubated for 4 h at 37 °C. After incubation, allowing the dissolution of the formazan crystals formed, 65 μL DMSO was added and shaken for 10 minutes, followed by measurement of the colour intensity using a plate reader at 570 nm. All the experiments were performed six times, and the cell viability (%) was calculated using origin.
000 cells per mL (cell density: 6000 cells per well) and incubated for 24 h. After a 24 h incubation, the cells were treated with different concentrations (0.50 μM, 1 μM, 2 μM, 4 μM and 8 μM). Separately, the cells treated with DMEM were taken as control. Then, 96 well plates were incubated at 37 °C for 48 h. At the end of the treatment, 100 μL of MTT solution of concentration 0.5 mg mL−1 was added to each well, and the solution, along with cells, was further incubated for 4 h at 37 °C. After incubation, allowing the dissolution of the formazan crystals formed, 65 μL DMSO was added and shaken for 10 minutes, followed by measurement of the colour intensity using a plate reader at 570 nm. All the experiments were performed six times, and the cell viability (%) was calculated using origin.


![[double bond, length as m-dash]](https://www.rsc.org/images/entities/char_e001.gif) O functionality in M3, facilitated HOMO delocalization from −5.25 to −5.03 eV, contributing to significant band gap narrowing. In contrast, π → π* transitions dominate in M1 and M2. Additionally, a strong intramolecular H-contact (2.163 Å) between the α-hydrogen of the conjugated dienes and the C
O functionality in M3, facilitated HOMO delocalization from −5.25 to −5.03 eV, contributing to significant band gap narrowing. In contrast, π → π* transitions dominate in M1 and M2. Additionally, a strong intramolecular H-contact (2.163 Å) between the α-hydrogen of the conjugated dienes and the C![[double bond, length as m-dash]](https://www.rsc.org/images/entities/char_e001.gif) O group of coumarin in M3 promotes planarization and stabilizes the molecular framework (Fig. S4, ESI†). As a result, the LUMO energy of M3 is significantly lowered (−2.71 eV), making it the compound with the smallest band gap in the series. For all chalcone derivatives, the electron density in the HOMO is primarily localized on the donor and spacer units while shifting toward the acceptor unit in the LUMO. However, the electron density distribution on the acceptor segment varies depending on the electron-deficient nature of each acceptor. To obtain an accurate representation of electron density distribution across the acceptor units, DOS and PDOS analyses were conducted, dividing the molecular framework into three segments: donor, π-spacer, and acceptor (Fig. S5–S7, ESI†). The HOMO electron density remains nearly constant for M1 (61%) and M3 (59%), while the extended π-conjugation in M2's triene segment results in higher electron density (44%). In contrast, the LUMO distribution differs significantly across the chalcone derivatives. For example, the naphthalene acceptor segment in M1 bears a substantial portion of the LUMO electron density (43%). However, the increased π-conjugation in M2 reduces acceptor electron density to 34%. In M3, the coumarin segment shows a markedly high LUMO electron density (71%), underscoring the strong acceptor nature of the keto-functionalized coumarin unit (Fig. 5B). Consequently, M3 exhibits a greater extent of intramolecular charge transfer (ICT) transitions. This finding is further supported by molecular electrostatic potential (ESP) plots, which reveal a pronounced negative electrostatic region around the acceptor segment in M3, primarily due to the keto group and O–C
O group of coumarin in M3 promotes planarization and stabilizes the molecular framework (Fig. S4, ESI†). As a result, the LUMO energy of M3 is significantly lowered (−2.71 eV), making it the compound with the smallest band gap in the series. For all chalcone derivatives, the electron density in the HOMO is primarily localized on the donor and spacer units while shifting toward the acceptor unit in the LUMO. However, the electron density distribution on the acceptor segment varies depending on the electron-deficient nature of each acceptor. To obtain an accurate representation of electron density distribution across the acceptor units, DOS and PDOS analyses were conducted, dividing the molecular framework into three segments: donor, π-spacer, and acceptor (Fig. S5–S7, ESI†). The HOMO electron density remains nearly constant for M1 (61%) and M3 (59%), while the extended π-conjugation in M2's triene segment results in higher electron density (44%). In contrast, the LUMO distribution differs significantly across the chalcone derivatives. For example, the naphthalene acceptor segment in M1 bears a substantial portion of the LUMO electron density (43%). However, the increased π-conjugation in M2 reduces acceptor electron density to 34%. In M3, the coumarin segment shows a markedly high LUMO electron density (71%), underscoring the strong acceptor nature of the keto-functionalized coumarin unit (Fig. 5B). Consequently, M3 exhibits a greater extent of intramolecular charge transfer (ICT) transitions. This finding is further supported by molecular electrostatic potential (ESP) plots, which reveal a pronounced negative electrostatic region around the acceptor segment in M3, primarily due to the keto group and O–C![[double bond, length as m-dash]](https://www.rsc.org/images/entities/char_e001.gif) O functionality of coumarin. Additionally, total charge density increases notably from 2.96 to 3.44 × 10⁻² esu. In contrast, the negative electrostatic environment in M1 and M2 is localized only in the keto group. Mulliken population analysis of the chalcone derivatives shows a trend consistent with the ESP plots (Fig. S7, ESI†). The molecular geometry coordinates showing the bond length variations are shown in Fig. S8, ESI†). The dipole moments in the transient excited state (μe) for M1 and M2 are significantly higher than those in the ground state (μg). This larger μe suggests considerable structural relaxation in the excited state, aligning well with the experimental trend of positive solvatochromism (Table 2). However, M3 shows only a slight enhancement in dipole moment. The substantial dipole moment variation in M1 and M2 promotes pronounced structural shifts through interactions with solvent dipoles, resulting in a large Stokes shift.40 The rigidity enabled by the increased number of intramolecular contacts reduced the Stokes shift for M3. Extensive TDDFT simulations were conducted using a series of density functionals, including B3LYP, M062X, and PBE0, with a 6-311G(d,p) basis set and C-PCM (acetonitrile) solvation model (Fig. 5A). While B3LYP simulated absorption showed significant overestimation and deviated from the experimental trend, PBE0, despite some underestimation, followed the experimental trend more closely. Remarkably, M062X provided an excellent match with experimental absorption, offering highly accurate predictions. For M1 and M2, the primary transition upon photoexcitation is from HOMO to LUMO (91%). In M3, however, the extensive π-delocalization is somewhat reduced due to the replacement of the naphthalene unit with coumarin, decreasing the HOMO to LUMO transition to 78%, with additional contributions from HOMO−1 and LUMO+1 energy levels.
O functionality of coumarin. Additionally, total charge density increases notably from 2.96 to 3.44 × 10⁻² esu. In contrast, the negative electrostatic environment in M1 and M2 is localized only in the keto group. Mulliken population analysis of the chalcone derivatives shows a trend consistent with the ESP plots (Fig. S7, ESI†). The molecular geometry coordinates showing the bond length variations are shown in Fig. S8, ESI†). The dipole moments in the transient excited state (μe) for M1 and M2 are significantly higher than those in the ground state (μg). This larger μe suggests considerable structural relaxation in the excited state, aligning well with the experimental trend of positive solvatochromism (Table 2). However, M3 shows only a slight enhancement in dipole moment. The substantial dipole moment variation in M1 and M2 promotes pronounced structural shifts through interactions with solvent dipoles, resulting in a large Stokes shift.40 The rigidity enabled by the increased number of intramolecular contacts reduced the Stokes shift for M3. Extensive TDDFT simulations were conducted using a series of density functionals, including B3LYP, M062X, and PBE0, with a 6-311G(d,p) basis set and C-PCM (acetonitrile) solvation model (Fig. 5A). While B3LYP simulated absorption showed significant overestimation and deviated from the experimental trend, PBE0, despite some underestimation, followed the experimental trend more closely. Remarkably, M062X provided an excellent match with experimental absorption, offering highly accurate predictions. For M1 and M2, the primary transition upon photoexcitation is from HOMO to LUMO (91%). In M3, however, the extensive π-delocalization is somewhat reduced due to the replacement of the naphthalene unit with coumarin, decreasing the HOMO to LUMO transition to 78%, with additional contributions from HOMO−1 and LUMO+1 energy levels.


