 Open Access Article
Rational design of NiMoO4/carbon nanocomposites for high-performance supercapacitors: an in situ carbon incorporation approach†
Raji
Yuvaraja
 a,
Sankar
Sarathkumar
 a,
Venkatesan
Gowsalya
 a,
Sorna Pandian
Anitha Juliet
 a,
Selvakumar
Veeralakshmi
 b,
Siva
Kalaiselvam
 b,
Gunniya Hariyanandam
Gunasekar
 cd and
Selvan
Nehru
 *a
*a
aDepartment of Physical Chemistry, University of Madras, Guindy Campus, Chennai – 600025, Tamil Nadu, India. E-mail: nehruchem@gmail.com
bCentre for Industrial Safety, Anna University, Chennai – 600025, Tamil Nadu, India
cDepartment of Catalysis and Fine Chemicals, CSIR-Indian Institute of Chemical Technology, Hyderabad-500007, India
dCSIR-Academy of Scientific and Innovative Research (CSIR-AcSIR), Ghaziabad-201002, India
First published on 8th November 2024
Abstract
Understanding the impact of different compositions of nanocomposites synthesized via in situ incorporation of different ratios of carbon with metal oxides is an important factor for designing efficient electrode materials for high-performance supercapacitors. Here, a series of nanomaterials, NiMoO4, carbonaceous nanospheres (CNSs), and NiMoO4/C nanocomposites (NiMoO4/C (Dx), where, x = 10, 25, 50, and 75 represents the molar ratio of dextrose (D) to Ni2+), have been synthesized via an in situ hydrothermal method. The structural and surface analysis revealed the efficient integration of NiMoO4 and carbon in the NiMoO4/C (D50) nanocomposite, consisting of 71.1% NiMoO4 and 28.9% carbon components. The nanocomposite features a graphitic carbon sheet-like structure embedded with NiMoO4 nanorods, showing increased defects with higher carbon content and enhanced surface area with larger mesoporosity. In three-electrode supercapacitor studies for these electrode materials using 3 M KOH as the electrolyte, the NiMoO4/C (D50)-based electrode delivered superior specific capacitance (940 F g−1) at a current density of 1 A g−1 compared to bare NiMoO4 (520 F g−1), CNS (75 F g−1) and NiMoO4/C (D10, D25 and D75) nanocomposites (436–583 F g−1), with 71% capacity retention up to 5000 cycles. Furthermore, for the fabricated NiMoO4/C (D50)-based two-electrode supercapacitors at 1 A g−1 using 3 M KOH, the symmetric configuration delivered a doubled specific capacitance (83 F g−1), while the asymmetric configuration led to a doubled performance in both energy density (14.2 W h kg−1) and power density (444 W kg−1), in comparison to each other. The enhanced supercapacitor performance of NiMoO4/C (D50) can be attributed to the synergistic effect between carbon and NiMoO4 in the optimized nanocomposites, which improves the electrolyte-philicity by altering the surface composition and properties, leading to more electroactive sites and increased charge storage capacity. Thus, designing new electrode materials via in situ hydrothermal synthesis of different metal oxide/C nanocomposites with optimal composition and choosing different carbon source materials will deliver high-performance supercapacitors in the near future.
1. Introduction
Supercapacitors (SCs) stand out among energy storage technologies due to their exceptional combination of rapid charge–discharge capabilities, outstanding cycling stability, inherent safety, and high power density.1,2 Despite these advantages, their widespread applications are constrained by relatively lower energy density. To overcome this limitation, integrating hybrid nanocomposite materials consisting of pseudocapacitive metal oxides and capacitive carbon materials has emerged as a promising approach to achieve high energy density supercapacitors.3,4 Among the different approaches, the in situ hydrothermal incorporation of carbon with metal oxides is particularly effective for tailoring electrode materials to surpassingly enhance their charge storage performance.5,6 However, comprehensive reports on this specific approach for supercapacitors remain scarce in the existing literature.Among various bimetallic oxides, nickel molybdate (NiMoO4) emerges as a capable electrode material for SC owing to its key advantages, such as high specific capacitance accelerated by multiple redox states, enhanced electrical properties, reliable cyclability and moderate cost.7 Notably, hydrothermal synthesis offers a versatile approach for producing NiMoO4 with controlled and uniform morphology, high purity, scalability, and environmental friendliness. Moreover, this method enables the formation of diverse nanostructures of NiMoO4 such as nanorods,8 nanospheres,9 nanosheets,10 nanowires,11 and nanoflowers,12 each of which can significantly influence the SC performance of the resulting material.
However, during charge–discharge cycles, pristine NiMoO4 undergoes volume expansion and structural degradation, leading to a decline in performance over time.13 To address this limitation, researchers have explored composite electrodes that combine NiMoO4 with carbonaceous nanomaterials. These materials offer several advantages, creating a synergistic effect that overcomes the inherent weaknesses of pristine NiMoO4.14 In particular, enhanced structural stability was offered by carbonaceous materials, including activated carbon, carbon fiber, graphene, carbon nanotubes, carbon aerogels, etc., forming a conductive network around the NiMoO4 particles. This network acts as a buffer, accommodating the volume changes experienced by NiMoO4 during cycling and mitigating structural degradation. This significantly improves the cycling stability and lifespan of the supercapacitor.15–18 Further, carbonaceous materials possess high surface areas, providing more sites for electrolyte interaction with the NiMoO4, leading to higher capacitance. Additionally, their inherent conductivity enhances the overall electrical conductivity of the composite electrode, facilitating faster charge and discharge rates.19 Several studies have demonstrated the effectiveness of this approach. For example, Muthu et al. reported that NiMoO4/reduced graphene oxide composites exhibit increased surface area, enhancing capacitance.20 Wei et al. synthesized carbon sphere@NiMoO4 nanocomposites, resulting in improved overall electrical conductivity and faster charge–discharge rates.21 Zhang et al. confirmed improved cycling stability and longer lifespan in NiMoO4/carbon composites.15 These findings highlight that the selection and optimization of NiMoO4/carbon nanocomposites is essential for achieving high-performance supercapacitors.
Conversely, traditional methods for synthesizing carbon nanomaterials like carbon nanotubes and graphene often require complex procedures and high temperatures, significantly increasing their cost.22,23 This high cost hinders their large-scale application in commercially viable supercapacitors. Hence, the potential of porous carbon derived from hydrothermal carbonization (HTC) as a cost-effective and sustainable alternative for supercapacitor electrodes has been explored. HTC utilizes readily available natural molecules such as sucrose, dextrose, and citric acid as carbon precursors.24 This low-temperature process offers a simpler and more environmentally friendly approach to producing porous carbon materials. Mo et al. prepared a porous NiCo2O4@amorphous carbon nanocomposite using sucrose as a carbon source, resulting in a high specific capacity of 1225 mA h g−1.25 Similarly, an enhanced supercapacitor performance (specific capacity of 586 mA h g−1) was reported by Zhang et al. in a NiO@carbon nanocomposite obtained from the blending of NiO with glucose-derived carbon.26 However, the composition of carbon in the nanocomposites has to be optimized for the resulting enhancement effect in energy storage.
In particular, in comparison to the traditional blending approach, the incorporation of porous carbon with metal oxides through an in situ hydrothermal carbonization approach offers several advantages for supercapacitor applications. For example, Wang et al. reported in situ synthesis of noble metals with carbon reaching a specific capacitance of 115 F g−1 through the development of a porous carbon structure within the composite electrode.27 Furthermore, Li et al. performed in situ synthesis of V2O3@C composites and achieved a specific capacitance of 205 F g−1 at 0.05 A g−1via the improved intimate contact between the metal oxide and the carbon, creating a more efficient pathway for electron transfer throughout the electrode.28 Ma et al. reported the in situ synthesis of a nitrogen-doped carbon framework with NiO nanoparticles, resulting in enhanced supercapacitor performance by providing more uniform particle size distribution, more active sites, smaller charge transfer resistance and higher ionic diffusion coefficient.29 However, in these kinds of in situ synthesis of metal oxide/carbon nanocomposites, a comprehensive report on the influence of carbon content on the supercapacitor performance is not well elucidated in the literature.
Hence, the present work aims to investigate the impact of carbon content in NiMoO4/carbon nanocomposites to be employed for supercapacitor applications. In particular, it focuses on (i) in situ hydrothermal synthesis of NiMoO4/carbon nanocomposites with different amounts of carbon incorporation using dextrose as the carbon source, (ii) comparison of two- and three-electrode SC performance in terms of energy density, power density, specific capacitance and cycling stability, and (iii) fabrication and testing symmetric supercapacitor devices to evaluate their practical energy storage capability.
2. Experimental
2.1. Materials and methods
All chemicals were of analytical grade and used as such without any purification. Nickel nitrate hexahydrate, ammonium molybdate tetrahydrate, urea, hexamine, dextrose, sodium lauryl sulfate (SLS), potassium hydroxide and N-methyl pyrrolidine (NMP) were obtained from Sisco Research Laboratories Pvt. Ltd acetylene black (AB) and polyvinylidene fluoride (PVDF) were purchased from Sigma-Aldrich. Polyvinyl alcohol (PVA, Mw = ∼115![[thin space (1/6-em)]](https://www.rsc.org/images/entities/char_2009.gif) 000) was received from Loba Chemie Pvt. Ltd. Deionized (DI) water was used throughout the studies. Before use, the nickel plate (99% purity, thickness: 0.5 mm), and stainless-steel sheets (SS-304, thickness: 0.1 mm) were polished with P220 emery paper for surface activation, then sequentially cleaned in 1 M HCl for 15 minutes and acetone for 30 minutes using ultrasonication to remove any surface residues.
000) was received from Loba Chemie Pvt. Ltd. Deionized (DI) water was used throughout the studies. Before use, the nickel plate (99% purity, thickness: 0.5 mm), and stainless-steel sheets (SS-304, thickness: 0.1 mm) were polished with P220 emery paper for surface activation, then sequentially cleaned in 1 M HCl for 15 minutes and acetone for 30 minutes using ultrasonication to remove any surface residues.
The same procedure was followed to synthesise different compositions of NiMoO4/C nanocomposites by varying the amount of dextrose as 25, 50 and 75 mmol. The prepared samples were labelled as NiMoO4/C (Dx), where x = 10, 25, 50 and 75, representing the molar ratio of dextrose/Ni2+.
2.2. Materials characterization
X-Ray diffraction (XRD) patterns of the samples were obtained using a Bruker D8 Advance X-ray diffractometer with Cu-Kα radiation as the X-ray source in the 2θ range of 10°–90°. Raman spectra of the samples were collected from a Horiba Raman spectrometer using a 532 nm laser source. Fourier transform infrared (FT-IR) spectroscopy was performed on a Bruker mid-IR spectrometer. The thermogravimetric analysis (TGA) of the samples was carried out using a TGA Q500 V20.13 Build 39 thermal analyzer in an air atmosphere from 30 to 700 °C with a heating rate of 10 °C min−1. Surface morphology and chemical elements of the samples were examined by a CARL ZEISS GEMINI 500 field emission scanning electron microscope (FE-SEM) coupled with energy dispersive X-ray spectroscopy (EDS). High-resolution transmission electron microscopy (HR-TEM) was performed on a FEI-TECNAI G2-20 TWIN microscope. BET surface area and BJH pore size distribution of the samples were obtained from the N2 adsorption–desorption isotherm technique using a BELSORP II (BEL Japan Inc.) instrument. X-Ray photoelectron spectroscopy (XPS) was carried out on a PHI 5000 Versa Probe III photoelectron spectrometer (ULVAC-PHI, Inc., Japan) equipped with a monochromatic Al Kα source (λ = 1486.7 eV). All electrochemical measurements were carried out using the K-Lyte 1.3 (PG-Lyte) electrochemical workstation (Kanopy Techno Solutions, India). Electrochemical impedance spectroscopy (EIS) measurements were performed using the CHI660E workstation in the frequency range of 0.1 Hz to 100 kHz with a potential amplitude of 10 mV.2.3. Electrochemical measurements
 | (1) |
For the symmetric configuration,
 | (2) |
 | (3) |
 | (4) |
For the asymmetric configuration,
 | (5) |
 | (6) |
 | (7) |
3. Results and discussion
3.1. Synthesis and characterization of NiMoO4/C nanocomposites
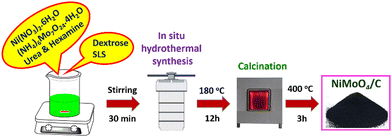
A typical in situ hydrothermal synthesis of NiMoO4/C nanocomposite is illustrated in Scheme 1. There are two parallel reactions, namely, (i) the formation of NiMoO4 by the combination of Ni2+ and MoO42− ions by the urea and hexamine, which can act as both an alkali source and shape-controlling agent, and (ii) the formation of CNS material by the hydrothermal carbonization of dextrose using SLS as a templating agent.24,31 By changing the molar ratio of dextrose, different amounts of carbon incorporated NiMoO4/C nanocomposites were prepared to investigate the impact of their compositions on the supercapacitor performance. Furthermore, this kind of in situ incorporation of carbon with metal oxides as well as the influence of their composition on supercapacitor performance is not clear in the literature.The X-ray diffraction method was used to study the structure and crystallinity of the electrode materials. Fig. 1(a)–(e) depicts typical XRD patterns of the synthesized CNS, NiMoO4, and NiMoO4/C (Dx) samples. A broad peak corresponding to the (002) plane in Fig. 1(a) demonstrates the existence of a graphitic-like nature in CNS.36 The XRD pattern in Fig. 1(b) matches the typical monoclinic structure of NiMoO4 (JCPDS No. 86-0361), showing the characteristic peaks at 2θ values of 12.9°, 23.3°, 25.7°, 27.3°, 28.9° 33.1°, 33.8°, 39.1°, 46.5°, 49.4°, 55.4°, 56.5°, and 64.7° with respect to (001), (021), (−202), (−221), (220), (−312), (112), (−132), (240), (312), (223), (332), and (600) planes.8,21 Furthermore, the formation of NiMoO4/C (Dx) nanocomposites can be confirmed from the observation of the characteristic diffraction pattern of NiMoO4 in Fig. 1(c)–(e). However, in Fig. 1(c)–(e), the (002) diffraction peak of carbon merges with the NiMoO4 peak at 24.8°, which may be due to the well-blended nature or suppression of carbon in the prepared nanocomposites.16,21
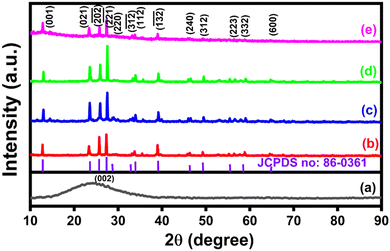 | ||
| Fig. 1 XRD patterns of (a) CNS, (b) NiMoO4, (c) NiMoO4/C (D25), (d) NiMoO4/C (D50) and (e) NiMoO4/C (D75). | ||
The Raman spectra of NiMoO4, CNS and NiMoO4/C-based nanocomposites are depicted in Fig. 2(a)–(e). The formation of NiMoO4 can be ascribed from the observation of bands at 384, 711, 825, 905, and 955 cm−1 (Fig. 2(a)) corresponding to the Mo–O bending, Ni–Mo–O symmetric stretching, Ni–O–Mo asymmetric stretching, Mo–O asymmetric stretching and Mo–O symmetric stretching modes, respectively.37,38 The Raman spectrum of CNS in Fig. 2(b) shows the characteristic D and G bands of carbon at 1356 cm−1 and 1572 cm−1 corresponding to the defects caused by the out-of-plane and in-plane vibrations in the graphitic structure, respectively.16 Furthermore, the characteristic peaks associated with NiMoO4 in the prepared nanocomposites Fig. 2(c)–(e) are masked due to the presence of higher carbon content. The obtained values of ID/IG ratio for CNS, NiMoO4/C (D25), NiMoO4/C (D50) and NiMoO4/C (D75) are 0.82, 0.60, 0.63, and 0.74, respectively. The noted increase in the ID/IG ratio of the NiMoO4/C nanocomposites with the increase in carbon content suggests an increase in the defects of the graphitic structure.39
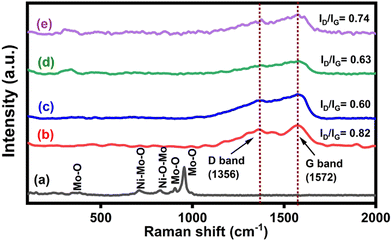 | ||
| Fig. 2 Raman spectra of (a) NiMoO4, (b) CNS, (c) NiMoO4/C (D25), (d) NiMoO4/C (D50) and (e) NiMoO4/C (D75). | ||
The FT-IR spectra of CNS, NiMoO4 and NiMoO4/C (D25, D50 and D75) in Fig. 3(a)–(e) were used to analyze their characteristic vibrational modes and chemical bonding environment. In Fig. 3(a), the FTIR spectrum of CNS exhibits characteristic peaks at 3675–3000 cm−1 (O–H stretching), 2925 cm−1 & 2850 cm−1 (C–H stretching), 1700 cm−1 (C![[double bond, length as m-dash]](https://www.rsc.org/images/entities/char_e001.gif) O stretching), 1612 cm−1 (C
O stretching), 1612 cm−1 (C![[double bond, length as m-dash]](https://www.rsc.org/images/entities/char_e001.gif) C stretching), 1470–1350 cm−1 (combination of O–C–H and C–O–H absorption bands), 1198 cm−1 (in-plane C–H and O–H deformation), 1190–970 cm−1 (C–O and C–C stretching) and 880–750 cm−1 (aromatic C–H out-of-plane bending), supporting the presence of carboxylic acid, carbonyl, olefin, and hydroxyl groups within the graphitic carbon structure of CNS.40–42 The spectrum of NiMoO4 in Fig. 3(b) displays an intense peak at 928 cm−1, corresponding to the symmetric stretching vibrations of Mo
C stretching), 1470–1350 cm−1 (combination of O–C–H and C–O–H absorption bands), 1198 cm−1 (in-plane C–H and O–H deformation), 1190–970 cm−1 (C–O and C–C stretching) and 880–750 cm−1 (aromatic C–H out-of-plane bending), supporting the presence of carboxylic acid, carbonyl, olefin, and hydroxyl groups within the graphitic carbon structure of CNS.40–42 The spectrum of NiMoO4 in Fig. 3(b) displays an intense peak at 928 cm−1, corresponding to the symmetric stretching vibrations of Mo![[double bond, length as m-dash]](https://www.rsc.org/images/entities/char_e001.gif) O bonds of the distorted MoO4 lattice. Additionally, sharp peaks at 397 and 582 cm−1 are attributed to Mo–O–Mo and Mo–O–Ni vibrations, respectively.43–45 Furthermore, the prepared NiMoO4/C (D25, D50 and D75) nanocomposites in Fig. 3(c)–(e) exhibit characteristic vibrations, with slight variations in intensity and position corresponding to the increase in carbon content, suggesting a noticeable interaction between NiMoO4 and carbon within the nanocomposite structure.46,47
O bonds of the distorted MoO4 lattice. Additionally, sharp peaks at 397 and 582 cm−1 are attributed to Mo–O–Mo and Mo–O–Ni vibrations, respectively.43–45 Furthermore, the prepared NiMoO4/C (D25, D50 and D75) nanocomposites in Fig. 3(c)–(e) exhibit characteristic vibrations, with slight variations in intensity and position corresponding to the increase in carbon content, suggesting a noticeable interaction between NiMoO4 and carbon within the nanocomposite structure.46,47
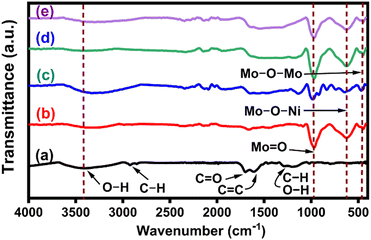 | ||
| Fig. 3 FT-IR spectra of (a) CNS, (b) NiMoO4, (c) NiMoO4/C (D25), (d) NiMoO4/C (D50) and (e) NiMoO4/C (D75). | ||
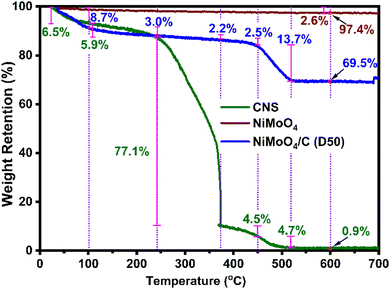
To further elucidate the composition of NiMoO4 in the as-prepared nanocomposite, TGA was conducted for CNS, NiMoO4 and NiMoO4/C (D50), as shown in Fig. 4. NiMoO4 exhibits excellent thermal stability, retaining 97.4% of its initial weight at 600 °C with a minimal weight loss of 2.6%. In contrast, CNS shows significant weight losses of 6.5%, 5.9%, 77.1%, 4.5%, 4.7%, and 0.4% in the temperature ranges of 30–100 °C, 100–240 °C, 240–370 °C, 370–450 °C, 450–520 °C, and 520–600 °C, respectively. Similarly, NiMoO4/C (D50) displays weight losses of 8.7%, 3.0%, 2.2%, 2.5%, 13.7%, and 0.4% across the same temperature ranges. These observed weight losses are likely due to (i) the removal of moisture and volatile substances between 30–240 °C, (ii) the decomposition of organic groups between 240–370 °C, and (iii) the decomposition of residual organics between 370–520 °C.48–50 Notably, at 600 °C, nearly all carbon content in the NiMoO4/C (D50) nanocomposite is lost (CNS weight reduced to 0.9%), while NiMoO4 remains largely intact, retaining 97.4% of its weight. Therefore, the calculated NiMoO4 and carbon components in the NiMoO4/C (D50) nanocomposite were determined to be 71.1% and 28.9%, respectively (refer to ESI† for calculation).
The FESEM images of pure NiMoO4, CNS and NiMoO4/C (D50) in Fig. 5(a)–(c) are used to correlate the impact of their structural features on the supercapacitor performance. In Fig. 5(a), NiMoO4 appears as hierarchical porous microspheres with an average diameter of 3.0 μm.9,51,52 The as-prepared CNS in Fig. 5(b) looks like hollow nano/microspheres (740 nm–1.7 μm).31 However, the preparation of the NiMoO4/C (D50) nanocomposite results in aggregated/collapsed microspheres in Fig. 5(c) due to the blending NiMoO4 and carbon in the nanocomposite. The presence of Ni, Mo, O and C elements in the prepared NiMoO4, CNS and NiMoO4/C (D50) was further confirmed by EDAX analysis (Fig. S1, ESI†). Thus, the effective blended and porous nature of the prepared nanocomposite may afford more electrochemical active sites for more charge storage.21
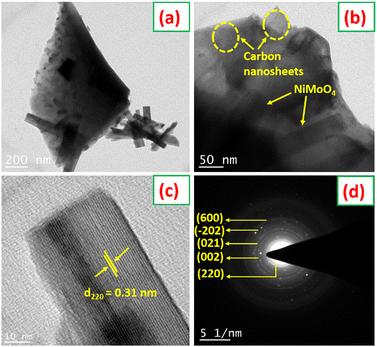
The morphology of the NiMoO4/C (D50) nanocomposite was further examined using HRTEM, as shown in Fig. 6(a)–(d). The HRTEM images in Fig. 6(a) and (b) reveal a graphitic carbon sheet-like structure with embedded NiMoO4 nanorods, indicating the efficient integration of NiMoO4 within the carbon matrix of the nanocomposite. This highlights the effectiveness of the in situ carbon incorporation approach in achieving a homogeneously dispersed nanostructure, superior to conventional blending methods.53Fig. 6(c) displays lattice fringes with a spacing of 0.31 nm, corresponding to the (220) plane of monoclinic NiMoO4. The selected area electron diffraction (SAED) pattern in Fig. 6(d) further confirms the polycrystalline nature of NiMoO4 within the NiMoO4/C (D50) nanocomposite.54
BET isotherms of N2 adsorption–desorption along with BJH pore size distribution plots for NiMoO4 and NiMoO4/C (D50) are shown in Fig. 7(a) and (b) to elucidate their surface area and pore size distribution. Both samples exhibit type IV isotherms with H3 hysteresis loops, indicative of mesoporous materials. Both NiMoO4 and NiMoO4/C (D50) initially show a gradual increase in N2 adsorption with increasing relative pressure due to the presence of mesopores involving capillary reduction and multilayer adsorption. Lastly, a rapid rise in the adsorption at the high-pressure region explores the occurrence of adsorption within the interstices between the nanoparticles. Furthermore, the pore size distribution plots in Fig. 7((a) and (b) insets) also reveal the coexistence of mesopores (2–50 nm) and macropores (>50 nm) in the prepared NiMoO4 and NiMoO4/C (D50) nanocomposite. Besides the incorporation of carbon significantly 12-fold increases the BET surface area of the NiMoO4/C (D50) nanocomposite (37.4 m2 g−1) compared to pure NiMoO4 (2.93 m2 g−1). However, the pore volume and pore radius of the nanocomposite (0.015 cm3 g−1 and 13.9 nm, respectively) are lower compared to NiMoO4 (0.12 cm3 g−1 and 20.8 nm), likely due to the effective blending of NiMoO4 and carbon in the nanocomposite.10,39,55 The observed higher surface area and larger mesoporosity of the NiMoO4/C (D50) nanocomposite may offer more electroactive sites and efficient pathways for electron transport to facilitate faster redox processes and more charge storage.8,51,56
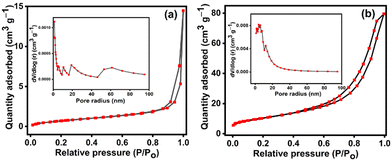 | ||
| Fig. 7 N2 adsorption–desorption BET isotherms with corresponding BJH pore-size distributions plots (insets): (a) NiMoO4 and (b) NiMoO4/C (D50). | ||
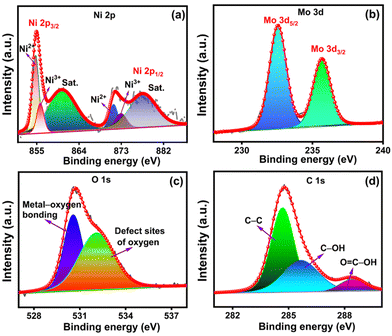
The chemical structure and bonding characteristics of NiMoO4/C (D50) were further confirmed by elucidating their XPS spectra of Mo 3d, Ni 2p, O 1s, and C 1s elements (Fig. 8(a)–(d)). The Ni 2p spectrum in Fig. 8(a) shows two distinct spin–orbit doublets corresponding to Ni 2p3/2 (856.2 eV) and Ni 2p1/2 (873.9 eV), along with shakeup satellite peaks at 861.8 and 880.1 eV for each doublet, respectively. Furthermore, the deconvolution of each doublet presents two peaks corresponding to the coexistence of Ni2+ (855.9 and 873.4 eV) and Ni3+ (856.9 and 875.2 eV). The Mo 3d spectrum (Fig. 8(b)) exhibits two distinct peaks at 232.5 and 235.6 eV corresponding to Mo 3d5/2 and Mo 3d3/2 levels of Mo6+, correspondingly. These findings explore the coexistence of Ni2+/Ni3+ and Mo6+ species in the NiMoO4/C (D50) nanocomposite.1,8,51 Furthermore, the deconvoluted O 1s spectrum (Fig. 8(c)) dictates two peaks at 530.5 and 532.0 eV, respective to the existence of primary lattice oxygen species associated with metal–oxygen bonds and defect sites of lattice oxygen by the insufficient coordination in NiMoO4 or oxygenated species of carbon. The deconvoluted C 1s spectrum of carbon in Fig. 8(d) reveals a prominent peak for C–C at 284.6 eV and other weaker peaks for C–OH (285.6 eV) and O![[double bond, length as m-dash]](https://www.rsc.org/images/entities/char_e001.gif) C–OH (288.3 eV).57,58
C–OH (288.3 eV).57,58
3.2. Three-electrode supercapacitor studies
Three electrode SC studies for NiMoO4, CNS, and NiMoO4/C (Dx)-based electrode materials coated on a nickel plate were examined in 3 M KOH electrolyte at different sweep rates (10 to 100 mV s−1) in the potential range of 0 to 0.6 V (vs. Hg/HgO). Fig. 9(a) shows a set of redox peaks at about 0.43–0.51 V and 0.31–0.39 V in the CV profiles of NiMoO4 and NiMoO4/C (Dx) at a sweep rate of 100 mV s−1, dictating the involvement of pseudocapacitive behavior by the Ni2+/Ni3+ redox couple through the faradaic reactions corresponding to Ni–O/Ni–O–OH redox transitions (eqn (8) and (9)) on the electrode surfaces in the alkaline medium.44,55| NiMoO4 + 2OH− ↔ Ni(OH)2 + MoO42− | (8) |
| Ni2+(OH)2 + OH− ↔ Ni3+OOH + H2O + e− | (9) |
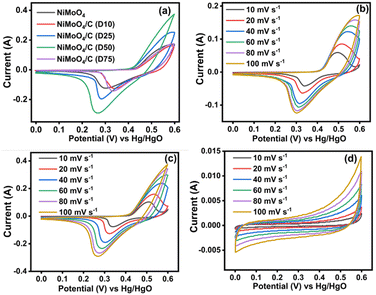 | ||
| Fig. 9 CV curves at different scan rates: (a) comparison data of NiMoO4 and NiMoO4/C (Dx) at 100 mV s−1, (b) NiMoO4, (c) NiMoO4/C (D50) and (d) CNS. | ||
However, Mo species does not take part in redox reactions and it only helps to increase molybdate's conductivity, thereby resulting in enhanced supercapacitor performance.15,59 Furthermore, all the electrode materials show a symmetrical CV profile, demonstrating the reversibility of these redox processes to be employed as efficient rechargeable supercapacitors. In particular, NiMoO4/C (D50) shows a larger CV curve area and enhanced current response compared to NiMoO4 and NiMoO4/C (D10, D25, and D75), signifying that the optimum carbon incorporated nanocomposite can result in enhanced electrical conductivity and electrolyte-philicity via altering the surface composition and properties of the electrodes, with lowering charge transfer resistance to store more amount of charge.60
The impact of various scan rates (10–100 mV s−1) on the CV profiles of all prepared electrodes are shown in Fig. 9(b)–(d) and Fig. S2a–c (ESI†). When increasing the scan rates for the NiMoO4-based electrodes, both the anodic and cathodic peaks shift towards more positive and more negative potentials, respectively, signifying the involvement of faster electron and ion transfer reactions through pseudocapacitive faradaic mechanisms at the electrode–electrolyte boundaries.8,10 Meanwhile, CNS (Fig. 9(d)) exhibits the characteristic rectangular/quasi-rectangular CV profiles associated with the electrical double layer capacitance (EDLC) of a non-faradaic process.61–63
The charge storage capability of the as-prepared electrodes was further evaluated using the GCD technique. Fig. 10(a) shows the comparative GCD curves of NiMoO4 and NiMoO4/C (Dx)-based nanocomposites. The noted longest discharge time for the NiMoO4/C (D50) electrode may result in more charge storage for attaining higher specific capacitance. Furthermore, the observed two voltage plateaus in the GCD curves of the NiMoO4 and NiMoO4/C (Dx)-based nanocomposites depict the involvement of faradaic reactions as corroborated with CV results. All electrode materials show a low IR drop, representing their good conductivity and small internal resistivity for fabricating high-rate supercapacitors.21,44 Furthermore, the noted asymmetrical shape of the GCD curves implies increased polarization. Also, the presence of loops in the GCD curves implies the involvement of faradaic reactions through the insertion/extraction of ions into and out of the NiMoO4 lattice during charge/discharge cycles.64
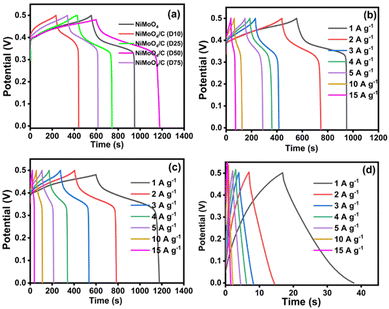 | ||
| Fig. 10 GCD curves at different current densities: (a) comparison data of NiMoO4 and NiMoO4/C (Dx) at 1 A g−1, (b) NiMoO4, (c) NiMoO4/C (D50) and (d) CNS. | ||
The influence of different current densities (1–15 A g−1) on the GCD curves of NiMoO4, CNS, and NiMoO4/C (Dx) nanocomposites are shown in Fig. 10(b)–(d) and Fig. S3a–c (ESI†). At higher current densities, NiMoO4-based electrode materials exhibit linear charge/discharge curves due to faster ion diffusion, which limits the rate of the faradaic charge storage mechanism. Conversely, at lower current densities, non-linear charge/discharge curves are observed due to increased contributions from faradaic reactions, resulting in more efficient charge storage.65,66 To further quantitatively estimate the supercapacitor performance of the prepared electrode materials, specific capacitance (Cs) was calculated from the GCD discharge curves using eqn (1) and the values are presented in Table S1 (ESI†). Notably, NiMoO4/C (D50) demonstrates the highest specific capacitance (940 F g−1) compared to pure NiMoO4 (520 F g−1), CNS (75 F g−1), and other NiMoO4/C (Dx) nanocomposites (436, 583, and 508 F g−1 for D10, D25, and D75, respectively). Interestingly, the NiMoO4/C (D50) nanocomposite exhibits a near-doubling of its specific capacitance compared to pure NiMoO4. In contrast, other nanocomposites do not show a significant enhancement effect. This emphasizes that the incorporation of different amounts of carbon with NiMoO4 could result in altering the surface composition and properties of the as-prepared electrodes. In particular, the dextrose-derived carbon is expected to consist of some polar moieties such as carboxylic acids, alcohols, carbonyl groups, etc., which leads to deriving hydrophilic and hydrophobic regions on the electrode surface.41 The presence of these regions is expected to alter the wettability or electrolyte-philicity of electrode materials. Thus, the existence of a synergistic effect between NiMoO4 and the optimized carbon content in the NiMoO4/C (D50) nanocomposite via improved electrolyte-philicity at the electrode surface results in enhanced electrochemical performance for more charge storage.44,67
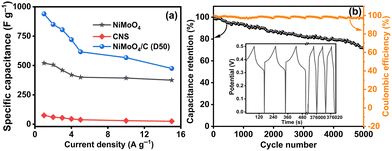
Fig. 11(a) compares the specific capacitances of NiMoO4, CNS, and NiMoO4/C (D50) at various current densities (1 to 15 A g−1), demonstrating the reliable performance of NiMoO4/C (D50) across all tested current densities. As the current density decreases, NiMoO4/C (D50) exhibits higher specific capacitance due to enhanced faradaic processes and increased electrolyte ion diffusion. Furthermore, the NiMoO4/C (D50) electrode exhibits moderate charge–discharge rate capability, retaining approximately 51% of its specific capacitance when the current density is increased from 1 A g−1 to 15 A g−1.14,16 The long-term cycling stability and coulombic efficiency of the NiMoO4/C (D50)-based electrode were evaluated by repeated GCD measurements up to 5000 cycles at 5 A g−1, as shown in Fig. 11(b). The remarkable retention of 71% of its initial specific capacitance up to 5000 cycles demonstrates the appreciable cycling stability and resilience against degradation mechanisms of the NiMoO4/C (D50) electrode. Furthermore, the noted coulombic efficiency remains nearly 96% even up to 5000 cycles, highlighting the efficient charge transfer and reversibility of the faradaic reactions.16,66 Additionally, the FESEM images (Fig. 12(a) and (b)), taken before and after 5000 GCD cycles at 5 A g−1 for the NiMoO4/C (D50) electrodes, illustrate the structural changes impacting supercapacitor performance after cyclic stability testing. The images reveal that the initially smooth electrode surfaces exhibit signs of fracturing or degradation following prolonged cycling, which consequently leads to a decline in supercapacitor performance.
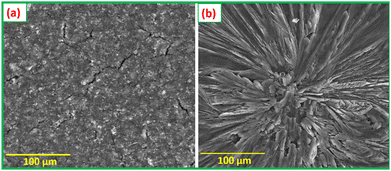 | ||
| Fig. 12 FESEM images of the NiMoO4/C (D50) electrode (a) before and (b) after cyclic stability studies performed for GCD 5000 cycles at 5 A g−1. | ||
EIS analysis of NiMoO4, CNS and NiMoO4/C (D50) provides valuable insights into the electrochemical behavior and interface properties of the electrode materials. The Nyquist plots (Fig. 13) were fitted with an equivalent circuit (inset Fig. 13) using ZSimpWin software to extract key electrical parameters (Table S2, ESI†). All the electrode materials show acceptable χ2 values, indicating excellent fitting of the equivalent circuit. Solution resistance (Rs) for NiMoO4/C (D50) (1.16 Ω cm2) is comparable to NiMoO4 (1.15 Ω cm2) and CNS (1.07 Ω cm2), indicating the minimal impact of carbon on bulk electrolyte resistance. Charge transfer resistance (Rct), crucial for interfacial electron transfer, is significantly lower for NiMoO4/C (D50) (2.96 Ω cm2) compared to NiMoO4 (13.02 Ω cm2), but higher than CNS (55.8 μΩ cm2), suggesting improved interfacial properties likely due to enhanced conductivity from the incorporated carbon. Pore resistance (Rpore) reflects ion diffusion within the electrode. NiMoO4/C (D50) displayed a slightly higher Rpore value (5.48 mΩ cm2) compared to NiMoO4 (0.95 mΩ cm2) but much lower than CNS (57.7 mΩ cm2). This indicates a more accessible pore network in the NiMoO4/C (D50) composite, achieved by altering the surface composition and structure, leading to improved electrolyte penetration and ion diffusion compared to pure CNS.68,69
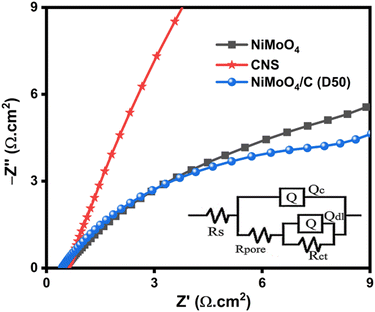 | ||
| Fig. 13 EIS Nyquist plot of NiMoO4, CNS and NiMoO4/C (D50) samples with the inset of their equivalent circuit. | ||
Constant phase elements (CPEs) provide insights into capacitance. We analyzed Qc (coating capacitance) and Qdl (double layer capacitance). Qc values for NiMoO4 (0.0032 S cm−2 sn), CNS (0.0012 S cm−2 sn), and NiMoO4/C (D50) (0.0024 S cm−2 sn) represent the porous structure's capacitance. The slightly lower Qc for NiMoO4/C (D50) suggests a potentially less developed pore network compared to pristine NiMoO4. Qdl values for NiMoO4 (0.0229 S cm−2 sn), CNS (0.0005 S cm−2 sn), and NiMoO4/C (D50) (0.0236 S cm−2 sn) reflect the electrode–electrolyte interface capacitance. Comparable values for NiMoO4 and NiMoO4/C (D50) indicate minimal change in accessible surface area for ion adsorption with carbon incorporation. The lower Qdl for CNS suggests limited capacitance due to its lower conductivity. The Warburg impedance (W) characterizes ion diffusion within the electrode. W values for NiMoO4 (4.091 × 10⁻¹² S cm−2 s0.5), CNS (1.034 × 10⁻⁴ S cm−2 s0.5), and NiMoO4/C (D50) (6.465 × 10⁻¹² S cm−2 s0.5) reveal slower diffusion in CNS compared to NiMoO4 and NiMoO4/C (D50). This suggests that carbon facilitates ion transport in the composite while maintaining a comparable rate to pristine NiMoO4. EIS analysis supports the benefits of the NiMoO4/C (D50) composite structure. While the Qc value suggests a potentially less developed pore network, the comparable Qdl value indicates maintained accessible surface area. This highlights a potential trade-off between pore development and conductivity within the composite. The significantly lower Rct and faster ion diffusion (W) in NiMoO4/C (D50) compared to CNS demonstrate the positive impact of carbon, likely contributing to its enhanced electrochemical performance.70–72
To investigate the contribution of capacitive or diffusive controlled processes in the energy storage mechanism of NiMoO4/C (D50), CV experiments were performed at various scan rates (1–10 mV s−1) using three electrode configurations. The association between the current (i) vs. scan rate (v) can be expressed by the following eqn (10) and (11):44,73
| i = a × νb | (10) |
log(i) = log(a) + b![[thin space (1/6-em)]](https://www.rsc.org/images/entities/char_2009.gif) log(ν) log(ν) | (11) |
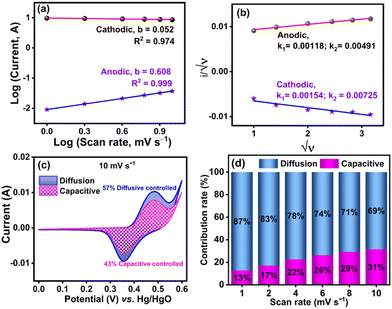
Further, it is known that the value of b is 0.5 and 1 for the diffusion-controlled and capacitive-controlled processes, respectively.73,74 The b values of the NiMoO4/C (D50) electrode obtained from Fig. 14(a) indicate mixed behavior. For the anodic process, the intermediate b value (0.608) falls within the range of 0.5 < b < 1.0, suggesting contributions from both diffusion and capacitive processes, i.e. the system is influenced by both the diffusion of ions and surface reactions. Conversely, the lower b value (0.052) for the cathodic process (b < 0.5) suggests a predominantly diffusion-controlled process with additional kinetic limitations, which may be due to factors such as slow electron transfer or mass transport resistances.4,75
To further estimate the contribution of the surface-controlled capacitive process (k1v) and diffusion-controlled/faradaic process (k1√ν) methods on the current of the NiMoO4/C (D50) electrode, the following eqn (12)–(15) were used:73
| i = k1ν + k2√ν | (12) |
| i/√ν = k1√ν + k2 | (13) |
 | (14) |
 | (15) |
3.3. Two-electrode symmetric and asymmetric SC studies
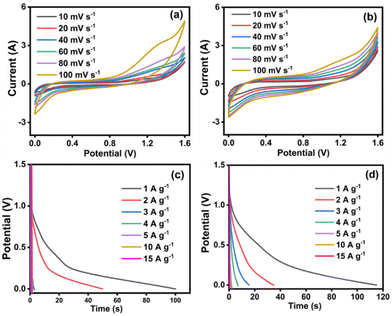
The electrochemical outcomes of NiMoO4/C (D50) based symmetric and asymmetric SCs were evaluated at different scan rates (10–100 mV s−1) using a Swagelok-type two-electrode setup and 3 M KOH electrolyte. The CV curves of both symmetric and asymmetric SCs exhibit no distinct redox peaks in Fig. 15(a) and (b). Unlike the symmetric SC, the asymmetric SC demonstrates a uniformly increased current response even upon increasing the scan rate, indicating its good rechargeable behavior for making it suitable for repeated charge–discharge applications.77 Moreover, the GCD profiles of both symmetric and asymmetric SCs at different current densities (1 to 15 A g−1) in Fig. 15(c) and (d) match with the characteristic pseudocapacitive behavior.55,78Furthermore, the performance of symmetric and asymmetric SCs was assessed in terms of specific capacitance (Cs), power density (P) and energy density (E), at a current density of 1 A g−1 using eqn (2)–(7) and the values are given in Table 1. In comparison, the symmetric SC demonstrates a doubled value of specific capacitance (83 F g−1), while the asymmetric SC delivers the doubled values of both energy density (14.2 W h kg−1) and power density (444 W kg−1). These outcomes highlight the promising electrochemical performance of NiMoO4/C (D50) asymmetric SCs for versatile energy-storing applications.44,57
| Two-electrode SCs | C s (F g−1) | E (W h kg−1) | P (W kg−1) |
|---|---|---|---|
| Symmetric | 83 | 7.4 | 267 |
| Asymmetric | 40 | 14.2 | 444 |
3.4. Fabrication of an all-solid-state symmetric SC
To demonstrate the practical energy storage capability of NiMoO4/C (D50) in real-time, three symmetric supercapacitor devices were connected in series to power a blue LED (Fig. 16). This configuration successfully illuminated the LED for about two minutes, signifying their promising potential for practical applications where short-term bursts of energy are required. However, the observed decay of LED brightness is so fast due to the low-cost current collector (stainless-steel) used to fabricate all-solid-state symmetric supercapacitors. Furthermore, the electrolytes have to be optimized by a combination of different electrolytes for high-performing SCs. | ||
| Fig. 16 Demonstration of powering a blue LED light by three NiMoO4/C (D50) based symmetric SC devices connected in series. | ||
Notably, the prepared NiMoO4/C (D50) nanocomposite demonstrates a significant supercapacitor performance compared to previously reported NiMoO4-based materials (Table S3, ESI†). This exceptional performance is due to several factors: (1) conductive carbon networks facilitate rapid charge/discharge, (2) the porous nanosphere structure maximizes electrolyte accessibility, boosting charge storage, (3) in situ synthesis and incorporation of optimal carbon content improves the electrolyte-philicity of the electrode via altering the surface composition and properties, providing more electroactive sites, and (4) intimate integration of NiMoO4 and carbon amplifies supercapacitor behavior beyond individual component contributions. This rapid, one-pot, cost-effective, and environmentally friendly approach of in situ carbon incorporation enables scalable nanocomposite production, and promising applications in supercapacitors, lithium-ion batteries, and other energy storage technologies.
4. Conclusions
In summary, this work demonstrated the impact of different ratios of carbon in NiMoO4/C (Dx) nanocomposites prepared via in situ hydrothermal carbonization of dextrose for the application of electrode materials in supercapacitor applications. The NiMoO4/C (D50) nanocomposite exhibited a well-integrated structure, with NiMoO4 nanorods dispersed within a graphitic carbon matrix, consisting of 71.1% NiMoO4 and 28.9% carbon components. The graphitic carbon matrix showed increased defects with higher carbon content, which contributed to the enhanced surface area and mesoporosity of the nanocomposite. In particular, the NiMoO4/C (D50) electrode material delivered a high specific capacitance of 940 F g−1 at 1 A g−1 compared to pure NiMoO4 (520 F g−1) and NiMoO4/C (D10, D25 and D75) nanocomposites (436–583 F g−1). Furthermore, the fabricated NiMoO4/C (D50) based two-electrode system showed doubled energy and power densities (14.2 W h kg−1 and 444 W kg−1) for asymmetric supercapacitors compared to symmetric supercapacitors (energy density of 7.4 W h kg−1 at power density of 267 W kg−1). This noted superior supercapacitor performance of NiMoO4/C (D50) can be ascribed to the incorporation of optimal carbon content in the nanocomposite, which synergistically improves the electroactive sites and electrolyte-philicity via altering the surface composition and properties of the electrodes, for more charge storage. Thus, this kind of in situ hydrothermal synthesis of bimetallic oxides/carbon nanocomposites with optimal carbon content using different carbon sources will be a promising strategy for achieving high-performance supercapacitors.Data availability
The data supporting this article have been included as part of the ESI.†Conflicts of interest
There are no conflicts to declare.Acknowledgements
Dr S. Nehru gratefully acknowledges the financial support provided by the University of Madras (RUSA 2.0, RI & QI) and the DST-Science and Engineering Research Board (EEQ/2018/001402). Dr S. Veeralakshmi thanks the Department of Science and Technology, Ministry of Science and Technology, India, for the Women Scientist Scheme-A project (DST/WOS-A/CS-168/2021 (G)). Furthermore, the authors are thankful to the UGC DAE Consortium for Scientific Research, University Grants Commission, for the Collaborative Research Scheme (CRS) project (CRS/2021-22/04/629). We also express our sincere gratitude to the GNR Instrumentation Centre, University of Madras, for their invaluable analytical support.Notes and references
- R. A. Mir, S. Upadhyay, R. A. Rather, S. J. Thorpe and O. P. Pandey, Energy Adv., 2022, 1, 438–448 RSC.
- S. Wang, W. Jiang, J. Wu, H. Huang, P. Guo, X. Zhang, H. Gu, Q.-A. Huang and Y. Hu, Energy Adv., 2022, 1, 704–714 RSC.
- D. P. Chatterjee and A. K. Nandi, J. Mater. Chem. A, 2021, 9, 15880–15918 RSC.
- R. Patil, L. Pradhan, B. M. Matsagar, O. Agrawal, K. C. W. Wu, B. K. Jena and S. Dutta, Energy Adv., 2023, 2, 1650–1659 RSC.
- B. Wang, Y. Wang, J. Park, H. Ahn and G. Wang, J. Alloys Compd., 2011, 509, 7778–7783 CrossRef CAS.
- J. Xu, J. Li, Q. Yang, Y. Xiong and C. Chen, Electrochim. Acta, 2017, 251, 672–680 CrossRef CAS.
- K. Sasikumar and H. Ju, Chemosensors, 2022, 10, 516 CrossRef CAS.
- Y. Huang, F. Cui, Y. Zhao, J. Lian, J. Bao, T. Liu and H. Li, Inorg. Chem. Front., 2018, 5, 1594–1601 RSC.
- D. Cai, D. Wang, B. Liu, Y. Wang, Y. Liu, L. Wang, H. Li, H. Huang, Q. Li and T. Wang, ACS Appl. Mater. Interfaces, 2013, 5, 12905–12910 CrossRef CAS.
- Y. Li, J. Jian, L. Xiao, H. Wang, L. Yu, G. Cheng, J. Zhou and M. Sun, Mater. Lett., 2016, 184, 21–24 CrossRef CAS.
- D. Guo, Y. Luo, X. Yu, Q. Li and T. Wang, Nano Energy, 2014, 8, 174–182 CrossRef CAS.
- E. Murugan, S. Govindaraju and S. Santhoshkumar, Electrochim. Acta, 2021, 392, 138973 CrossRef CAS.
- D. Cai, B. Liu, D. Wang, Y. Liu, L. Wang, H. Li, Y. Wang, C. Wang, Q. Li and T. Wang, Electrochim. Acta, 2014, 125, 294–301 CrossRef CAS.
- C. Teng, X. Gao, N. Zhang, Y. Jia, X. Li, Z. Shi, Z. Wu, M. Zhi and Z. Hong, RSC Adv., 2018, 8, 32979–32984 RSC.
- Y. Zhang, C.-R. Chang, X.-D. Jia, Q.-Y. Huo, H.-L. Gao, J. Yan, A.-Q. Zhang, Y. Ru, H.-X. Mei, K.-Z. Gao and L.-Z. Wang, Inorg. Chem. Commun., 2020, 111, 107631 CrossRef CAS.
- D. Muthu, S. Vargheese, Y. Haldorai and R. T. Rajendra Kumar, Mater. Sci. Semicond. Process., 2021, 135, 106078 CrossRef CAS.
- S.-W. Zhang, B.-S. Yin, C. Liu, Z.-B. Wang and D.-M. Gu, Appl. Surf. Sci., 2018, 458, 478–488 CrossRef CAS.
- M. Wang, J. Zhang, X. Yi, B. Liu, X. Zhao and X. Liu, Beilstein J. Nanotechnol., 2020, 11, 240–251 CrossRef CAS PubMed.
- E. R. Ezeigwe, P. S. Khiew, C. W. Siong, I. Kong and M. T. T. Tan, Ceram. Int., 2017, 43, 13772–13780 CrossRef CAS.
- M. Beemarao, P. Kanagambal, K. Ravichandran, P. Rajeswaran, I. M. Ashraf, U. Chalapathi and S.-H. Park, Inorg. Chem. Commun., 2023, 153, 110853 CrossRef CAS.
- C. Wei, Y. Huang, J. Yan, X. Chen and X. Zhang, Ceram. Int., 2016, 42, 15694–15700 CrossRef CAS.
- S. Zallouz, J.-M. Le Meins and C. Matei Ghimbeu, Energy Adv., 2022, 1, 1051–1064 RSC.
- Z. Yang, J. Tian, Z. Yin, C. Cui, W. Qian and F. Wei, Carbon, 2019, 141, 467–480 CrossRef CAS.
- S. A. Nicolae, H. Au, P. Modugno, H. Luo, A. E. Szego, M. Qiao, L. Li, W. Yin, H. J. Heeres, N. Berge and M.-M. Titirici, Green Chem., 2020, 22, 4747–4800 RSC.
- Y. Mo, Q. Ru, X. Song, L. Guo, J. Chen, X. Hou and S. Hu, Carbon, 2016, 109, 616–623 CrossRef CAS.
- L. Zhang, J. Mu, Z. Wang, G. Li, Y. Zhang and Y. He, J. Alloys Compd., 2016, 671, 60–65 CrossRef CAS.
- C. Wang, C. Wu, S. Chen, Q. He, D. Liu, X. Zheng, Y. A. Haleem and L. Song, RSC Adv., 2017, 7, 4667–4670 RSC.
- H.-Y. Li, K. Jiao, L. Wang, C. Wei, X. Li and B. Xie, J. Mater. Chem. A, 2014, 2, 18806–18815 RSC.
- L. Ma, G. Sun, J. Ran, S. Lv, X. Shen and H. Tong, ACS Appl. Mater. Interfaces, 2018, 10, 22278–22290 CrossRef CAS.
- Z.-H. Miao, H. Wang, H. Yang, Z. Li, L. Zhen and C.-Y. Xu, ACS Appl. Mater. Interfaces, 2016, 8, 15904–15910 CrossRef CAS.
- Y. Qu, Z. Zhang, X. Wang, Y. Lai, Y. Liu and J. Li, J. Mater. Chem. A, 2013, 1, 14306–14310 RSC.
- R. Yuvaraja, S. Sarathkumar, V. Gowsalya, S. P. Anitha Juliet, S. Veeralakshmi, S. Kalaiselvam, S. Hussain and S. Nehru, New J. Chem., 2024, 48, 15556–15566 RSC.
- Y. Zhou, C. Li, X. Li, P. Huo and H. Wang, Dalton Trans., 2021, 50, 1097–1105 RSC.
- M. Sethi, U. S. Shenoy and D. K. Bhat, Nanoscale Adv., 2020, 2, 4229–4241 RSC.
- Y. Qiu, X. Li, M. Bai, H. Wang, D. Xue, W. Wang and J. Cheng, New J. Chem., 2017, 41, 2124–2130 RSC.
- M. Liu, Y. Yan, L. Zhang, X. Wang and C. Wang, J. Mater. Chem., 2012, 22, 11458–11461 RSC.
- N. Padmanathan, H. Shao and K. M. Razeeb, Int. J. Hydrogen Energy, 2020, 45, 30911–30923 CrossRef CAS.
- S. Ratha, A. K. Samantara, K. K. Singha, A. S. Gangan, B. Chakraborty, B. K. Jena and C. S. Rout, ACS Appl. Mater. Interfaces, 2017, 9, 9640–9653 CrossRef CAS.
- V. S. Budhiraju, R. Kumar, A. Sharma and S. Sivakumar, Electrochim. Acta, 2017, 238, 337–348 CrossRef CAS.
- E. Sulistya, L. Hui-Hui, N. K. Attenborough, S. Pourshahrestani, N. A. Kadri, E. Zeimaran, N. A. B. A. Razak, B. Amini Horri and B. Salamatinia, J. Taibah Univ. Sci., 2020, 14, 1042–1050 CrossRef.
- J. Li, Y. Yang, Y. Xiao, B. Tang, Y. Ji and S. Liu, Front. Mater., 2021, 8, 790911 CrossRef.
- N. Papaioannou, A. Marinovic, N. Yoshizawa, A. E. Goode, M. Fay, A. Khlobystov, M.-M. Titirici and A. Sapelkin, Sci. Rep., 2018, 8, 6559 CrossRef.
- X. Xu, Q. Liu, T. Wei, Y. Zhao and X. Zhang, J. Mater. Sci.: Mater. Electron., 2019, 30, 5109–5119 CrossRef CAS.
- J. Yuan, D. Yao, L. Jiang, Y. Tao, J. Che, G. He and H. Chen, ACS Appl. Energy Mater., 2020, 3, 1794–1803 CrossRef CAS.
- S. Keerthana, B. J. Rani, R. Yuvakkumar, G. Ravi, B. Saravanakumar, M. Pannipara, A. G. Al-Sehemi and D. Velauthapillai, Environ. Res., 2021, 197, 111073 CrossRef CAS.
- G. Solomon, A. Landström, R. Mazzaro, M. Jugovac, P. Moras, E. Cattaruzza, V. Morandi, I. Concina and A. Vomiero, Adv. Energy Mater., 2021, 11, 2101324 CrossRef CAS.
- K. Thiagarajan, T. Bavani, P. Arunachalam, S. J. Lee, J. Theerthagiri, J. Madhavan, B. G. Pollet and M. Y. Choi, Nanomaterials, 2020, 10, 392 CrossRef CAS PubMed.
- C. Hou, W. Yang, H. Kimura, X. Xie, X. Zhang, X. Sun, Z. Yu, X. Yang, Y. Zhang, B. Wang, B. B. Xu, D. Sridhar, H. Algadi, Z. Guo and W. Du, J. Mater. Sci. Technol., 2023, 142, 185–195 CrossRef CAS.
- Q. Mu, R. Liu, H. Kimura, J. Li, H. Jiang, X. Zhang, Z. Yu, X. Sun, H. Algadi, Z. Guo, W. Du and C. Hou, Adv. Compos. Hybrid Mater., 2022, 6, 23 CrossRef.
- F. Li, Z. Bi, H. Kimura, H. Li, L. Liu, X. Xie, X. Zhang, J. Wang, X. Sun, Z. Ma, W. Du and C. Hou, Adv. Compos. Hybrid Mater., 2023, 6, 133 CrossRef CAS.
- Z. Zhang, Y. Liu, Z. Huang, L. Ren, X. Qi, X. Wei and J. Zhong, Phys. Chem. Chem. Phys., 2015, 17, 20795–20804 RSC.
- M. Yao, Z. Hu, Y. Liu and P. Liu, Ionics, 2016, 22, 701–709 CrossRef CAS.
- P. R. Jothi, S. Kannan and G. Velayutham, J. Power Sources, 2015, 277, 350–359 CrossRef CAS.
- A. K. Yedluri, T. Anitha and H.-J. Kim, Energies, 2019, 12, 1143 CrossRef CAS.
- C. J. Raj, R. Manikandan, K. H. Yu, G. Nagaraju, M.-S. Park, D.-W. Kim, S. Y. Park and B. C. Kim, Inorg. Chem. Front., 2020, 7, 369–384 RSC.
- J. Wang, Y. Liu, T. Hao, J. Hao and T. Ma, New J. Chem., 2024, 48, 9778–9793 RSC.
- Y. Hao, H. Huang, Q. Wang, Q. Wang and G. Zhou, Chem. Phys. Lett., 2019, 728, 215–223 CrossRef CAS.
- T. Liu, H. Chai, D. Jia, Y. Su, T. Wang and W. Zhou, Electrochim. Acta, 2015, 180, 998–1006 CrossRef CAS.
- S. H. Kazemi, F. Bahmani, H. Kazemi and M. A. Kiani, RSC Adv., 2016, 6, 111170–111181 RSC.
- L. Zhao and F. Ran, Chem. Commun., 2023, 59, 6969–6986 RSC.
- M. Enterría, F. J. Martín-Jimeno, F. Suárez-García, J. I. Paredes, M. F. R. Pereira, J. I. Martins, A. Martínez-Alonso, J. M. D. Tascón and J. L. Figueiredo, Carbon, 2016, 105, 474–483 CrossRef.
- K. K. Lee, W. Hao, M. Gustafsson, C.-W. Tai, D. Morin, E. Björkman, M. Lilliestråle, F. Björefors, A. M. Andersson and N. Hedin, RSC Adv., 2016, 6, 110629–110641 RSC.
- L. Su, J. Li and F. Ran, Green Chem., 2023, 25, 9351–9362 RSC.
- S. Veeralakshmi, S. Kalaiselvam, R. Murugan, P. Pandurangan, S. Nehru, S. Sakthinathan and T.-W. Chiu, J. Mater. Sci.: Mater. Electron., 2020, 31, 22417–22426 CrossRef CAS.
- T. Dong, M. Li, P. Wang and P. Yang, Int. J. Hydrogen Energy, 2018, 43, 14569–14577 CrossRef CAS.
- B. Tong, W. Wei, X. Chen, J. Wang, W. Ye, S. Cui, W. Chen and L. Mi, CrystEngComm, 2019, 21, 5492–5499 RSC.
- F. Ran, Y. Wu, M. Jiang, Y. Tan, Y. Liu, L. Kong, L. Kang and S. Chen, Dalton Trans., 2018, 47, 4128–4138 RSC.
- V. Sharma, R. V. Khose and K. Singh, Energy Adv., 2024, 3, 177–190 RSC.
- R. Deka, S. Rathi and S. M. Mobin, Energy Adv., 2023, 2, 2119–2128 RSC.
- M. Salihovic, E. Pameté, S. Arnold, I. Sulejmani, T. Bartschmid, N. Hüsing, G. Fritz-Popovski, C. Dun, J. J. Urban, V. Presser and M. S. Elsaesser, Energy Adv., 2024, 3, 482–494 RSC.
- P. N. K. Siddu, S. M. Jeong and C. S. Rout, Energy Adv., 2024, 3, 341–365 RSC.
- A. Pullanchiyodan, R. Joy, P. Sreeram, L. R. Raphael, A. Das, N. T. M. Balakrishnan, J.-H. Ahn, A. Vlad, S. Sreejith and P. Raghavan, Energy Adv., 2023, 2, 922–947 RSC.
- Z. Guo, Y. Zhao, J. Mu, S. Li, F. Li, J. Wang, H. Yang, J. Mu and M. Zhang, Ceram. Int., 2023, 49, 19652–19663 CrossRef CAS.
- Z. Luo, D. Shu, F. Yi, J. Ling, M. Wang, C. Huang and A. Gao, New J. Chem., 2021, 45, 22748–22757 RSC.
- R. Liu, X.-R. Shi, Y. Wen, X. Shao, C. Su, J. Hu and S. Xu, J. Energy Chem., 2022, 74, 149–158 CrossRef CAS.
- P. Kumcham, T. V. M. Sreekanth, K. Yoo and J. Kim, New J. Chem., 2024, 48, 7820–7835 RSC.
- D. Jhankal, M. S. Khan, P. Shakya, N. Bhardwaj, B. Yadav, K. K. Jhankal and K. Sachdev, Energy Adv., 2024, 3, 191–202 RSC.
- Z. Wang, G. Wei, K. Du, X. Zhao, M. Liu, S. Wang, Y. Zhou, C. An and J. Zhang, ACS Sustainable Chem. Eng., 2017, 5, 5964–5971 CrossRef CAS.
Footnote |
| † Electronic supplementary information (ESI) available. See DOI: https://doi.org/10.1039/d4ya00438h |
| This journal is © The Royal Society of Chemistry 2025 |

