DOI:
10.1039/D4RA05026F
(Paper)
RSC Adv., 2024,
14, 29490-29504
Structural and luminescence properties of novel Eu3+-doped Na3Ba2LaNb10O30 phosphors with high quantum efficiency and excellent color purity for w-LED applications†
Received
11th July 2024
, Accepted 20th August 2024
First published on 18th September 2024
Abstract
In this study, we report the successful synthesis and thorough characterization of Eu3+-doped Na3Ba2LaNb10O30 phosphors, targeting their application in white-light-emitting diodes (w-LEDs). The phosphors were synthesized using a high-temperature solid-state method, ensuring robust incorporation of Eu3+ ions into the host lattice. Comprehensive analyses were performed, including X-ray diffraction (XRD), field emission scanning electron microscopy (FESEM), energy-dispersive X-ray (EDX) spectroscopy, Fourier transform infrared (FT-IR) spectroscopy and Raman spectroscopy, confirming the phase purity, crystallinity, morphology, and elemental composition of the phosphors. We have also studied the electronic structure using diffuse reflectance spectroscopy (DRS). Photoluminescence studies revealed strong red emissions under near-ultraviolet light excitation, with the optimal Eu3+ doping concentration identified to be 9 mol%. Quantum-yield measurements demonstrated high luminescence efficiency, while chromaticity coordinates indicated excellent color purity suitable for w-LED applications. These findings contribute significantly to the advancement of phosphor materials for solid-state lighting, suggesting promising prospects for their integration into commercial LED devices.
1 Introduction
A phosphor is a substance that emits light when exposed to UV radiation, X-rays, electron beams, friction, or other forms of excitation. It consists of a host material with an activator ion within its lattice, which serves as the luminescence center where electron relaxation occurs.1 Examples of activators include rare-earth elements such as Eu3+, Eu2+, Dy3+ and Pr3+. Phosphors have applications in various optoelectronic devices, such as light converters, solid-state lasers, solid-state lighting, optical thermometers, and optical amplifiers.2–7 White-light-emitting diodes (w-LEDs) are extensively employed in areas such as plant growth (including that of vegetables, flowers, herbs, etc.), display technologies, medical illumination, and outdoor lighting.8–10
As a novel lighting and display technology for the next generation, phosphor-converted LEDs (pc-LEDs) offer significant advantages over fluorescent and incandescent lamps. Compared to traditional light sources, these LEDs are environmentally friendly, have long lifespans (>100![[thin space (1/6-em)]](https://www.rsc.org/images/entities/char_2009.gif) 000 hours), and deliver high luminous efficiency.11–15 White light in commercial wLEDs is typically achieved by coating a blue LED chip with a yellow Y3Al5O12:Ce3+ (YAG:Ce3+) phosphor. This configuration is compact, lightweight, easy to use, and has a long lifespan. However, its drawbacks include lower efficiency due to the Stokes shift and subpar color rendering index (CRI) (<80) and a high correlated color temperature (CCT) (>5000 K) owing to the absence of red wavelengths in the YAG:Ce3+ phosphor. Another method for generating white light involves a UV chip in combination with phosphors that encompass the three primary colors, increasing luminous efficiency by reducing energy reabsorption. This option is more cost-effective compared to an LED matrix, providing excellent color rendering and control over white light’s correlated color temperature. However, due to Stokes conversion, this method is less energy efficient, and maintaining a consistent phosphor coating is challenging. Additionally, phosphors tend to degrade more quickly than LEDs.16 The third approach involves establishing an array of multiple LED chips, each emitting light at varying frequencies. This multi-LED configuration provides an exceptional color rendering index and allows for straightforward management of the white point. Nonetheless, maintaining control over the correlated color temperature is challenging, as each LED requires separate output power control and possesses a unique lifespan.17 The current pc-wLEDs are deficient in the red color component, making it necessary to incorporate a red phosphor to achieve warm white light and enhance color rendering. However, the existing red phosphors, typically based on sulfide and nitride, suffer from poor stability and low efficiency. Moreover, the heat produced by LED chips negatively impacts the luminescent properties of the phosphor and the overall performance of pc-wLEDs. Consequently, developing a red phosphor that is both chemically and thermally stable is essential.
000 hours), and deliver high luminous efficiency.11–15 White light in commercial wLEDs is typically achieved by coating a blue LED chip with a yellow Y3Al5O12:Ce3+ (YAG:Ce3+) phosphor. This configuration is compact, lightweight, easy to use, and has a long lifespan. However, its drawbacks include lower efficiency due to the Stokes shift and subpar color rendering index (CRI) (<80) and a high correlated color temperature (CCT) (>5000 K) owing to the absence of red wavelengths in the YAG:Ce3+ phosphor. Another method for generating white light involves a UV chip in combination with phosphors that encompass the three primary colors, increasing luminous efficiency by reducing energy reabsorption. This option is more cost-effective compared to an LED matrix, providing excellent color rendering and control over white light’s correlated color temperature. However, due to Stokes conversion, this method is less energy efficient, and maintaining a consistent phosphor coating is challenging. Additionally, phosphors tend to degrade more quickly than LEDs.16 The third approach involves establishing an array of multiple LED chips, each emitting light at varying frequencies. This multi-LED configuration provides an exceptional color rendering index and allows for straightforward management of the white point. Nonetheless, maintaining control over the correlated color temperature is challenging, as each LED requires separate output power control and possesses a unique lifespan.17 The current pc-wLEDs are deficient in the red color component, making it necessary to incorporate a red phosphor to achieve warm white light and enhance color rendering. However, the existing red phosphors, typically based on sulfide and nitride, suffer from poor stability and low efficiency. Moreover, the heat produced by LED chips negatively impacts the luminescent properties of the phosphor and the overall performance of pc-wLEDs. Consequently, developing a red phosphor that is both chemically and thermally stable is essential.
Lanthanide ions primarily produce luminescence through electron transitions within the 4f orbital, while the 5s and 5p orbitals shield these 4f electrons, resulting in sharp luminescence peaks relatively unaffected by the ligand field. Different Eu3+-doped materials yield varied luminescence properties. For example, Sr3TeO6:Eu3+ exhibits intense red emission due to the 5D0 → 7F2 transition,18 Y2Ti2O7:Eu3+ produces orange-red emission from the 5D0 → 7F1 transition,19 and Ca2Ga2SiO7:Eu3+ emits strong red light via the 5D0 → 7F4 transition.20 The choice of host material greatly influences the luminescence characteristics of Eu3+-doped phosphors. Eu3+ ions emit strong red light in the 610–700 nm range, making them valuable for creating red-light-emitting materials. The red emission from Eu3+-doped phosphors arises from transitions between 5D0 and 7FJ (J = 0, 1, 2, 3, 4) energy levels in the Eu3+ configuration, particularly from the 5D0 to 7F2 transition, which is sensitive to the local ligand symmetry.21
Niobates are excellent host materials for luminescence applications due to their robust chemical and physical stability.22,23 Rare-earth-ion-doped niobates, such as K2LaNb5O15:Eu3+,24 Ba2LaNbO6:Eu3+,25 and Bi3TiNbO9:Eu3+,26 exhibit excellent luminescence properties and thermal stability. The tungsten bronze structure, known for its chemical stability and magnetic properties, has shown potential in producing promising red phosphors for w-LEDs, such as Ba4LaTiNb9O30:Sm3+ and NaSr2Nb5O15:Eu3+.27,28 Niobates with TTB (tetragonal tungsten bronze) structures are promising materials for ferroelectric and piezoelectric applications.22 These deficient perovskite TTB niobates feature corner-connected NbO6 octahedra and three types of cation-filled tunnels, resulting in significant spontaneous polarization and large dielectric constants.29 In deformed metal-oxygen polyhedra, they exhibit strong electron–hole separation and transport through static electric fields caused by structure-induced dipole moments. Consequently, even minor structural adjustments, such as changes in cation-site occupancy, can greatly impact charge mobility. Leveraging this property, we chose niobate-based TTB structures to study their photoluminescence characteristics. Furthermore, tungsten bronze phosphors like Sr5YTi3Nb7O30, NaSr2Nb5O15 and Ba4LaTiNb9O30 have shown potential in photonic applications, particularly in white LEDs.27,28 The tetragonal tungsten bronze structure can accommodate lanthanides or transition metals as dopants due to its specific tetragonal crystal structure, allowing for the production of high-quality doped single crystals.30 A common method for preparing niobate-based phosphors is solid-state reaction, which offers excellent morphology and luminosity of the prepared samples compared to other methods.31
In this study, a novel red-light-emitting TTB-structured phosphor, Na3Ba2LaNb10O30:Eu3+, was investigated. The research focused on its crystal structure, morphology, elemental composition, electronic structure, infrared and Raman spectroscopy, steady-state and time-resolved photoluminescence, doping concentration effects on the luminescence properties, and quantum efficiency. The results showed that the phosphors produced sharp emission peaks under near-ultraviolet light at 398 nm and blue light at 465 nm. The Na3Ba2LaNb10O30:xEu3+ (x = 9 mol%) sample exhibited a narrowband emission peak at 615 nm under 398 nm excitation. This Eu3+-doped Na3Ba2LaNb10O30 phosphor demonstrated dual red emission at 615 nm (5D0 to 7F2) and 592 nm (5D0 to 7F1). Comprehensive analysis for wLEDs, including determination of chromaticity coordinates, CCT, and color purity, suggests that the Na3Ba2LaNb10O30:Eu3+ phosphor has promising potential for use in wLEDs due to its red emission properties. This study focuses on exploring Na3Ba2LaNb10O30:xEu3+ as a novel red-emitting phosphor for use in w-LEDs. Na3Ba2LaNb10O30 was first reported in 2023 as a tetragonal tungsten bronze structure with enhanced internal quantum yield.32 Although its luminescence properties for red emissions have not been extensively studied, the potential for Na3Ba2LaNb10O30:xEu3+ in w-LED applications warrants investigation.
2 Experimental procedure
2.1 Phosphor preparation
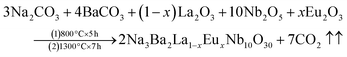
The Na3Ba2LaNb10O30 phosphors have been synthesized using a high-temperature solid-state method with varying Eu3+ doping levels (x = 1–11 mol%). The starting materials used for the preparation included Na2CO3 (99.5%), BaCO3 (99.9%), La2O3 (99.9%), Eu2O3 (99.9%) and Nb2O5 (99.9%). All precursors were of analytical-grade quality from Sigma Aldrich. These components were carefully measured using an electronic balance and ground together in an agate mortar and pestle for approximately 1 hour. The samples were placed into alumina crucibles (numbered 1 to 11) and subjected to high-temperature processing in a programmable muffle furnace from Metrex Scientific Instruments (model: MF-14P), with a heating rate of 3 °C min−1. The initial calcination was carried out at 800 °C for 5 hours, followed by subsequent calcination at 1300 °C for 7 hours. The samples were naturally allowed to cool to room temperature and then reground for 30 minutes to make a fine powder. This process produced a series of prepared phosphor samples for further analysis and experimentation. The relevant reaction equation is as follows:| |
 | (1) |
2.2 Characterization techniques
X-ray diffraction (XRD) patterns of the phosphor samples were recorded using a Panalytical model X’pert Pro with Cu Kα radiation (λ = 1.5406 Å) in the scanning range from 20° to 80° at 40 kV and 40 mA. The phosphors were then analyzed with field-emission scanning electron microscopy (FESEM) utilising a JEOL JSM-6490, which was operated at an accelerating voltage of 5 kV, while the elemental composition and mapping of the powder was determined using an energy-dispersive X-ray (EDX) spectrometer. ImageJ software was used to estimate the average particle size of the as-prepared phosphor material. The Fourier-transform infrared (FT-IR) spectrum of Na3Ba2LaNb10O30 was captured using a PerkinElmer Frontier spectrometer in the mid-infrared range (4000–400 cm−1). The spectrum was measured after preparing pellets by blending the samples with potassium bromide (KBr, analytical grade) and compressing them using a hydraulic press at a load of 10 tons. The Raman spectra were recorded in the range of 0–1600 cm−1 using a JY Horiba iHR550 spectrometer, which is equipped with 2400 lines per mm gratings and a Peltier-cooled CCD. A Shimadzu model UV 3600 Plus UV-Vis-NIR spectrophotometer (±1.0 nm resolution) was employed to record the diffuse reflectance spectroscopy (DRS) of the as-prepared phosphor samples within the 200–1000 nm wavelength range. Photoluminescence excitation (PLE) and emission spectra were recorded using a JASCO model FP-8300 spectrofluorometer with ±1.0 nm resolution and Xe as the excitation source. The attenuation curve was captured with the Horiba spectrometer, using a 150 watt microsecond xenon flash lamp for excitation. The internal quantum efficiency (IQE) and external quantum efficiency (EQE) were measured with a Horiba Scientific QuantaPhi-2 equipped with an integrating sphere coated with BaSO4. The Commission Internationale de l’Éclairage (CIE) 1931 chromaticity coordinates were calculated and plotted based on the emission spectra.
3 Results and discussion
3.1 X-ray diffraction and structural analysis
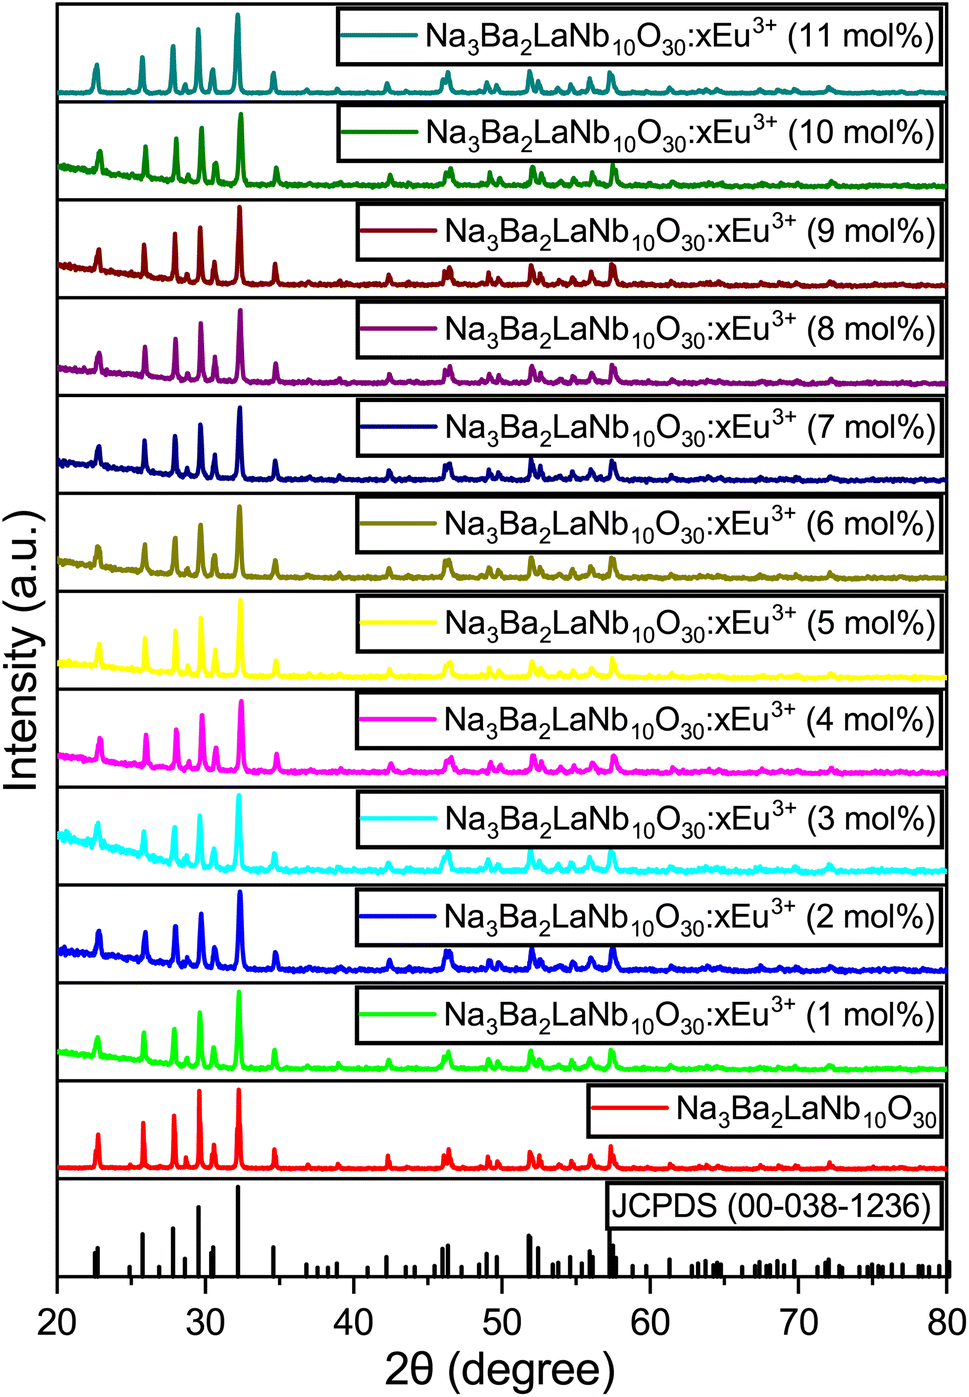
The X-ray diffraction (XRD) patterns for the Na3Ba2LaNb10O30:xEu3+ (x = 0–11 mol%) samples are shown in Fig. 1. These patterns closely resemble that of the Na3Ba2LaNb10O30 tetragonal tungsten bronze structure, with Joint Committee on Powder Diffraction Standards (JCPDS) card no. 00-038-1236. The XRD analysis shows that incorporating Eu3+ ions does not alter the crystal structure of Na3Ba2LaNb10O30. Fig. S1 in the ESI† provides a closer look at a specific portion ((311) plane) of Fig. 1. As the Eu3+ ion concentration increases from 1 mol% to 11 mol%, a slight shift in the main diffraction peak at higher 2θ angles is observed. This propensity is attributed to the smaller radius of Eu3+ compared to the occupied La3+ ion, resulting in lattice contraction. According to the theory of effective cation radius, the incorporation of Eu3+ ions into the host lattice as an activator can be calculated using the formula stated in eqn (2). The percentage difference in radius (Dr) is typically used to assess whether the doped ion can substitute the original cation.| |
 | (2) |
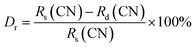
where Rs and Rd are the radii of the substituted cation and the doped Eu3+ ion, respectively, at the given coordination number (CN).33 The ionic radii of cations with a coordination number of six are as follows: Na1+ (Rs = 1.020 Å), Ba2+ (Rs = 1.350 Å), La3+ (Rs = 1.032 Å), Nb5+ (Rs = 0.640 Å), and the doped ion Eu3+ (Rd = 0.947 Å). The calculated Dr values are 7.16%, 29.85%, 8.24%, and −47.97%, respectively. Considering that both La3+ and Eu3+ share the same number of valence states and similar ionic radii, it is likely that Eu3+ replaces La3+ and occupies the same site. Among all the cations, Na1+ and La3+ are the closest ions to being replaced by the Eu3+ ion. Since both La3+ and Eu3+ exist in a trivalent oxidation state, Eu3+ ions would occupy the site of La3+ ions. Eu3+ will not substitute for Na1+ as this would lead to a chemically non-equivalent substitution, resulting in an excess positive charge in the host lattice.
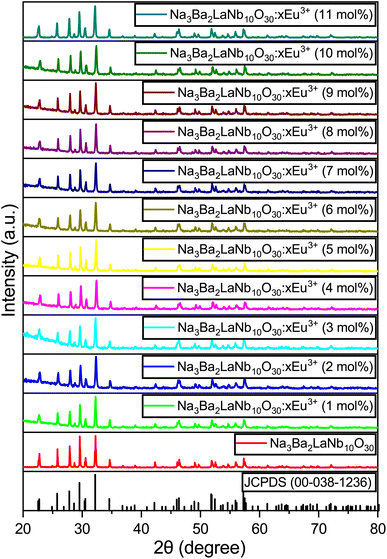 |
| | Fig. 1 XRD patterns of JCPDS 00-038-1236 and Na3Ba2LaNb10O30:xEu3+ (x = 0–11 mol%) phosphors. | |
The Na3Ba2LaNb10O30 compound features a filled tetragonal tungsten bronze structure, crystallizing within the P4bm space group. The general formula of the tungsten bronze structure compound is [(A1)2(A2)4]C4[(B1)2(B2)8]O30. This structure includes three types of crystal sites: six A sites, ten B crystal sites (the B sites are located in the center of the [BO6] octahedra), and one C interstitial site (usually vacant).34 In this structure, the two A1 sites are filled with Na1+ and La3+, while the four A2 sites are filled by two Na1+ and two Ba2+. All the B sites are populated by Nb5+ (Table 1).
Table 1 Each cation with its corresponding coordination numbers and crystal sites for Na3Ba2LaNb10O30
| Elements |
Na |
Ba |
La |
Nb |
| Coordination number |
12, 15 |
15 |
12 |
6 |
| Crystal site |
A1, A2 |
A2 |
A1 |
B |
The crystallite size of the powder sample can be estimated from the XRD patterns by analyzing the full-width at half-maximum (FWHM) and the Bragg diffraction angle. This estimation is done using the Debye–Scherrer formula for hkl (311 plane):
| |
 | (3) |
In this formula,
D represents the average crystallite size,
K is the shape factor (commonly around 0.94),
λ is the X-ray wavelength (1.5406 Å for Cu
Kα radiation),
βhkl is the FWHM, and
θ is the Bragg diffraction angle. The micro-strain (
ε) and crystallite size (
D) of the Na
3Ba
2LaNb
10O
30:
xEu
3+ (
x = 0, 3, 6 and 9 mol%) phosphors were also estimated using the Williamson–Hall (W–H) plot formalism.
35 The W–H plot is represented by the following equation:
| |
 | (4) |
Here, the parameter
K is 0.94,
D is the average crystallite size, 2
θ is the diffraction angle associated with the XRD peaks, and
βhkl is the full width half maximum (FWHM) of the diffraction peaks. Parameters
ε and
λ correspond to the lattice micro-strain of the phosphor samples and the wavelength of the Cu
Kα source, respectively. The W–H plots shown in
Fig. 2 produce graphs (straight lines) of
βhklcos
θ (
y-axis) and sin
θ (
x-axis) to find the
D and
ε values for the Na
3Ba
2LaNb
10O
30:
xEu
3+ (
x = 0, 3, 6 and 9 mol%) phosphors. The data in
Table 2 demonstrate that the crystallite size increases with increasing doping concentrations of Eu
3+ ions, whereas the lattice strain first increases and then remains unaffected at higher doping concentrations of Eu
3+ ions.
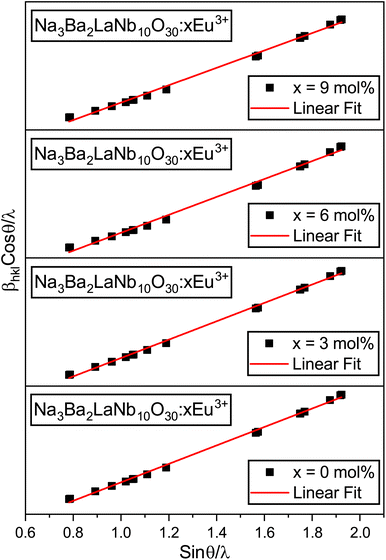 |
| | Fig. 2 Williamson–Hall (W–H) plots of Na3Ba2LaNb10O30:xEu3+ (x = 0, 3, 6 and 9 mol%) phosphors. | |
Table 2 Crystallite size and micro-strain of Na3Ba2LaNb10O30:xEu3+ (x = 0, 3, 6 and 9 mol%) phosphors using Willamson–Hall and Debye–Scherrer formulae
| Eu3+ (mol%) |
Willamson–Hall |
Debye–Scherrer crystallite size, D (nm) |
| Crystallite size, D (nm) |
Micro-strain, ε (strain × 10−3) |
| 0.0 |
68.31 |
0.407221 |
96.91 |
| 3.0 |
84.69 |
0.462166 |
113.29 |
| 6.0 |
93.43 |
0.573583 |
130.73 |
| 9.0 |
118.70 |
0.575917 |
139.21 |
All samples underwent Rietveld refinement using the FullProf Suite software for detailed structural analysis. Linear interpolation was applied in fifteen cycles for background optimization, and the pseudo-Voigt function was used to fit the experimental data for each composition. Fig. 3 illustrates the Rietveld refinement map for the Na3Ba2LaNb10O30 sample, with the related crystal structure parameters listed in Table S1 (ref. 36) of the ESI.† The observed positions of sodium (Na), barium (Ba), lanthanum (La), niobium (Nb), oxygen (O), and europium (Eu) ions showed no change during the refinement process.
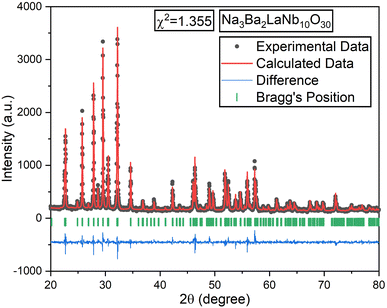 |
| | Fig. 3 Rietveld refinement plot of the un-doped Na3Ba2LaNb10O30 sample. The black and red colored lines represent the experimental and calculated data, respectively. | |
The black dots in refinement map represent the observed intensity data, while the calculated intensity is represented with a red line. The blue line shows the difference between the calculated and observed intensities, and the green vertical lines indicate the Bragg peak positions. The goodness of fit value for each composition, ideally between 1.0 and 2.0, signifies appropriate fit. VESTA software was used to analyze the crystal structure of the host lattice, which contains 121 atoms, 180 bonds, and 25 polyhedra. The complete crystal structure is depicted in Fig. 4.
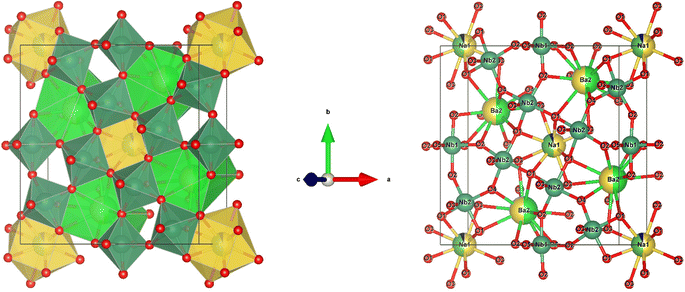 |
| | Fig. 4 Crystal structure of Na3Ba2LaNb10O30 and cation co-ordination spheres of Na1+, Ba2+, La3+/Eu3+ and Nb5+. | |
3.2 Field-emission scanning electron microscopy and energy dispersive X-ray spectroscopy
Fig. 5 presents the 1000-times-magnified surface morphology of the Na3Ba2LaNb10O30:xEu3+ (x = 9 mol%) phosphor. Due to the high-temperature solid-state reaction process used in the preparation, particle clumping was expected, resulting in sizes ranging from a few micrometers to nanometers. The SEM image reveals the irregular shape of the Na3Ba2LaNb10O30:xEu3+ (x = 9 mol%) powder sample, with the sample primarily consisting of solid microcrystals. The particles appear tightly clustered with numerous voids within the agglomerates, likely due to the high surface-area-to-volume ratio. There was no noticeable change in morphology despite variations in dopant ion concentrations. Fig. 6 displays the particle size distribution of the Na3Ba2LaNb10O30:xEu3+ (x = 9 mol%) phosphor, showing primary concentrations around 38.44 and 138.37 nm, with a few larger clusters around 337.62, 439.19, and 712.93 nm due to incomplete grinding and agglomeration of particles at high temperature. In general, LED phosphors feature small particle sizes, typically around 10 μm. LED devices using smaller phosphor particles benefit from reduced light scattering and increased luminous efficiency.37 Consequently, the Na3Ba2LaNb10O30:xEu3+ (x = 9 mol%) phosphor is well-suited for manufacturing wLEDs.38
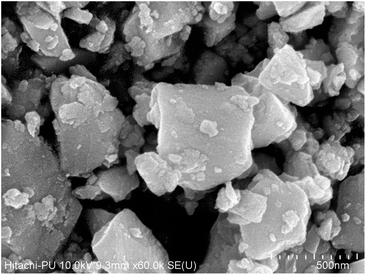 |
| | Fig. 5 FE-SEM micrograph of the Na3Ba2LaNb10O30:xEu3+ (x = 9 mol%) phosphor sintered at 1300 °C. | |
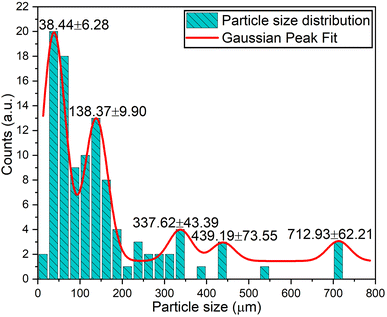 |
| | Fig. 6 Na3Ba2LaNb10O30:xEu3+ (x = 9 mol%) phosphor particle size distribution. | |
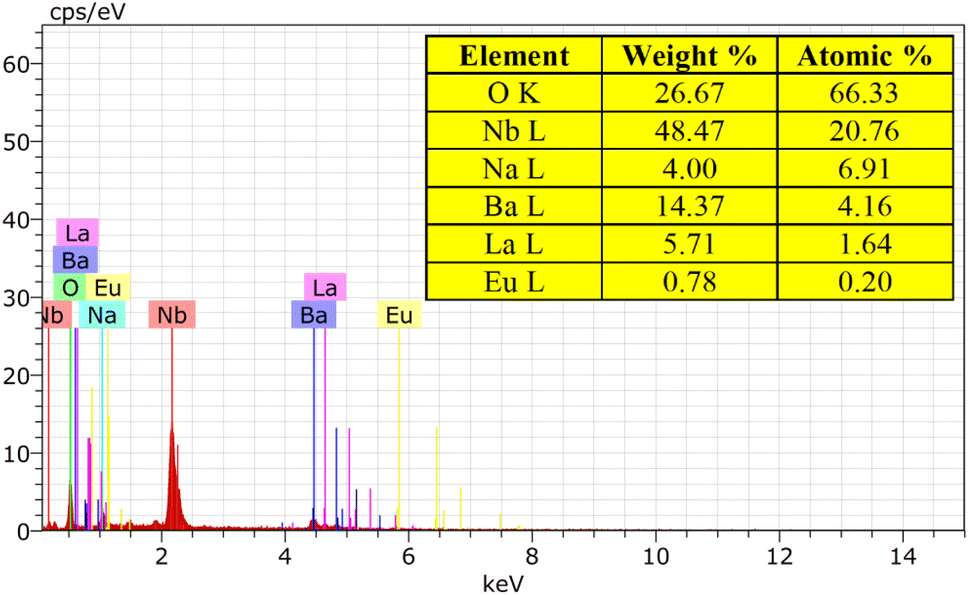
The EDX spectrum and element mapping provide insights into the chemical makeup and the elemental distribution of the sample. EDX is a common technique for assessing the qualitative and quantitative elemental composition in small sample areas. In Fig. 7, the EDX spectrum displays the peaks for the elements sodium (Na), barium (Ba), lanthanum (La), niobium (Nb), oxygen (O), and europium (Eu) present in the sample. Fig. 8 depicts the six elements highlighted in distinct colors, showing that the elements are uniformly distributed across the particles. The atomic percentages in Fig. 7 confirm the presence of 9 mol% Eu3+-doped phosphor agglomerates. These findings confirm the successful synthesis of the Na3Ba2LaNb10O30:xEu3+ (x = 9 mol%) phosphor.
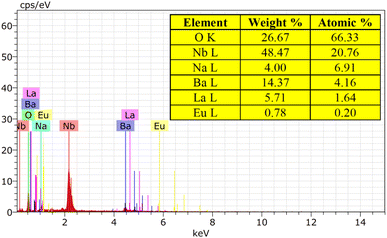 |
| | Fig. 7 EDX spectrum of the Na3Ba2LaNb10O30:xEu3+ (x = 9 mol%) phosphor. | |
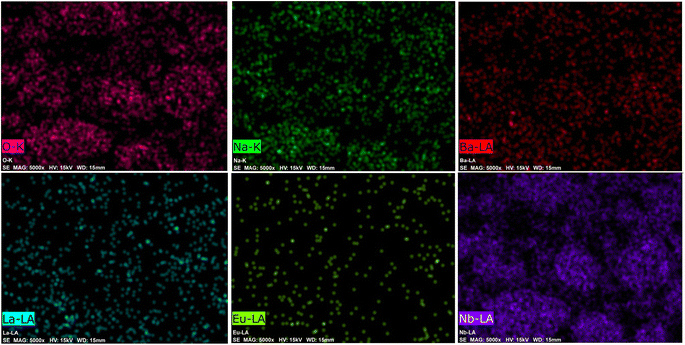 |
| | Fig. 8 Elemental mapping of the Na3Ba2LaNb10O30:xEu3+ (x = 9 mol%) phosphor. | |
3.3 Fourier-transform infrared and Raman spectroscopy
FT-IR spectroscopy is a powerful tool for confirming the quality of a product and is beneficial for preliminary material characterization. The FT-IR spectrum of the Na3Ba2LaNb10O30:xEu3+ (x = 9 mol%) phosphor has been analysed over the wavenumber range of 4000–400 cm−1 to analyze the structural components and functional groups present in the material. Fig. 9 presents the FT-IR spectrum of the synthesized phosphor. The spectrum exhibits eight distinct peaks at approximately 439, 650, 832, 1386, 1635, 1744, 2924, and 3435 cm−1. These peaks have been identified based on previous research. Specifically, the peaks at 439 cm−1 and 832 cm−1 are attributed to Nb–O stretching-mode couplings,39 while the 650 cm−1 peak corresponds to La–O stretching vibrations.40 The peak near 1386 cm−1 is associated with the symmetric stretching of the COO− functional group.41 The peaks at 1635 cm−1 and 3435 cm−1 suggest the presence of water molecules.42 The peak around 1744 cm−1 is linked to C–O stretching modes in free carboxylic groups,43 and the 2924 cm−1 peak likely indicates residual organic materials.44
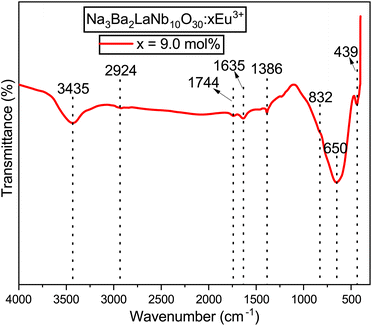 |
| | Fig. 9 Fourier transformed infrared (FT-IR) spectrum of the Na3Ba2LaNb10O30:xEu3+ (x = 9 mol%) phosphor at room temperature. | |
The Raman spectrum of the synthesized Na3Ba2LaNb10O30:xEu3+ (x = 9 mol%) phosphor, in its tetragonal form containing the [NbO6]7− octahedral ion, was recorded at room temperature over the wavenumber range of 0–1600 cm−1, as illustrated in Fig. 10. The spectrum revealed three prominent Raman-active modes: one at 246 cm−1 (ν5), associated with O–Nb–O bending vibrations; another at 641 cm−1 (ν2), attributed to Nb–O stretching vibrations; and a third at 831 cm−1 (ν1), corresponding to Nb–O stretching vibrations. These modes are consistent with those typically observed in the tetragonal tungsten bronze structure, characterized by point groups C4v45,46 and C2v.47 In the tungsten bronze structure, the majority of the Raman lines originate from the external vibrations of the oxygen octahedron, with only three characteristic vibrational modes. Thus, the Raman spectrum of Na3Ba2LaNb10O30 can be discussed in terms of internal vibrations of the (NbO6) octahedra and external vibrations involving Na1+, Ba2+, and La3+ cations. As shown in Fig. 10, there are peaks at 110 cm−1, 183 cm−1, 531 cm−1, 721 cm−1, 1267 cm−1, 1329 cm−1, and 1405 cm−1, attributed to external vibration modes.
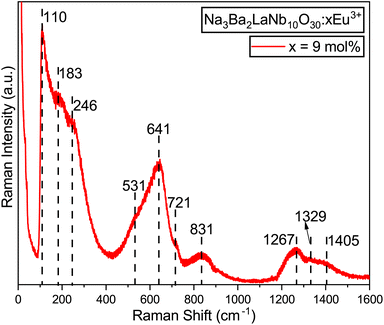 |
| | Fig. 10 Raman spectrum of the Na3Ba2LaNb10O30:xEu3+ (x = 9 mol%) phosphor at room temperature. | |
3.4 Bandgap and electronic structure
The diffuse reflectance spectrum of Na3Ba2LaNb10O30:xEu3+ (x = 1–11 mol%) was recorded at room temperature, as depicted in Fig. 11. The optical bandgap (Eg) of Na3Ba2LaNb10O30:xEu3+ (x = 0–11 mol%) can be estimated using eqn (5):48,49| | |
(αabs·hνph)n = A·(hνph − Eg)
| (5) |
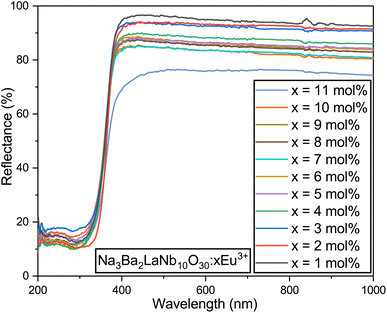 |
| | Fig. 11 Diffuse reflectance spectra of the Na3Ba2LaNb10O30:xEu3+ (x = 1–11 mol%) phosphors. | |
The band gaps of the Na3Ba2LaNb10O30:xEu3+ (x = 0–11 mol%) phosphors are shown in Table 3. The graphs shown in Fig. 12 depict the estimation of these values by extrapolating the photon energy (hν) to the energy axis. These values are influenced by the absorption coefficient (αabs), Planck’s constant (h = 4.1356674335 × 10⁻¹⁵ eV s), constant A, and the semiconductor’s bandgap energy (Eg). Here, νph denotes the photon frequency, and n is a transition-dependent parameter (n = 1/2 for allowed direct electronic transitions and n = 2 for allowed indirect electronic transitions, while n = 3/2 and 3 correspond to forbidden direct and indirect electronic transitions, respectively). An increase in Eu3+ ion concentration in the Na3Ba2LaNb10O30:xEu3+ (x = 0–11 mol%) phosphor results in a red-shift in the optical bandgap, as shown in Fig. 12.
Table 3 Bandgaps of the Na3Ba2LaNb10O30:xEu3+ (x = 0–11 mol%) phosphors
| Eu3+ (mol%) |
Bandgap (eV) |
| 0.0 |
3.3142 |
| 1.0 |
3.3069 |
| 2.0 |
3.3041 |
| 3.0 |
3.3023 |
| 4.0 |
3.3010 |
| 5.0 |
3.2969 |
| 6.0 |
3.2932 |
| 7.0 |
3.2859 |
| 8.0 |
3.2777 |
| 9.0 |
3.2750 |
| 10.0 |
3.2722 |
| 11.0 |
3.2075 |
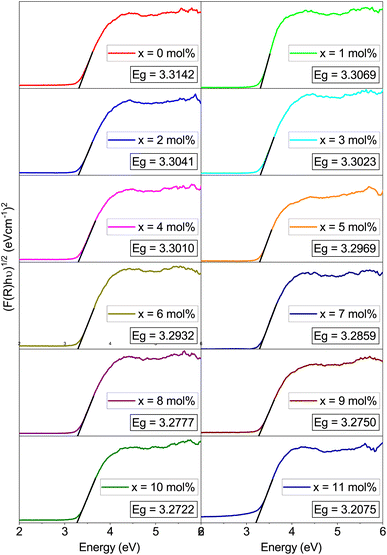 |
| | Fig. 12 Tau plot of Na3Ba2LaNb10O30:xEu3+ (x = 0–11 mol%) phosphors for the determination of optical bandgap Eg (assuming indirect transitions). | |
3.5 Steady-state photoluminescence
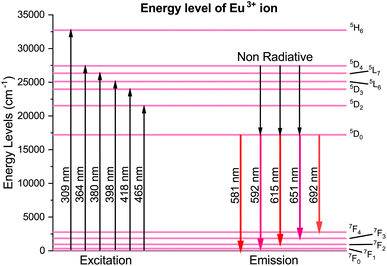
The spectral properties of the Na3Ba2LaNb10O30:xEu3+ (x = 1–11 mol%) matrix have been examined through its photoluminescence excitation (PLE) and photoluminescence emission (PL) spectra to better understand its luminescent behavior. Fig. 13 showcases the excitation spectra of Na3Ba2LaNb10O30:xEu3+ (x = 1–11 mol%) with the emission monitored at 615 nm. Peaks at 309, 364, 380, 398, 418 and 465 nm represent transitions from the 7F0 state to 5H6, 5D4, 5G2, 5L6, 5D3, and 5D2 states, respectively.50 The narrow peaks observed in the range of 350–475 nm are attributed to Eu3+ ion f–f transitions. Strong excitation bands at 398 and 465 nm correspond to the 7F0 → 5L6 and 7F0 → 5D2 transitions, respectively, which align with those of InGaN and GaN chips. Additionally, the 380 and 418 nm peaks correlate with the 7F0 → 5G2 and 7F0 → 5D3 transitions. The optimal excitation wavelength is observed to be 398 nm. The PL spectra in Fig. 14 reveal that the emission peaks remain consistent at excitation wavelengths of 398 and 465 nm. The strongest excitation intensity occurs at 398 nm, making it the best choice for emission spectrum testing. Hence, from this analysis it can be said that the synthesised phosphor shows significant applications in near-ultraviolet (398 nm) and blue-light (465 nm) chips.
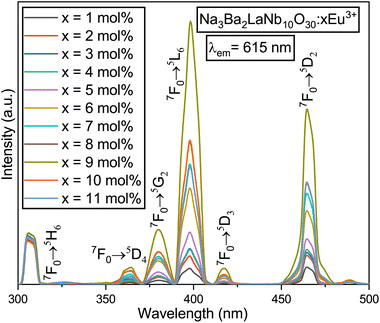 |
| | Fig. 13 PLE spectra of the Na3Ba2LaNb10O30:xEu3+ (x = 1–11 mol%) phosphors, fixing the emission at 615 nm. | |
 |
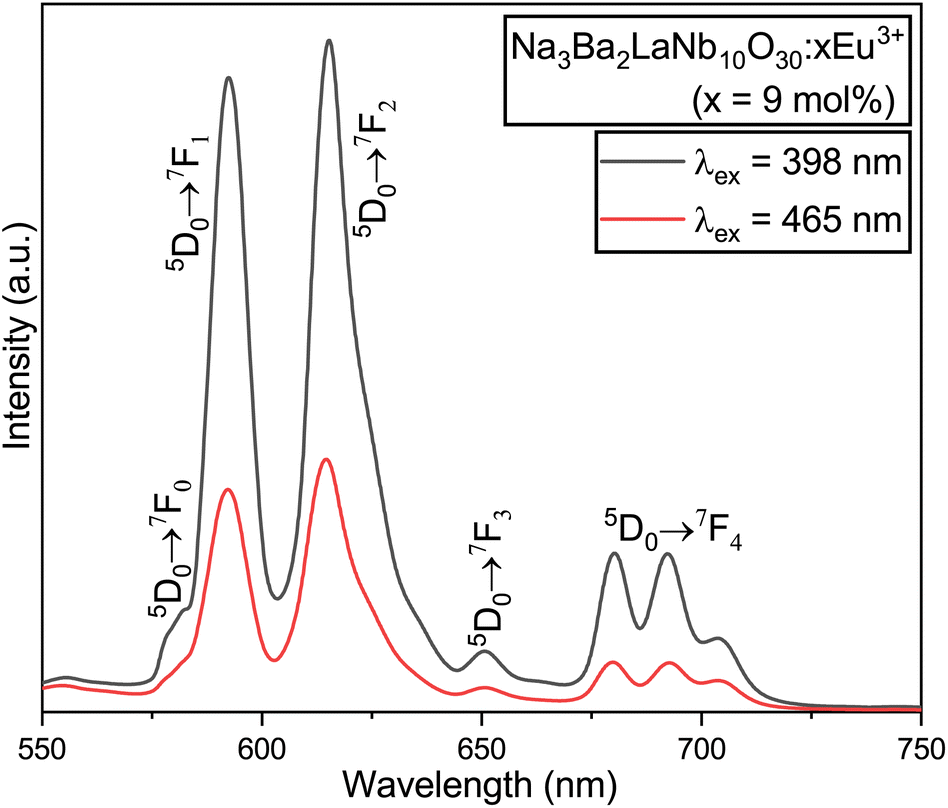
| | Fig. 14 Comparative PL emission spectra of the Na3Ba2LaNb10O30:xEu3+ (x = 9 mol%) phosphor under the excitation wavelengths of both 398 and 465 nm. | |
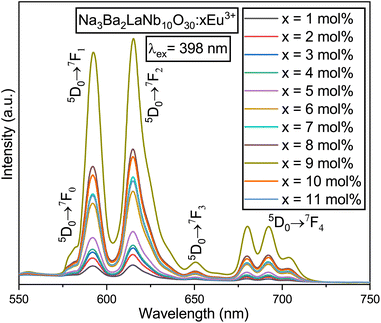
Fig. 15 presents the emission spectra of the Na3Ba2LaNb10O30:xEu3+ (x = 1–11 mol%) phosphors under 398 nm excitation. With the increase in Eu3+ ion concentration, the positions of the peaks remain unaffected. The emission range spans 550–750 nm and contains sharp peaks representing the characteristic emissions of Eu3+ ions. The most prominent peak was found in the range of 603–643 nm, centered at 615 nm, and is linked to the 5D0 → 7F2 transition of the Eu3+ ion. Other transitions include 5D0 → 7F0, 5D0 → 7F1, 5D0 → 7F3, and 5D0 → 7F4, located at 581, 592, 651, and 692 nm, respectively.38
 |
| | Fig. 15 PL emission spectra of the Na3Ba2LaNb10O30:xEu3+ (x = 1–11 mol%) phosphors under the excitation wavelength of 398 nm. | |
The peak at 615 nm (5D0 → 7F2) is characterized by a forced electric dipole (ED) transition. Conversely, the peak at 592 nm (5D0 → 7F1) is associated with the magnetic dipole (MD) transition of the Eu3+ ion. The forced ED transition, specifically 5D0 → 7F2, is highly sensitive to the surrounding ions. The asymmetry ratio (R21), which is the ratio of the integrated red to orange emission intensities (ED/MD), serves as an indicator of the site symmetry of the activator (Eu3+) ions. This ratio, R21, can be expressed as follows:51
| |
 | (6) |
The asymmetry ratio (
R21), which is the ratio of the integrated red (
R2) to orange (
R1) emission intensities (ED/MD), serves as an indicator of the site symmetry of the activator (Eu
3+) ions. The
R21 ratios for the phosphors were found to be 1.496 and 1.598 at the excitation wavelengths of 398 and 465 nm, respectively. These
R21 values suggest a high degree of asymmetry around the Eu
3+ ions, with the red emission intensity being more prominent than the orange-red emission intensity. This may be attributed to the fact that the Eu
3+ ions are situated at a low-symmetry site that lacks an inversion center.
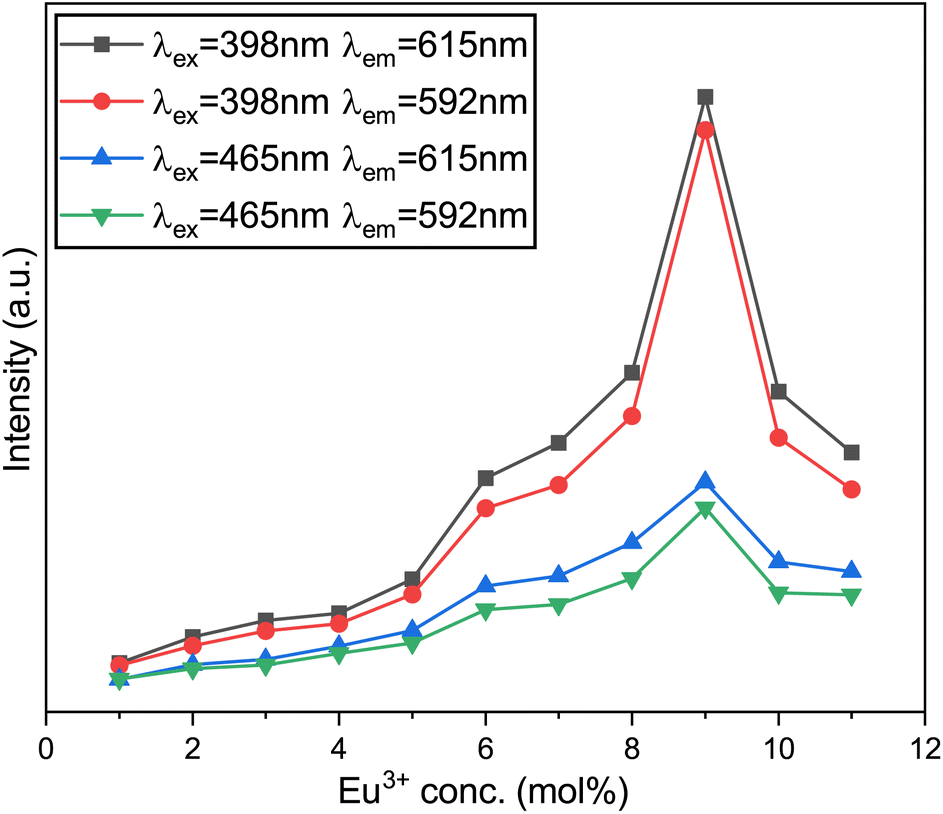
The excited state is released to 5D0 through non-radiative transitions,24 ultimately leading to radiative transitions from 5D0 to 7F0, 7F1, 7F2, 7F3, and 7F4 energy states. Fig. 14 illustrates five characteristic peaks in each PL spectrum curve, with the most prominent at 615 nm, corresponding to the 5D0 → 7F2 transition of the Eu3+ ions. The Na3Ba2LaNb10O30:xEu3+ (x = 1–11 mol%) phosphors exhibit peak luminescence intensity at 9 mol% Eu3+ doping concentration. Beyond this threshold, the intensity begins to decrease, as depicted in Fig. 16. This quenching is primarily caused by non-radiative energy transfer among Eu3+ ions. Although the Eu3+ ions primarily occupy La3+ sites, some may also be present at Na1+ sites due to the similar ionic radii of Eu3+ and Na1+ ions.23 At a high concentration of dopants, the non-equivalent substitution can create defects and increase non-radiative transitions. Choosing a substrate with longer bond lengths between the cations and the main lattice coordination atoms can reduce energy transfer among Eu3+ ions at high doping levels. This strategy allows high-concentration Eu3+-doped phosphors to handle high-power excitation, which benefits wLED applications.
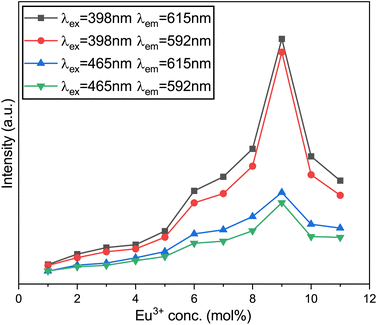 |
| | Fig. 16 Variation of the emission intensity of the emission peaks at various Eu3+-ion concentrations. | |
3.6 Effect of europium doping concentration
Non-radiative energy transfer among Eu3+ ions plays a major role in concentration quenching due to three mechanisms: exchange interaction, radiative reabsorption, and electric multipole interaction.52 Increasing the Eu3+ ion concentration results in reduced distances between Eu3+ ions and intensified non-radiative transitions. The critical transfer distance (Rc) is an important parameter to understand energy transfer between activator ions, using the Blasse formula:53| |
 | (7) |
The calculated Rc is 23.45 Å, based on a unit cell volume (V) of 607.7981 (Å3), a critical concentration (χc) of 9 mol%, and a cation count (N) of 1.32 The short critical distances (<5 Å) needed for exchange interactions suggest that this mechanism is not viable for energy transfer among Eu3+ activators. The dominant interaction in concentration quenching is multipolar. To explore this further, the Dexter formula (8) can be applied:| |
 | (8) |
In this equation, I represents the emission intensity and x denotes the ion concentration under identical excitation conditions.26 Constants K and β are involved, and Q represents the multipole–multipole interaction function.27 The equation can be approximated to:| |
 | (9) |
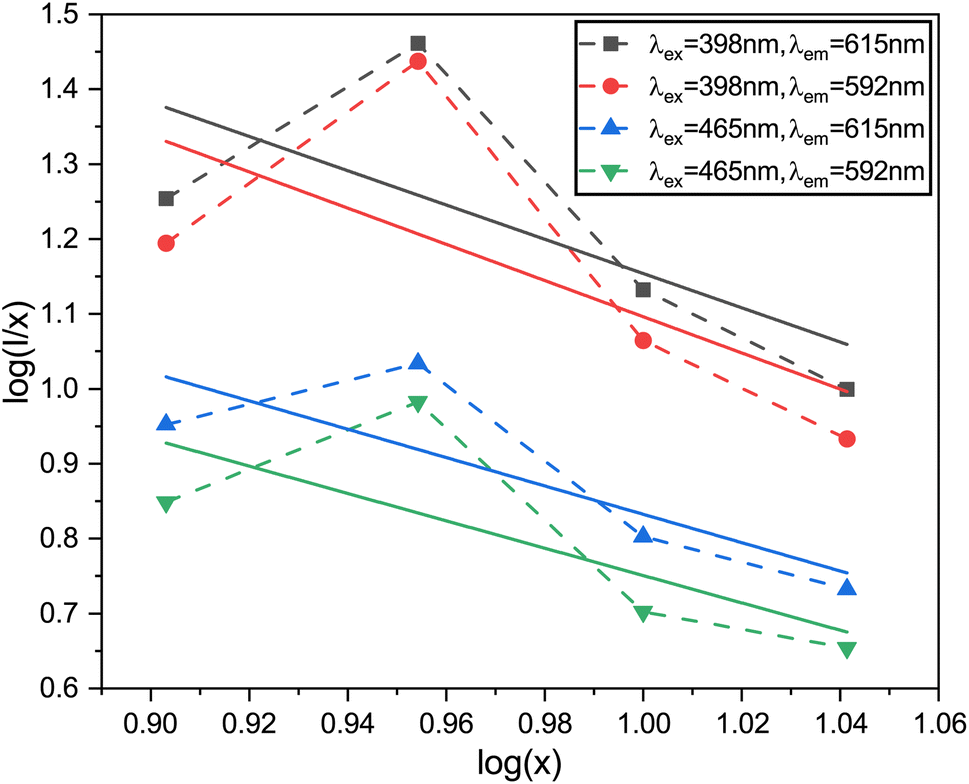
The logarithmic plot of log(I/x) against log(x) in Fig. 17 demonstrates a linear relationship. The Q value characterizes the multipolarity of the electric interaction between adjacent activator ions. The multipolar character function Q can take values of 3, 6, 8, and 10, corresponding to the interaction mechanisms of nearest-neighbor, dipole–dipole (d–d), dipole–quadrupole (d–q), and quadrupole–quadrupole (q–q), respectively. The slopes of the fits with varying excitation and emission wavelengths come out as −2.29, −2.42, −1.89 and −1.83, yielding Q values of 6.87, 7.29, 5.67 and 5.49, respectively, which come out to be closest to 6. This analysis of the Na3Ba2LaNb10O30:xEu3+ (x = 1–11 mol%) phosphors shows that quenching of Eu3+ emission centers is caused by dipole–dipole (d–d) interactions. As the Eu3+ ion concentration increases in the Na3Ba2LaNb10O30 lattice, the probability of non-radiative transitions increases, thereby strengthening the likelihood of concentration quenching beyond 9 mol%, leading to a progressive decrease in photoluminescence intensity.
 |
| | Fig. 17 The linear-fitting plots of various emission peaks, between log(I/x) and log(x). | |
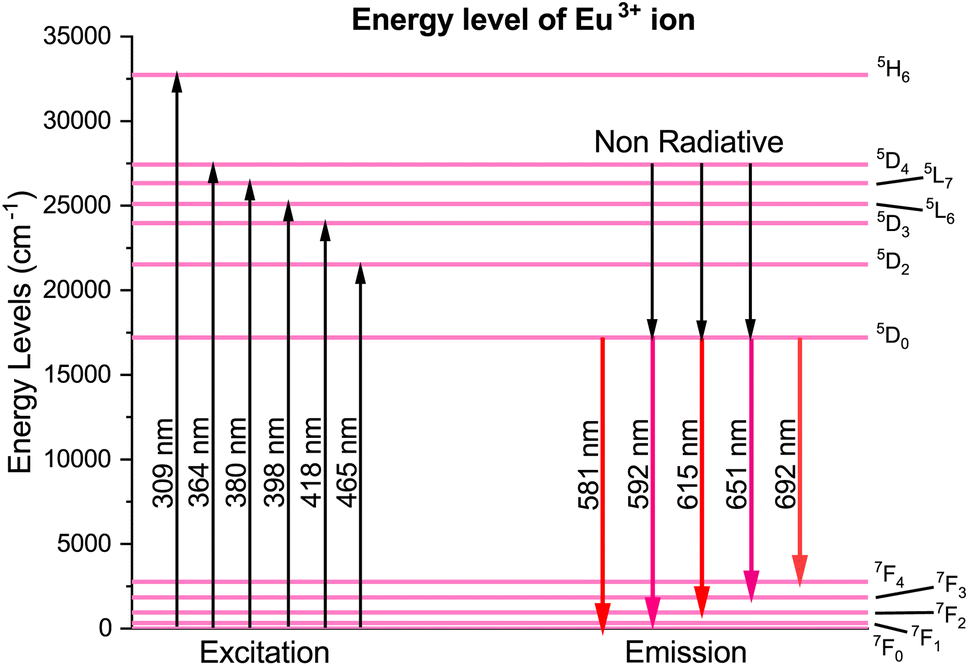
The energy-level diagram in Fig. 18 provides insights into the luminescence properties of Eu3+ ions, explained by the photoluminescence emission and excitation spectra. Excitation at wavelengths of 309, 364, 380, 398, 418, and 465 nm enables electron transitions to an excited state. These electrons subsequently transition non-radiatively to metastable 5D0 via multiphonon processes. Beyond this level, the spacing between energy levels becomes negligible, leading to energy transfer primarily through non-radiative transitions. The rate of phonon emission (w) can be determined using eqn (10):
where
KB is the Boltzmann constant,
E is the energy gap, and
hνmax is the maximum energy of the phonons. From there, electrons transition to lower energy states (
7F
0,
7F
1,
7F
2,
7F
3, and
7F
4), emitting photons in the process. This excited state is released from
5D
0 through non-radiative transitions,
24 ultimately leading to radiative transitions from
5D
0 to
7F
0,
7F
1,
7F
2,
7F
3, and
7F
4 energy states.
 |
| | Fig. 18 Partial energy-level diagram of Eu3+in the Na3Ba2LaNb10O30 phosphor. | |
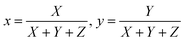
3.7 CIE chromaticity coordinates
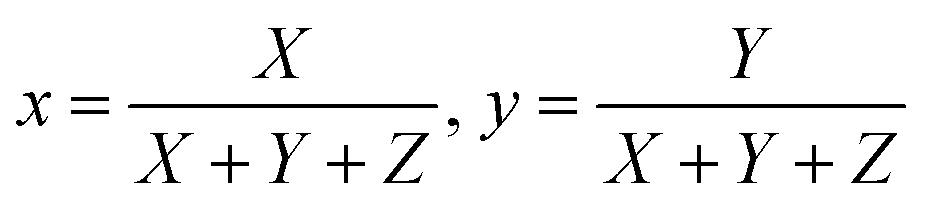
CIE chromaticity coordinates, derived from emission spectra, serve as an essential metric for assessing phosphor luminescence performance. Fig. 19 shows the CIE chromaticity coordinates of the Na3Ba2LaNb10O30:xEu3+ (x = 1–11 mol%) phosphors at an excitation wavelength of 398 nm, which fall within the red region on the CIE 1931 chromaticity diagram. Meanwhile, Fig. S2 in the ESI† displays the diagram of the Na3Ba2LaNb10O30:xEu3+ (x = 1–11 mol%) phosphors at an excitation wavelength of 465 nm. The variables x and y represent the chromaticity coordinates in the CIE 1931 color space, and they are derived as follows:| |
 | (11) |
Here, X, Y, and Z denote the tristimulus values for the three primary colors, namely red, green, and blue, respectively. The correlated color temperature (CCT) concept, as explained by Khan et al.,54 associates the color of light with that emitted by a black body at a specific temperature, measured in Kelvin. The calculation of the CCT utilizes McCamy’s empirical formula,55 represented by eqn (12):| | |
CCT = −449n3 + 3525n2 − 6823.3n + 5520.33
| (12) |
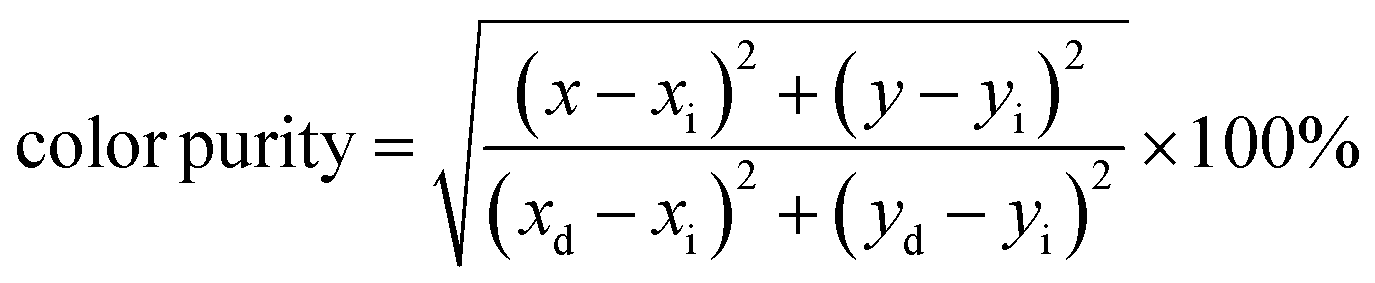
Here, with an epicenter of (xe = 0.332, ye = 0.186),  denotes the inverse slope line. Table 4 presents the color coordinates, CCT and color purity of the Na3Ba2LaNb10O30:xEu3+ (x = 1–11 mol%) phosphors at different concentrations and varying excitation wavelengths. The color purity of the Na3Ba2LaNb10O30:xEu3+ (x = 1–11 mol%) phosphors at excitation wavelengths of 398 and 465 nm is calculated using eqn (13):
| |
 | (13) |
In this context, the variables (x, y) represent the CIE coordinates of the prepared phosphors, while (xd, yd) signify the coordinates corresponding to the dominant wavelength (λd). Additionally, (xi, yi) stand for the CIE coordinates of the reference white light. Calculations show that the Na3Ba2LaNb10O30:xEu3+ (x = 1–11 mol%) phosphors exhibit high color purity, in the range of 97.98% to 99.93%. Fig. S3 in the ESI† shows a notable change in the chromaticity coordinates (x, y) as the doping concentration increases. The coordinate deviations Δx and Δy are measured as 0.01829 and 0.01814, respectively, indicating a significant impact on color stability, leading to color tunability from the Eu3+ dopant concentration. Similarly, Fig. S4 in the ESI† shows the chromaticity coordinates (x, y) of the Na3Ba2LaNb10O30:xEu3+ (x = 1–11 mol%) phosphors with an excitation wavelength of 465 nm, with coordinate deviations of Δx and Δy measured to be 0.01563 and 0.01581, respectively, showing color tunability with varying Eu3+ ion concentration.56 This change in chromaticity coordinates (x, y) with varying concentration leads to color tunability from orangish-red to bright red. The results demonstrate that the Na3Ba2LaNb10O30:xEu3+ (x = 1–11 mol%) phosphors display excellent color purity and stability. The prepared phosphors exhibit better color purity than commercial red phosphors such as Y2O3:Eu3+, Y2O2S:Eu3+(87.2%), K2SiF6:Eu3+, Ca3B2O6:Eu3+(90%),57 and La2Mo2O9:Eu3+(93.1%).
 |
| | Fig. 19 CIE 1931 chromaticity diagram showing the color coordinates of the Na3Ba2LaNb10O30:xEu3+ (x = 1–11 mol%) phosphors under the excitation wavelength of 398 nm. | |
Table 4 CIE coordinates, correlated color temperature (CCT), color purity and average decay time for the Na3Ba2LaNb10O30:xEu3+ (x = 1–11 mol%) phosphors at excitation wavelengths of 398 and 465 nm
| λex (nm) |
Eu3+ (mol%) |
CIE coordinates |
CCT (K) |
Color purity (%) |
Average decay time (μs) |
| x |
y |
| 398 |
1.0 |
0.56413 |
0.43093 |
1837.873 |
97.98 |
806.819 ± 24.296 |
| |
2.0 |
0.57725 |
0.41791 |
1716.026 |
98.51 |
704.667 ± 12.181 |
| |
3.0 |
0.58594 |
0.40929 |
1659.469 |
99.52 |
695.745 ± 12.909 |
| |
4.0 |
0.58622 |
0.40901 |
1658.014 |
99.61 |
672.311 ± 10.898 |
| |
5.0 |
0.59454 |
0.40076 |
1627.013 |
98.79 |
666.847 ± 25.750 |
| |
6.0 |
0.60701 |
0.38838 |
1631.146 |
99.51 |
591.919 ± 12.122 |
| |
7.0 |
0.61113 |
0.38430 |
1648.267 |
99.27 |
472.388 ± 38.566 |
| |
8.0 |
0.61449 |
0.38097 |
1668.832 |
98.83 |
374.265 ± 44.661 |
| |
9.0 |
0.62182 |
0.37368 |
1736.505 |
99.68 |
342.850 ± 21.262 |
| |
10.0 |
0.61431 |
0.38114 |
1667.607 |
98.77 |
307.658 ± 44.761 |
| |
11.0 |
0.60882 |
0.38659 |
1637.606 |
98.53 |
111.552 ± 32.831 |
| 465 |
1.0 |
0.56332 |
0.43173 |
1846.589 |
99.66 |
— |
| |
2.0 |
0.57550 |
0.41964 |
1729.909 |
99.81 |
— |
| |
3.0 |
0.58064 |
0.41455 |
1691.404 |
99.62 |
— |
| |
4.0 |
0.58521 |
0.41001 |
1663.349 |
99.28 |
— |
| |
5.0 |
0.59152 |
0.40375 |
1635.460 |
99.55 |
— |
| |
6.0 |
0.60197 |
0.39339 |
1621.347 |
99.51 |
— |
| |
7.0 |
0.60467 |
0.39070 |
1625.135 |
98.76 |
— |
| |
8.0 |
0.60831 |
0.38710 |
1635.609 |
99.93 |
— |
| |
9.0 |
0.61273 |
0.38271 |
1657.308 |
99.78 |
— |
| |
10.0 |
0.60687 |
0.38852 |
1630.710 |
99.46 |
— |
| |
11.0 |
0.60375 |
0.39262 |
1622.634 |
98.51 |
— |
3.8 Lifetime analysis
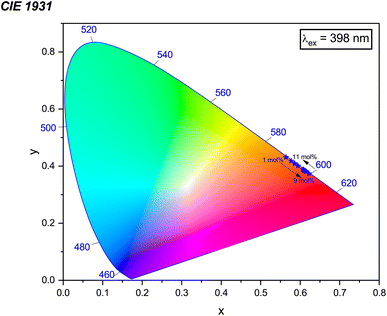
The phenomenon responsible for the prolonged decay time is schematically illustrated in Fig. 20. The Eu3+ ion acts as an effective trapping agent, and the formation of these traps is a primary cause of the extended decay time. Furthermore, the luminescence intensity of the phosphor is influenced by the density of trapped electrons, while the luminescence duration is affected by the depth of these traps. When phosphor materials are exposed to radiation, charge carriers are excited and transition to a higher-energy conduction band, as depicted by process (a) in Fig. 20. These charge carriers have two potential pathways to occupy the luminescence centers formed by Eu3+ ions. One pathway involves the direct approach of charge carriers to the luminescence centers via the host conduction band, as shown in process (b). However, a portion of the excited charge carriers becomes confined in electron traps, as indicated by process (c), storing part of the excitation energy. These trapped electrons do not immediately return to the ground state, but are released from the traps due to thermal excitation at appropriate temperatures and transferred to the luminescence centers via the host lattice. At these luminescence centers, characteristic emissions of Eu3+ are observed, as depicted by process (d). In physical systems, the numbers of electron and hole traps may not be exactly equal, leading to the characteristic luminescence.
 |
| | Fig. 20 Schematic diagram illustrating the luminescence mechanism in the Na3Ba2LaNb10O30:Eu3+ phosphor. | |
Fig. 21 displays the fluorescence attenuation curve of the Na3Ba2LaNb10O30:xEu3+ (x = 1–11 mol%) phosphors, highlighting the energy transfer among Eu3+ ions. The double-decay exponential function indicates the presence of a single emission center within the crystal structure of Na3Ba2LaNb10O30. Fig. S5 in the ESI† shows that the curve aligns well with the fit line, with a fitting degree (χ2) of 0.999, confirming the fitting’s accuracy. Eqn (14) is used to fit the attenuation curve and determine the phosphor’s lifetime:
| |
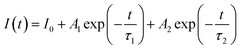 | (14) |
In this equation,
I0 and
I(
t) represent the phosphorescence intensities at the initial time (
t = 0) and at a later time
t, respectively.
A1 and
A2 are fitting constants, while
τ1 and
τ2 correspond to the fast and slow decay lifetimes. The calculation of
τavg for various Eu
3+ doped Na
3Ba
2LaNb
10O
30 phosphors was performed using
eqn (15):
58| |
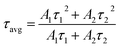 | (15) |
Table 4 presents a summary of the average decay time
τavg for the different Eu
3+-doped Na
3Ba
2LaNb
10O
30 phosphors. From the curve, it is evident that there is energy transfer among Eu
3+ ions, as the fluorescence decay slows down and the lifetime lengthens with increasing Eu
3+ concentration.
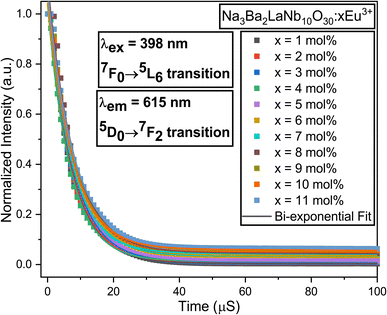 |
| | Fig. 21 Decay curves for the 4F9/2 → 6H13/2 transition in the Na3Ba2LaNb10O30:xEu3+ (x = 1–11 mol%) phosphors. | |
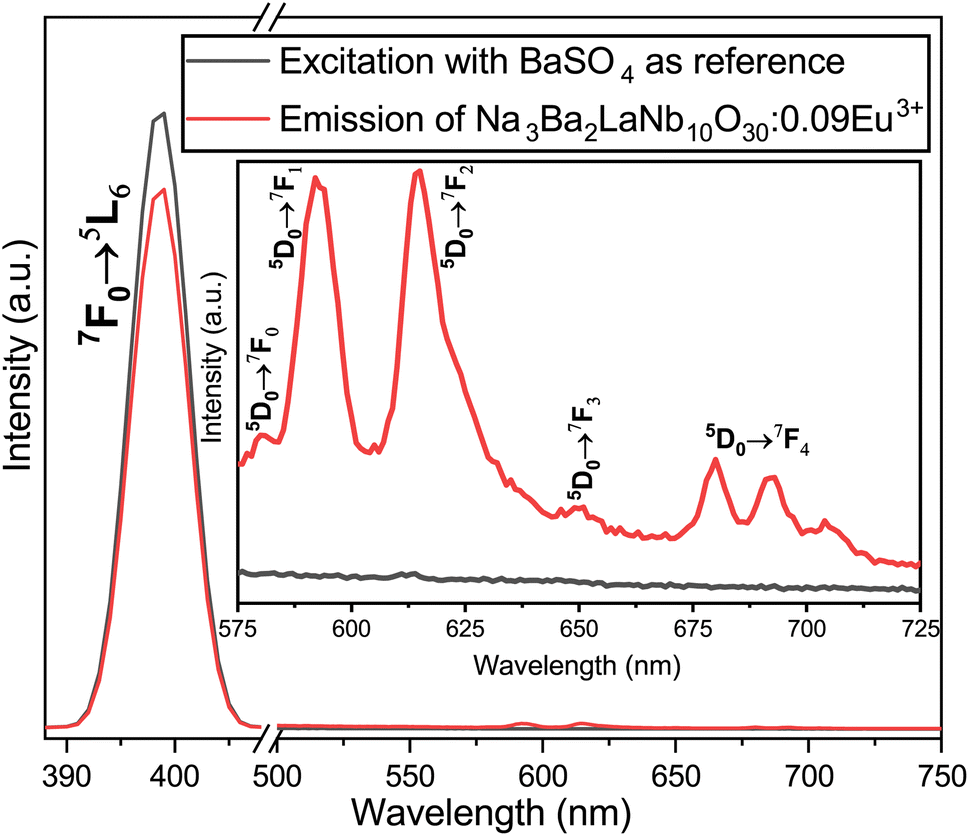
3.9 Internal quantum efficiency (IQE) and external quantum efficiency (EQE)
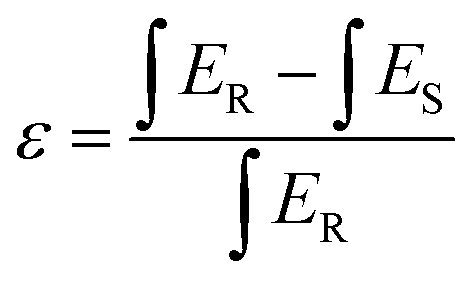
The internal quantum efficiency (IQE) is crucial for a phosphor, as it measures the efficiency of converting electrical power into visible optical power. The PLE and PL spectra of the Na3Ba2LaNb10O30:xEu3+ (x = 9 mol%) phosphor and BaSO4 reference, obtained using integrating spheres under 398 nm excitation, are shown in Fig. 22. Enlarged emission spectra are displayed in the inset from 575 to 725 nm. In qualitative terms, the internal quantum efficiency (IQE) represents the ratio between the number of emitted photons and the number of absorbed photons, and the external quantum efficiency (EQE), also referred to as brightness,59 is the ratio of emitted to incident photons. The IQE, absorption efficiency (ε), and EQE are calculated using eqn (16)–(18):| |
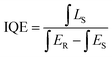 | (16) |
| |
 | (17) |
Here, LS represents the sample’s emission spectrum, while ES and ER represent the excitation light spectra obtained with and without samples in the integrating sphere, respectively.60 Additionally, ε denotes the absorption rate. The calculated IQE reaches as high as 78.26%, with an absorption rate (ε) of 12.78% and EQE reaching 9.99%. The relatively low EQE might be attributed to the severe aggregation of the Na3Ba2LaNb10O30:xEu3+ (x = 9 mol%) phosphor particles. This issue could be mitigated to some extent by optimizing the preparation procedure. Table 5 summarizes the internal quantum efficiency (IQE) and external quantum efficiency (EQE) of Eu3+ doped phosphors in recent years, which shows significant enhancement from previously reported papers.
 |
| | Fig. 22 Excitation and emission spectra of the Na3Ba2LaNb10O30:xEu3+ (x = 9 mol%) phosphor and BaSO4 reference using an integrating sphere for IQE measurement. Inset: enlarged emission spectra (575–725 nm). | |
Table 5 IQE and EQE of Na3Ba2LaNb10O30:Eu3+ and some other reported materials
| Phosphor |
IQE% |
EQE% |
Ref. |
| Na3Ba2LaNb10O30:Eu3+ |
78.26 |
9.99 |
This work |
| Na3Sc2(PO4)3:Eu3+ |
49.00 |
— |
61 |
| BaZrGe3O9:Eu3+ |
37.40 |
— |
62 |
| Sr1−xCaxLaMgSbO6:Eu3+ |
57.60 |
— |
63 |
| LiYMgW0·9Mo0·1O6:Eu3+ |
49.90 |
— |
64 |
| Na2GdTi3O10:Eu3+ |
71.00 |
— |
65 |
| Ca10Li(PO4)7:Eu3+ |
75.00 |
— |
66 |
| Na5Zr4Si3P3O24:Eu3+ |
72.14 |
14.59 |
67 |
| Sr2LaNbO6:Eu3+ |
33.51 |
— |
68 |
| Y2O2S:Eu3+ |
35.00 |
— |
69 |
4 Conclusions
The research presented in this paper highlights the successful synthesis and comprehensive characterization of Eu3+-activated Na3Ba2LaNb10O30 phosphors, emphasizing their potential application in white light-emitting diodes (w-LEDs). The high-temperature solid-state synthesis method employed allowed for the effective incorporation of Eu3+ ions into the host lattice, resulting in phosphors with robust structural integrity and enhanced luminescent properties. XRD analysis confirmed the phase purity and crystallinity of the phosphors, while FESEM and EDX provided detailed insights into their morphology and elemental composition. The FT-IR spectra further validated the successful synthesis of the phosphor compounds. Photoluminescence studies revealed that the Na3Ba2LaNb10O30:Eu3+ phosphors exhibit strong red emissions when excited with near-ultraviolet light, with the optimal doping concentration identified as 9 mol%. The internal and external quantum yields were measured, demonstrating high luminescent efficiency. The chromaticity coordinates were calculated, indicating excellent color purity suitable for w-LED applications.
Overall, the findings of this study contribute significantly to the development of advanced phosphor materials for solid-state lighting. The Eu3+-doped Na3Ba2LaNb10O30 phosphors exhibit promising characteristics, including high quantum yield, and excellent color purity, making them ideal candidates for next-generation w-LEDs. Future research could explore the optimization of synthesis parameters and the integration of these phosphors into commercial LED devices to fully realize their potential in lighting applications.
Data availability
Data will be made available on request.
Author contributions
Kanishk Poria: conceptualization, methodology, software, writing – original draft. Sanjana Bhatia: data curation, writing – review & editing. Rajiv Kashyap: validation, writing – review & editing. Vikas Kashyap: formal analysis. Isha Sihmar: resources. Nisha Deopa: supervision, validation, writing – review & editing, formal analysis. Jangvir Singh Shahi: supervision, validation, writing – review & editing, formal analysis.
Conflicts of interest
There are no conflicts to declare.
Acknowledgements
Mr Kanishk Poria acknowledges the Council of Scientific & Industrial Research (CSIR), Government of India, for their financial support through the Senior Research Fellowship (SRF) (File No. 09/135(0901)/2020-EMR-I, dated 01/01/2020). Dr Nisha Deopa thanks the Scientific Engineering Research Board (SERB), Government of India, for their financial support under the SERB-SURE Scheme (Sanction Order No. SUR/2022/005570, dated 20/11/2023). Gratitude is also extended to Chaudhary Ranbir Singh University (CRSU), Jind (Haryana), India, for providing seed funding through the Minor Research Project (MRP) (Letter No. CRSU/IQAC/2023/223, dated 06/04/2023). The authors express their sincere gratitude to the Director of SAIF, Panjab University, Chandigarh, for granting access to the instrumentation facilities.
References
- H. Hu and W. Zhang, Opt. Mater., 2006, 28, 536–550 CrossRef CAS.
- M. Djamal, L. Yuliantini, R. Hidayat, K. Boonin, P. Yasaka and J. Kaewkhao, Mater. Today: Proc., 2018, 5, 15126–15130 CAS.
- L. Fan, Y. Shi, Y. Wu, J. Xie, J. Zhang, F. Lei and L. Zhang, J. Lumin., 2017, 190, 504–510 CrossRef CAS.
- S. Verma, K. Verma, D. Kumar, B. Chaudhary, S. Som, V. Sharma, V. Kumar and H. C. Swart, Phys. B, 2018, 535, 106–113 CrossRef CAS.
- Y. Liu, R. Wang, Q. Yang, G. Li, J. Huang and G. Cai, J. Am. Ceram. Soc., 2022, 105, 6184–6195 CrossRef CAS.
- Y. Liu, X. Liu, W. Wang, B. Zhou and Q. Zhang, Mater. Res. Bull., 2017, 95, 235–242 CrossRef CAS.
- Ravina, K. Poria, M. K. Sahu, A. Kumar, Anu, S. Dahiya, N. Deopa and A. Rao, RSC Adv., 2023, 13, 33675–33687 RSC.
- K. Shinde and S. Dhoble, Crit. Rev. Solid State Mater. Sci., 2014, 39, 459–479 CrossRef CAS.
- M. Shi, L. Yao, J. Xu, C. Liang, Y. Dong and Q. Shao, J. Am. Ceram. Soc., 2021, 104, 3279–3288 CrossRef CAS.
- P. Dang, G. Li, X. Yun, Q. Zhang, D. Liu, H. Lian, M. Shang and J. Lin, Light: Sci. Appl., 2021, 10, 29 CrossRef CAS.
- T. Pulli, T. Dönsberg, T. Poikonen, F. Manoocheri, P. Kärhä and E. Ikonen, Light: Sci. Appl., 2015, 4, e332 CrossRef CAS.
- M.-H. Fang, C. Ni, X. Zhang, Y.-T. Tsai, S. Mahlik, A. Lazarowska, M. Grinberg, H.-S. Sheu, J.-F. Lee and B.-M. Cheng, et al., ACS Appl. Mater. Interfaces, 2016, 8, 30677–30682 CrossRef CAS PubMed.
- J. Chen, Y. Liu, L. Mei, H. Liu, M. Fang and Z. Huang, Sci. Rep., 2015, 5, 9673 CrossRef CAS PubMed.
- X. Chen, P. Dai, X. Zhang, C. Li, S. Lu, X. Wang, Y. Jia and Y. Liu, Inorg. Chem., 2014, 53, 3441–3448 CrossRef CAS PubMed.
- K. Jha, A. K. Vishwakarma, M. Jayasimhadri and D. Haranath, J. Alloys Compd., 2017, 719, 116–124 CrossRef CAS.
- M. Tshabalala, F. Dejene, S. S. Pitale, H. Swart and O. Ntwaeaborwa, Phys. B, 2014, 439, 126–129 CrossRef CAS.
- N. Lakshminarasimhan and U. Varadaraju, J. Electrochem. Soc., 2005, 152, H152 CrossRef CAS.
- Y. Ma, S. Chen, J. Che, J. Wang, R. Kang, J. Zhao, B. Deng, R. Yu and H. Geng, Ceram. Int., 2021, 47, 8518–8527 CrossRef CAS.
- P. Dai, X. Zhang, M. Zhou, X. Li, J. Yang, P. Sun, C. Xu and Y. Liu, J. Am. Ceram. Soc., 2012, 95, 658–662 CrossRef CAS.
- G. K. Behrh, R. Gautier, C. Latouche, S. Jobic and H. Serier-Brault, Inorg. Chem., 2016, 55, 9144–9146 CrossRef CAS PubMed.
- W. Yan, S. Chen, Y. Liu, Z. Gao, Y. Wei and G. Li, ACS Appl. Electron. Mater., 2019, 1, 1970–1980 CrossRef CAS.
- X. Cai, Z. Mu, S. Zhang, D. Zhu, Q. Wang, Y. Yang, D. Luo and F. Wu, J. Lumin., 2018, 200, 169–174 CrossRef CAS.
- W. Dai, M. Zhou, Z. Xian and L. Zeng, RSC Adv., 2014, 4, 25470–25478 RSC.
- Y. Wang, Z. Liang, K. Jiang, Y. Lin, D. He, J. Liu, W. Wang, J. Wang, B. Deng and D. Zhang, et al., Ceram. Int., 2023, 49, 579–590 CrossRef CAS.
- H. Yi, L. Wu, L. Wu, L. Zhao, Z. Xia, Y. Zhang, Y. Kong and J. Xu, Inorg. Chem., 2016, 55, 6487–6495 CrossRef CAS PubMed.
- P. Du and J. S. Yu, Sci. Rep., 2017, 7, 11953 CrossRef PubMed.
- Q. Tang, T. Yang, H. Huang, J. Ao, B. Peng and B. Guo, Optik, 2021, 240, 166908 CrossRef CAS.
- Y. Tong, Y. Chen, S. Chen, R. Wei, L. Chen and H. Guo, Ceram. Int., 2021, 47, 12320–12326 CrossRef CAS.
- P. Wang, L. Schwertmann, R. Marschall and M. Wark, J. Mater. Chem. A, 2014, 2, 8815–8822 RSC.
- C.-J. Chan, F. F. Lange, M. Rühle, J.-F. Jue and A. V. Virkar, J. Am. Ceram. Soc., 1991, 74, 807–813 CrossRef CAS.
- R. Jain, R. Sinha, M. K. Sahu and M. Jayasimhadri, J. Lumin., 2021, 36, 1444–1451 CrossRef CAS PubMed.
- K. Poria, R. Lohan, S. Bhatia, A. Kumar, R. Singh, N. Deopa, R. Punia, J. S. Shahi and A. Rao, RSC Adv., 2023, 13, 11557–11568 RSC.
- X. Ming, Z. Meng, J. Cao, W. Zhenbin and M. Zhang, New J. Chem., 2023, 47, 13929–13937 RSC.
- L. Fang, H. Zhang, J. Yang, F. Meng and R. Yuan, J. Mater. Sci. Lett., 2003, 22, 1705–1707 CrossRef CAS.
- G. Williamson and W. Hall, Acta Metall., 1953, 1, 22–31 CrossRef CAS.
- P. P. Sahoo and T. GuruRow, Inorg. Chem., 2010, 49, 10013–10021 CrossRef CAS PubMed.
- G. B. Nair, H. Swart and S. Dhoble, Prog. Mater. Sci., 2020, 109, 100622 CrossRef CAS.
- A. K. Vishwakarma, K. Jha, M. Jayasimhadri, A. Rao, K. Jang, B. Sivaiah and D. Haranath, J. Alloys Compd., 2015, 622, 97–101 CrossRef CAS.
- S. Jana, A. Mondal, J. Manam and S. Das, J. Alloys Compd., 2020, 821, 153342 CrossRef CAS.
- H. Kabir, S. H. Nandyala, M. M. Rahman, M. A. Kabir and A. Stamboulis, Appl. Phys. A, 2018, 124, 1 CrossRef CAS.
- M. Salavati-Niasari, G. Hosseinzadeh and F. Davar, J. Alloys Compd., 2011, 509, 134–140 CrossRef CAS.
- M. Afqir, A. Tachafine, D. Fasquelle, M. Elaatmani, J.-C. Carru, A. Zegzouti, M. Daoud, S. Sayouri, T.-D. Lamcharfi and M. Zouhairi, Process. Appl. Ceram., 2018, 12, 72–77 CrossRef CAS.
- H. Bruncková, L. Medvecky, P. Hvizdoš, J. Ďurišin and V. Girman, J. Mater. Sci., 2015, 50, 7197–7207 CrossRef.
- I. P. Sahu, D. Bisen, N. Brahme and R. K. Tamrakar, J. Electron. Mater., 2016, 45, 2222–2232 CrossRef CAS.
- M. Bouziane, M. Taibi, L. Saviot and A. Boukhari, Phys. B, 2011, 406, 4257–4260 CrossRef CAS.
- R. E. Wilde, J. Raman Spectrosc., 1991, 22, 321–325 CrossRef CAS.
- A. Boudou and J. Sapriel, Phys. Rev. B: Condens. Matter Mater. Phys., 1980, 21, 61 CrossRef CAS.
- R. López and R. Gómez, J. Sol-Gel Sci. Technol., 2012, 61, 1–7 CrossRef.
- D. Xu, Z. Yang, J. Sun, X. Gao and J. Du, J. Mater. Sci.: Mater. Electron., 2016, 27, 8370–8377 CrossRef CAS.
- F. Kang, Y. Zhang and M. Peng, Inorg. Chem., 2015, 54, 1462–1473 CrossRef CAS PubMed.
- K. Jha and M. Jayasimhadri, J. Am. Ceram. Soc., 2017, 100, 1402–1411 CrossRef CAS.
- L. Cao, W. Li, B. Devakumar, N. Ma, X. Huang and A. F. Lee, ACS Appl. Mater. Interfaces, 2022, 14, 5643–5652 CrossRef CAS PubMed.
- G. Blasse, Phys. Lett. A, 1968, 28, 444–445 CrossRef CAS.
- M. N. Khan, Understanding LED Illumination, CRC Press, 2013 Search PubMed.
- C. S. McCamy, Color Res. Appl., 1992, 17, 142–144 CrossRef.
- S. Xu, D. Zhu, F. Wu, H. Dong, X. Zhang, W. Pang and Z. Mu, Opt. Mater., 2024, 150, 115284 CrossRef CAS.
- I. Charak, M. Manhas, A. Bedyal, S. Singh, A. Srivastava, H. Swart and V. Kumar, J. Alloys Compd., 2021, 869, 159363 CrossRef CAS.
- J. Sun, X. Zhang, Z. Xia and H. Du, Mater. Res. Bull., 2011, 46, 2179–2182 CrossRef CAS.
- P. A. Tanner, L. Zhou, C. Duan and K.-L. Wong, Chem. Soc. Rev., 2018, 47, 5234–5265 RSC.
- X. Huang, Z. Xu and B. Devakumar, Ceram. Int., 2023, 49, 26420–26427 CrossRef CAS.
- H. Guo, X. Huang and Y. Zeng, J. Alloys Compd., 2018, 741, 300–306 CrossRef CAS.
- Q. Zhang, X. Wang, X. Ding and Y. Wang, Inorg. Chem., 2017, 56, 6990–6998 CrossRef CAS PubMed.
- Q. Liu, L. Wang, W. Huang, X. Li, M. Yu and Q. Zhang, Ceram. Int., 2017, 43, 16292–16299 CrossRef CAS.
- Y. Liang, H. M. Noh, W. Ran, S. H. Park, B. C. Choi, J. H. Jeong and K. H. Kim, J. Alloys Compd., 2017, 716, 56–64 CrossRef CAS.
- N. Zhang, C. Guo, L. Yin, J. Zhang and M. Wu, J. Alloys Compd., 2015, 635, 66–72 CrossRef CAS.
- S. Enhai, Z. Weiren, Z. Guoxiong, D. Xihua, Y. Chunyu and Z. Minkang, J. Rare Earths, 2011, 29, 440–443 CrossRef.
- B. Shao, Q. Lv, X. Ma, Y. Li, X. Zhou, C. Wang and Y. Wang, J. Lumin., 2022, 247, 118912 CrossRef CAS.
- Y. Hua, W. Ran and J. S. Yu, Chem. Eng. J. (Amsterdam, Neth.), 2021, 406, 127154 CAS.
- L. Yang, J. Wang, X. Dong, G. Liu and W. Yu, J. Mater. Sci., 2013, 48, 644–650 CrossRef CAS.
|
| This journal is © The Royal Society of Chemistry 2024 |
Click here to see how this site uses Cookies. View our privacy policy here. 
 Open Access Article
 This Open Access Article is licensed under a Creative Commons Attribution-Non Commercial 3.0 Unported Licence
 *a,
Sanjana Bhatiaa,
Rajiv Kashyapab,
Vikas Kashyapa,
Isha Sihmara,
Nisha Deopa
*a,
Sanjana Bhatiaa,
Rajiv Kashyapab,
Vikas Kashyapa,
Isha Sihmara,
Nisha Deopa


 denotes the inverse slope line. Table 4 presents the color coordinates, CCT and color purity of the Na3Ba2LaNb10O30:xEu3+ (x = 1–11 mol%) phosphors at different concentrations and varying excitation wavelengths. The color purity of the Na3Ba2LaNb10O30:xEu3+ (x = 1–11 mol%) phosphors at excitation wavelengths of 398 and 465 nm is calculated using eqn (13):