
 Open Access Article
 This Open Access Article is licensed under a
 Creative Commons Attribution 3.0 Unported Licence
Crystal structure and fluoride-ion conductivity of strontium cerium fluoride epitaxial films prepared by topochemical fluorination†
Akira Chikamatsu *a,
Ayuka Nakanoa,
Miku Hagiwaraa,
Dai Kutsuzawab,
Erika Fukushic,
Hiroyuki Oguchic,
Fumihiko Uesugid,
Tsukasa Katayamaef and
Yasushi Hiroseg
*a,
Ayuka Nakanoa,
Miku Hagiwaraa,
Dai Kutsuzawab,
Erika Fukushic,
Hiroyuki Oguchic,
Fumihiko Uesugid,
Tsukasa Katayamaef and
Yasushi Hiroseg
aDepartment of Chemistry, Faculty of Science, Ochanomizu University, 2-1-1 Otsuka, Bunkyo-ku, Tokyo 112-8610, Japan. E-mail: chikamatsu.akira@ocha.ac.jp
bCentral Research Institute of Electric Power Industry, 2-6-1 Nagasaka, Yokosuka, Kanagawa 240-0196, Japan
cChemistry and Materials Program, College of Engineering, Shibaura Institute of Technology, 3-7-5 Toyosu, Koto-ku, Tokyo, 135-8548, Japan
dNational Institute for Materials Science, 1–2-1 Sengen, Tsukuba, Ibaraki 305-0047, Japan
eResearch Institute for Electronic Science, Hokkaido University, N21W10, Kita, Sapporo, Hokkaido 001-0020, Japan
fJST-PRESTO, 4-1-8 Honcho, Kawaguchi, Saitama 332-0012, Japan
gDepartment of Chemistry, Tokyo Metropolitan University, 1-1 Minami Osawa, Hachioji, Tokyo 192-0397, Japan
First published on 17th July 2025
Abstract
Topochemical fluorination of perovskite SrCeO3 epitaxial thin films using polyvinylidene difluoride was performed at different annealing temperatures (Tf) for 1 h. Fluorite Sr0.5Ce0.5F2.5 epitaxial thin films were obtained at Tf > 350 °C, which exhibited fluoride-ion conductivity with an activation energy of 0.61 eV.
Lithium-ion batteries are presently utilized in a variety of devices ranging from smartphones to electric vehicles. However, the risk of lithium ignition and concerns about long-term supply stability have led to the development of rechargeable batteries using alternative elements. Among them, fluoride-ion batteries (FIBs) are attracting considerable attention owing to their high theoretical energy densities and utilization of fluorine, which is abundant compared to lithium.1–3 FIBs have higher gravimetric and volumetric energy densities than lithium-ion and sodium-ion batteries, enabling the production of lighter and smaller batteries.1,2 Moreover, fluoride ions are highly redox-stable, which provides a wide electrochemical potential window for FIBs to deliver high open circuit voltages.2 However, FIBs also exhibit poor charging and discharging characteristics and relatively high operating temperatures; hence, further fundamental research, including development of new solid-state electrolyte materials, is required to improve the performance of FIBs.
Metal fluorides, alkaline earth fluorides (AF2) with a fluorite structure (Fm![[3 with combining macron]](https://www.rsc.org/images/entities/char_0033_0304.gif) m), and rare earth fluorides (RF3) with a tysonite structure (Pc1), are considered as solid electrolytes for FIBs owing to their fast F-ion conductivities.4,5 Partial cation substitution increases the number of permanent defects in the structure and facilitates fluoride migration, significantly increasing the fluoride conductivity of these solids. For example, tysonite-type Ce0.95Ca0.05F2.95 and Ce0.975Sr0.025F2.975 are fast fluoride-ion conductors with ionic conductivities of ∼10−2 S cm−1 at 573 K and 3 × 10⁻⁴ S cm−1 at room temperature,6,7 respectively.
m), and rare earth fluorides (RF3) with a tysonite structure (Pc1), are considered as solid electrolytes for FIBs owing to their fast F-ion conductivities.4,5 Partial cation substitution increases the number of permanent defects in the structure and facilitates fluoride migration, significantly increasing the fluoride conductivity of these solids. For example, tysonite-type Ce0.95Ca0.05F2.95 and Ce0.975Sr0.025F2.975 are fast fluoride-ion conductors with ionic conductivities of ∼10−2 S cm−1 at 573 K and 3 × 10⁻⁴ S cm−1 at room temperature,6,7 respectively.
Several methods are available for the synthesis of metal fluorides, including solid phase reactions,8 hydrothermal synthesis,9 melt growth techniques,10 and fluorination reactions of metal compound precursors with gaseous agents such as F2 and HF.11 Recently, thin films of fluorite-type Ba0.5Bi0.5F2.5 were synthesized by topochemical fluorination of perovskite-type BaBiO3 precursor films using polyvinylidene fluoride (PVDF), and a maximum conductivity of 3.4 × 10⁻⁷ S cm−1 at 353 K was achieved.12,13 In general, single-crystalline thin films of metal oxyfluorides or fluorides without undesired impurity phases can be prepared through PVDF-mediated topochemical fluorination of metal oxides.12–15
Single-crystal epitaxial films are useful for studying the physical properties of Ce fluorides, which are promising fluorine ion conductors. Since Ce ions exist stably in the crystal as either Ce3+ or Ce4+, reductive fluorination of perovskite SrCeO3 (SCO) epitaxial films with PVDF (which acts as a reducing agent12) can be used to fabricate epitaxial films. In this study, we performed PVDF-mediated topochemical fluorination of perovskite SCO thin films and investigated the crystal structures and fluoride-ion conductivities of the obtained films.
Perovskite SCO precursor films were grown on nonconductive SrTiO3 (100) (STO) and conductive 0.5 wt% Nb-doped STO (Nb:STO) substrates (Shinkosha Co.) by pulsed-laser deposition. The fourth harmonic of a Nd-doped yttrium aluminium garnet laser (wavelength λ = 266 nm) with an energy of 1.9 J per cm2 per shot and a repetition rate of 5 Hz was used as the laser source. The films were deposited at an oxygen partial pressure and substrate temperature of 1 × 10⁻⁵ Torr and 750 °C, respectively. The as-deposited SCO films were annealed at different temperatures (Tf = 100–550 °C) in a tube furnace with the PVDF powder (Fluorochem Ltd.) placed upstream. Ar was used as the carrier gas for fluorination, and the temperature rise time was 1 h. The film thickness, as measured using a stylus surface profiler (Veeco Dektak 6 M), was 60–80 nm.
The crystal structures of the films were examined using X-ray diffraction (XRD; Bruker AXS D8 Discover; Cu Kα radiation) and scanning transmission electron microscopy (STEM) with energy dispersive X-ray spectroscopy (EDS; JEM-ARM200F-B, JEOL) operated at an acceleration voltage of 200 kV. A focused ion beam instrument (NB5000, Hitachi High-Tech) was used to prepare thin samples for the STEM measurements. The chemical compositions of the films were investigated by scanning electron microscopy–energy dispersive X-ray spectroscopy (SEM-EDS; JEOL JSM-7100F and JED-2300, respectively). The core-level spectra of the films at 300 K were obtained using X-ray photoemission spectroscopy (XPS) with an Al Kα X-ray source and a charge-neutralizing flood gun (Thermo Fisher Scientific K-Alpha). The Fermi level was calibrated against the C 1s signal. The in-plane and out-of-plane F-ion conductivities were obtained using AC impedance measurements at 5 MHz–10 mHz and 5 MHz–10 Hz, respectively. An in-plane electrode was comb-shaped Pt patterns sputtered onto the film using a SUS shadow mask. Out-of-plane measurements used a 200-μm Pt top electrode and the Nb:STO substrate as the bottom electrode, respectively. The schematic diagrams of the crystal structures were drawn using the VESTA software.16
Fig. 1 shows the XRD patterns of the SCO precursor film and fluorinated films. The XRD pattern of the precursor film exhibited peaks corresponding to (001) and (002) planes of perovskite SCO at 2θ = 20.7 and 42.1°, respectively. The XRD patterns were unchanged at Tf ≤ 200 °C, indicating that PVDF did not react with the SCO film up to 200 °C. The films fluorinated at Tf = 250 °C exhibited a new peak at 2θ = 31.7°, which corresponds to the 002 plane of the fluorite structure. Thus, the perovskite and fluorite structures were mixed at Tf = 250 °C. At Tf = 300 °C, two additional peaks appeared at 2θ = 30.5 and 63.4°, respectively. At Tf > 350 °C, the diffraction peaks of perovskite SCO (2θ = 20.7 and 42.1°) and fluorite (2θ = 31.7°) disappeared, indicating that the film was completely transformed into the fluorite structure.
 | ||
| Fig. 1 X-ray diffraction patterns of the SrCeO3 precursor film and films fluorinated at Tf = 100–550 °C for 1 h. | ||
Fig. 2(a) and (b) show the cross-sectional annular dark-field STEM images of the SCO precursor film and fluorinated film (Tf = 500 °C) taken along [100] and [110] axes, respectively. The perovskite structure of SCO and fluorite structure of Sr0.5Ce0.5F2.5 (SCF) were clearly observed. Fig. 2(c) and (d) show the STEM–EDS maps colorized after using wavelet-transform-inspired image processing techniques.17 In Fig. 2(c), the positions of Ce and Sr are significantly different, with O appearing to be more abundant in the region that overlaps Ce. This arrangement corresponds to that of the perovskite structure. In contrast, Fig. 2(d) shows the coexistence of Ce and Sr at the same site, albeit with different mixing patterns. In addition, F is mostly present in the interlayer but also observed in the Ce/Sr layer. These results indicate that the topochemical fluorination completely replaced oxygen with fluorine and migrated the cations, resulting in the fluorite structure.
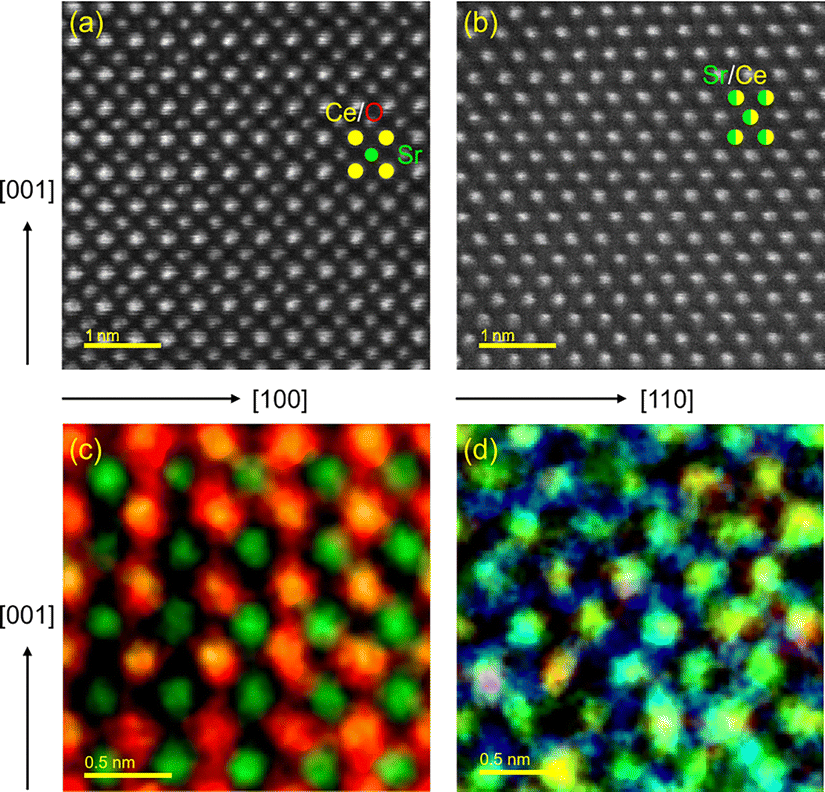 | ||
| Fig. 2 Cross-sectional annular dark-field scanning transmission electron microscopy (STEM) images of the (a) SrCeO3 precursor film and (b) film fluorinated at Tf = 500 °C, taken along [100] and [110] axes, respectively. STEM–energy dispersive spectroscopy maps of the (c) SCO precursor film and (d) film fluorinated at Tf = 500 °C, colorized after using wavelet-transform-inspired image processing techniques (Sr: green, Ce: yellow, O: red, and F: blue). | ||
Fig. S1 (ESI†) shows the reciprocal space mapping images around the 103 asymmetric diffraction of the SrCeO3 precursor film and film fluorinated at Tf = 500 °C, indicating preserved epitaxy after fluorination. Fig. S2 (ESI†) shows the plots of the lengths of the a- and c-axes of the SCO precursor film and fluorinated films (obtained from the XRD measurements) as a function of Tf. The c-axis length significantly increased with change in the structure from perovskite to fluorite, while the a-axis length decreased. In addition, two different lattice constants were identified for the fluorite structure at Tf = 300 °C.
As mentioned above, the perovskite and fluorite structures with two different lattice constants were mixed at Tf = 250–300 °C. Therefore, we observed the STEM–EDS of the SCO film fluorinated at 250 °C with a temperature rise time of 1 h (Fig. S2, ESI†). In the region of Fig. S2(a–c) (ESI†), Ce and Sr are present at different sites, and the structure is basically perovskite SCO, but F is also present between the lattices. In the region of Fig. S2(d–f) (ESI†), Ce and Sr are present at the same sites, F is in the interlayer, and the structure is basically fluorite SCF; however, O is found near the cation sites in some areas. These observations suggest that the XRD peaks (2θ = 31.7°) of the film fluorinated at Tf = 250–300 °C (Fig. 1) originated from oxyfluoride with a fluorite structure.
Fig. 3(a) shows the EDS spectra (at an acceleration voltage (Va) of 2.5 kV) of the SCO precursor film and fluorinated films, where the spectra were normalized to the Ce Mα peaks. While the EDS spectra were unchanged at Tf < 200 °C, the F Kα peak appeared (0.67 keV) at Tf > 250 °C. The intensity of the F Kα peak significantly increased at Tf > 350 °C, whereas the O Kα peak almost disappeared. These results confirm the removal of oxygen ions in the SCO film and the incorporation of fluorine ions via fluorination with PVDF. Fig. 3(b) shows the Ce 3d X-ray photoelectron spectra of the SCO precursor film and films fluorinated at 150 and 400 °C for 1 h. Compared with the reference spectra of Ce4+O2 and Ce3+PO4, the precursor film and film fluorinated at 150 °C consist of Ce4+, and the film fluorinated at 400 °C consists of Ce3+.18 Therefore, the chemical composition of the film fluorinated at Tf > 350 °C is determined as Sr0.52+Ce0.53+F2.5.
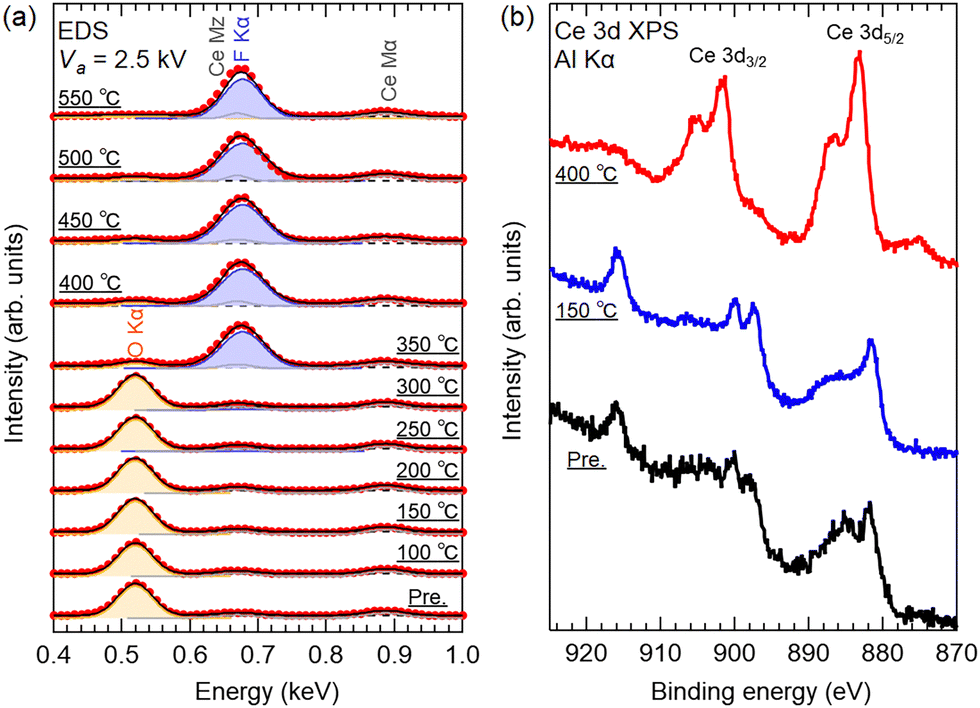 | ||
| Fig. 3 (a) Energy dispersive X-ray spectra (at Va = 2.5 kV) of the SrCeO3 precursor film and fluorinated films. (b) Ce 3d X-ray photoelectron spectra of the SrCeO3 precursor film and the films fluorinated at 150 and 400 °C for 1 h. | ||
In our previous work on the topochemical fluorination of a BaBiO3 thin film at 200 °C for 24 h, the 001 superlattice peak was observed in the XRD pattern, which indicated the ordering of the Ba and Bi cations perpendicular to the film plane.12 However, in the present study, the 001 superlattice peak was not observed in the XRD patterns. Furthermore, the STEM–EDS of the SCF film revealed the coexistence of Ce and Sr at the same site, as shown in Fig. 2(d). Fig. 4 shows the change in the crystal structure of the SCO film with PVDF-mediated fluorination. The [100] direction of the perovskite SCO film corresponds to the [110] direction of the fluorite SCF film. A schematic of the fluorite crystal structure of Sr0.5Ce0.5F2.5 from different angles is shown in Fig. S4 (ESI†). When fluorinated above 350 °C, oxygen ions in the perovskite structure are removed, and fluorine ions occupy the anion sites of the fluorite structure.
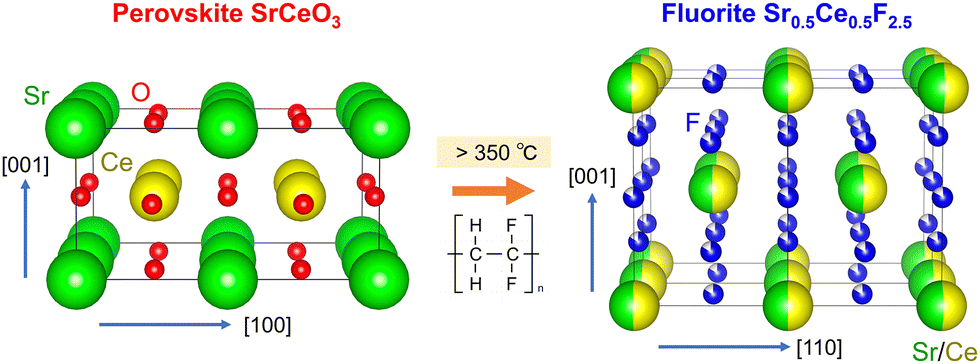 | ||
| Fig. 4 Schematic of the change in crystal structure of the SrCeO3 film with polyvinylidene fluoride-mediated fluorination. | ||
Topochemical fluorination reactions of many transition-metal oxide thin films using PVDF have been reported, but the reaction times are ∼10 h or longer.14,15 For example, in the topochemical fluorination of NdNiO3 thin films, time-dependent XRD experiments have confirmed that the reaction takes 24 h at 350 °C to progress completely.15 However, in the present study, the SCO thin film transitioned to the fluorite structure within 1 h at 350 °C, which is a considerably faster heating time. This indicates that SCO has an unusually high reactivity during topochemical fluorination with PVDF.
To investigate the F-ion conductivity of the SCF thin films, in-plane and out-of-plane impedance spectra of the SCF film obtained at Tf = 500 °C were measured at 323–523 K and 323–443 K, as shown in Fig. S5 and S6 (ESI†), respectively. All the impedance spectra were composed of a semicircle at high frequencies and straight line at low frequencies, and these were observed at higher frequencies as the temperature increased. The semicircle and straight-line portions of each spectrum are attributed to F-ion conduction in the film (intra- and inter-granular) and at the film/electrode interface, respectively. Fig. 5 shows the in-plane and out-of-plane F-ion conductivity of the SCF film obtained at Tf = 500 °C as a function of temperature, calculated from the impedance spectra in Fig. S5 and S6 (ESI†). The in-plane F-ion conductivity was smaller than the out-of-plane conductivity. For example, the F-ion conductivities at 323 K were 7.4 × 10⁻⁸ S cm−1 (in-plane) and 1.4 × 10⁻⁷ (out-of-plane), respectively. The Arrhenius plot was fitted with a straight line over the measured temperature range, and both the in-plane and out-of-plane activation energies (Ea,in and Ea,out) were estimated to be almost the same value: 0.61 eV. This value is larger than the activation energy of polycrystalline Ce0.975Sr0.025F2.975 (0.31 eV), a high F-ion conductor of cerium fluoride.7 The reason for this difference may be due to the difference in crystal structure. In the future, the ionic conductivity and Ea could be improved by modulating the crystal structure through adjusting the amount of cation dopants or F carriers.
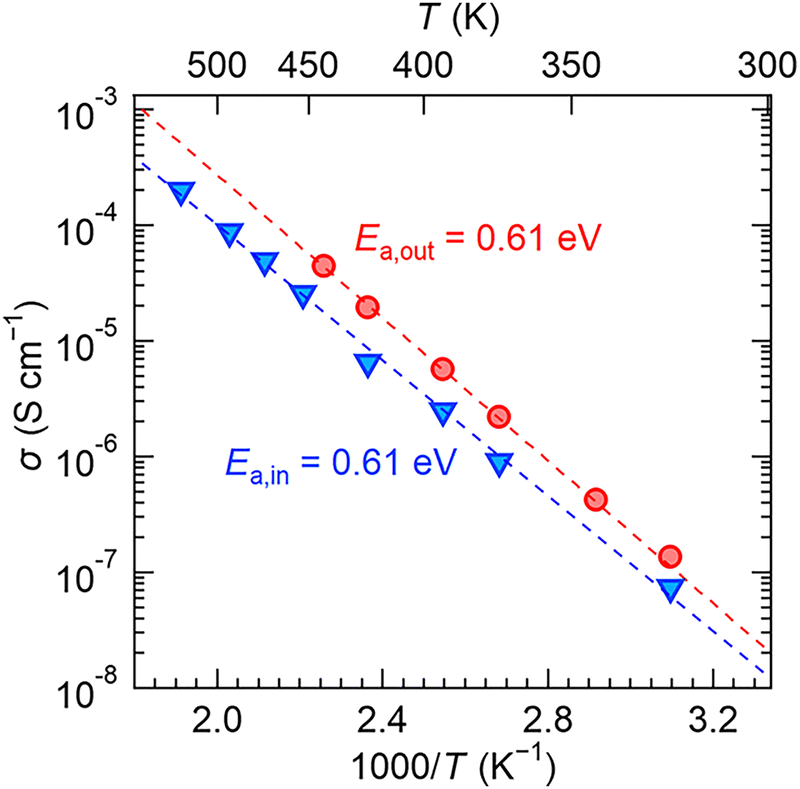 | ||
| Fig. 5 In-plane (blue) and out-of-plane (red) F-ion conductivity of the Sr0.5Ce0.5F2.5 film obtained at Tf = 500 °C as a function of temperature. The dashed line represents the linear fit of the measurements. | ||
In summary, we performed topochemical fluorination of perovskite SCO epitaxial thin films using PVDF at Tf = 100–550 °C for 1 h. Single-phase SCF epitaxial thin films with a fluorite-type structure were obtained at Tf > 350 °C. In addition, the SCF thin film exhibited an out-of-plane F-ion conductivity of 1.4 × 10⁻⁷ S cm−1 at 323 K with an activation energy of 0.61 eV. The synthesis of cerium fluoride thin films via PVDF-mediated topochemical fluorination would provide new F-ion conductors for use as solid electrolytes in FIBs.
We would like to thank Mai Taketomi and Yoshiko Nakayama for the STEM analyses. This work was supported by Japan Society for the Promotion of Science (JSPS) KAKENHI grant numbers JP23H01846, a research grant from the Institute for SDGs Promotion at Ochanomizu University, the Cooperative Research Program of the Network Joint Research Center for Materials and Devices, and the Advanced Research Infrastructure for Materials and Nanotechnology in Japan (ARIM) of the Ministry of Education, Culture, Sports, Science and Technology (MEXT) under proposal number JPMXP1224NM0102.
Data availability
The data supporting the findings of this study are available within the article or its ESI.†Conflicts of interest
There are no conflicts to declare.Notes and references
- M. Anji Reddy and M. Fichtner, J. Mater. Chem., 2011, 21, 17059 RSC.
- M. A. Nowroozi, I. Mohammad, P. Molaiyan, K. Wissel, A. R. Munnangi and O. Clemens, J. Mater. Chem. A, 2021, 9, 5980 RSC.
- V. K. Davis, C. M. Bates, K. Omichi, B. M. Savoie, N. Momčilović, Q. Xu, W. J. Wolf, M. A. Webb, K. J. Billings, N. H. Chou, S. Alayoglu, R. K. McKenney, I. M. Darolles, N. G. Nair, A. Hightower, D. Rosenberg, M. Ahmed, C. J. Brooks, T. F. Miller, R. H. Grubbs and S. C. Jones, Science, 2018, 362, 1144 CrossRef CAS PubMed.
- N. I. Sorokin and B. P. Sobolev, Crystallogr. Rep., 2007, 52, 842–863 CrossRef CAS.
- N. I. Sorokin and B. P. Sobolev, Russ. J. Electrochem., 2007, 43, 398 CrossRef CAS.
- T. Takahashi, H. Iwahara and T. Ishikawa, J. Electrochem. Soc., 1977, 124, 280 CrossRef CAS.
- B. Dieudonné, J. Chable, M. Body, C. Legein, E. Durand, F. Mauvy, S. Fourcade, M. Leblanc, V. Maisonneuve and A. Demourgues, Dalt. Trans., 2017, 46, 3761 RSC.
- P. P. Fedorov, O. E. Izotova, V. B. Alexandrov and B. P. Sobolev, J. Solid State Chem., 1974, 9, 368 CrossRef.
- M. Yoshimura, K. J. Kim and S. Somiya, J. Mater. Sci. Lett., 1984, 3, 1097 CrossRef CAS.
- D. A. Jones and W. A. Shand, J. Cryst. Growth, 1968, 2, 361 CrossRef CAS.
- J. Aigueperse, P. Mollard, D. Devilliers, M. Chemla, R. Faron, R. Romano and J. P. Cuer, Ullmann's Encyclopedia of Industrial Chemistry, Wiley-VCH Verlag GmbH & Co. KGaA, Weinheim, Germany, 2000, vol. 15, pp 735–768 Search PubMed.
- A. Chikamatsu, K. Kawahara, T. Shiina, T. Onozuka, T. Katayama and T. Hasegawa, ACS Omega, 2018, 3, 13141 CrossRef CAS PubMed.
- S. Doyle, E. Tewolde Berhane, P. Zou, A. B. Turkiewicz, Y. Zhang, C. M. Brooks, I. El Baggari, H. L. Xin and J. A. Mundy, ACS Omega, 2024, 9, 39082 CrossRef CAS PubMed.
- T. Katayama, A. Chikamatsu, Y. Hirose, R. Takagi, H. Kamisaka, T. Fukumura and T. Hasegawa, J. Mater. Chem. C, 2014, 2, 5350 RSC.
- T. Onozuka, A. Chikamatsu, T. Katayama, Y. Hirose, I. Harayama, D. Sekiba, E. Ikenaga, M. Minohara, H. Kumigashira and T. Hasegawa, ACS Appl. Mater. Interfaces, 2017, 9, 10882 CrossRef CAS PubMed.
- K. Momma and F. Izumi, J. Appl. Crystallogr., 2011, 44, 1272 CrossRef CAS.
- F. Uesugi, Micron, 2023, 168, 103442 CrossRef PubMed.
- E. Bêche, P. Charvin, D. Perarnau, S. Abanades and G. Flamant, Surf. Interface Anal., 2008, 40, 264–267 CrossRef.
Footnote |
| † Electronic supplementary information (ESI) available: Reciprocal space mapping images of the SrCeO3 precursor and the film fluorinated at Tf = 500 °C, lengths of the a- and c-axes of the precursor and fluorinated films, cross-sectional STEM images and STEM–EDS color maps, schematic of the fluorite crystal structure of Sr0.5Ce0.5F2.5, and in-plane and out-of-plane impedance spectra and the fitting results of the Sr0.5Ce0.5F2.5 film. See DOI: https://doi.org/10.1039/d5cc00985e |
| This journal is © The Royal Society of Chemistry 2025 |