
Intraoperative assessment of resection margins by Raman spectroscopy to guide oral cancer surgery†
Yassine
Aaboubout
 ab,
Maria R.
Nunes Soares
ac,
Tom C.
Bakker Schut
cd,
Elisa M.
Barroso
a,
Martin
van der Wolf
c,
Elena
Sokolova
c,
Viacheslav
Artyushenko
e,
Alexey
Bocharnikov
e,
Iskander
Usenov
e,
Cornelia G. F.
van Lanschot
b,
Lars
Ottevanger
a,
Hetty
Mast
f,
Ivo
ten Hove
f,
Brend P.
Jonker
f,
Stijn
Keereweer
b,
Dominiek A.
Monserez
b,
Aniel
Sewnaik
b,
Jose A.
Hardillo
b,
Rob J.
Baatenburg de Jong
b,
Senada
Koljenović
*agh and
Gerwin J.
Puppels
*cd
ab,
Maria R.
Nunes Soares
ac,
Tom C.
Bakker Schut
cd,
Elisa M.
Barroso
a,
Martin
van der Wolf
c,
Elena
Sokolova
c,
Viacheslav
Artyushenko
e,
Alexey
Bocharnikov
e,
Iskander
Usenov
e,
Cornelia G. F.
van Lanschot
b,
Lars
Ottevanger
a,
Hetty
Mast
f,
Ivo
ten Hove
f,
Brend P.
Jonker
f,
Stijn
Keereweer
b,
Dominiek A.
Monserez
b,
Aniel
Sewnaik
b,
Jose A.
Hardillo
b,
Rob J.
Baatenburg de Jong
b,
Senada
Koljenović
*agh and
Gerwin J.
Puppels
*cd
aDepartment of Pathology, Erasmus MC Cancer Institute, University Medical Center Rotterdam, PO Box 2040, 3000 CA Rotterdam, The Netherlands. E-mail: g.puppels@erasmusmc.nl
bDepartment of Otorhinolaryngology and Head and Neck Surgery, Erasmus MC Cancer Institute, University Medical Center Rotterdam, PO Box 2040, 3000 CA Rotterdam, The Netherlands. E-mail: senada.koljenovic@uza.be
cRiverD International B. V., Rotterdam Science Tower, Marconistraat 16, 3029 AK Rotterdam, The Netherlands
dDepartment of Dermatology, Erasmus MC Cancer Institute, University Medical Center Rotterdam, PO Box 2040, 3000 CA Rotterdam, The Netherlands
eart photonics GmbH, Rudower Chaussee 46, 12489 Berlin, Germany
fDepartment of Oral and Maxillofacial Surgery, Special Dental Care, and Orthodontics, Erasmus MC Cancer Institute, University Medical Center Rotterdam, PO Box 2040, 3000 CA Rotterdam, The Netherlands
gDepartment of Pathology, Antwerp University Hospital, 2650 Antwerpen, Belgium
hUniversity of Antwerp, Faculty of Medicine, 2610 Antwerpen, Belgium
First published on 19th July 2023
Abstract
Patients with oral cavity cancer are almost always treated with surgery. The goal is to remove the tumor with a margin of more than 5 mm of surrounding healthy tissue. Unfortunately, this is only achieved in about 15% to 26% of cases. Intraoperative assessment of tumor resection margins (IOARM) can dramatically improve surgical results. However, current methods are laborious, subjective, and logistically demanding. This hinders broad adoption of IOARM, to the detriment of patients. Here we present the development and validation of a high-wavenumber Raman spectroscopic technology, for quick and objective intraoperative measurement of resection margins on fresh specimens. It employs a thin fiber-optic needle probe, which is inserted into the tissue, to measure the distance between a resection surface and the tumor. A tissue classification model was developed to discriminate oral cavity squamous cell carcinoma (OCSCC) from healthy oral tissue, with a sensitivity of 0.85 and a specificity of 0.92. The tissue classification model was then used to develop a margin length prediction model, showing a mean difference between margin length predicted by Raman spectroscopy and histopathology of −0.17 mm.
Introduction
Worldwide, 350![[thin space (1/6-em)]](https://www.rsc.org/images/entities/char_2009.gif) 000 patients per year are diagnosed with oral cavity cancer, of which about 90% is squamous cell carcinoma (OCSCC).1
000 patients per year are diagnosed with oral cavity cancer, of which about 90% is squamous cell carcinoma (OCSCC).1
Surgery is the primary form of treatment. In an adequate tumor resection, the whole tumor is removed with a histopathological margin of more than 5 mm of healthy tissue. At the same time, it is important to spare healthy tissue to limit the loss of function (e.g., speaking, mastication, and swallowing) and facial disfigurement.2–4
Five-year disease-specific survival of oral cancer patients currently stands at 84% for adequate tumor resections, but only 68% for inadequate resections, despite the much more frequent use of adjuvant therapy in these cases (mostly postoperative radiotherapy).5
Unfortunately, with surgeons having to rely on visual inspection, palpation, and pre-operative imaging, adequate resection margins are rarely achieved (15%–26%) in oral cancer surgery.2–6
This can be improved by intraoperative assessment of resection margins (IOARM), enabling the surgeon to excise additional tissue when needed to turn an initially inadequate resection into an adequate resection. A recently introduced IOARM-method for inspection of a fresh specimen, by a dedicated pathologist and the surgeon, has led to a dramatic improvement in the rate of adequate tumor resections from 15% to 58%.4,5
However, the method is laborious, logistically very demanding, and subjective, which hinders its widespread adoption. IOARM works, but there is a need for an objective and easy-to-use technology to allow more patients to benefit from it. A range of techniques, among which fluorescence imaging, ultrasound-guided resection, and magnetic resonance imaging of tongue cancer specimens is currently being explored for application in objective IOARM.7–12
Raman spectroscopy is a non-destructive, label-free, optical technique, that provides information about the overall molecular composition of tissues. The development of medical applications of this technique is rapidly gaining momentum.13–19 Here, we report on the development and validation of a Raman spectroscopy-based objective IOARM-device (RIOARM-device), which uses the high-wavenumber (HWVN) part of the Raman spectrum. A thin fiber-optic needle probe is inserted into the specimen to rapidly determine the distance between the resection surface and the tumor border (margin length).
Materials and Methods
Patient selection and resection specimen handling
This study was approved by the Medical Ethics Committee of Erasmus Medical Center (Erasmus MC) (protocol MEC-2015-150). OCSCC patients who underwent surgical treatment between May 2019 and September 2021 were included, after informed consent.In total 71 patients were included, 40 patients for the tissue classification model (see below “Development of a tissue classification model”) and 31 for the margin length prediction model (see below “Development of a margin length prediction model”).
The experiments on fresh resection specimens were performed within 30 minutes after arrival from the operating room, after which they underwent routine pathology processing.
RIOARM-device
The RIOARM-device is shown in Fig. 1 and is described in more detail in the ESI (S1: RIOARM-device).†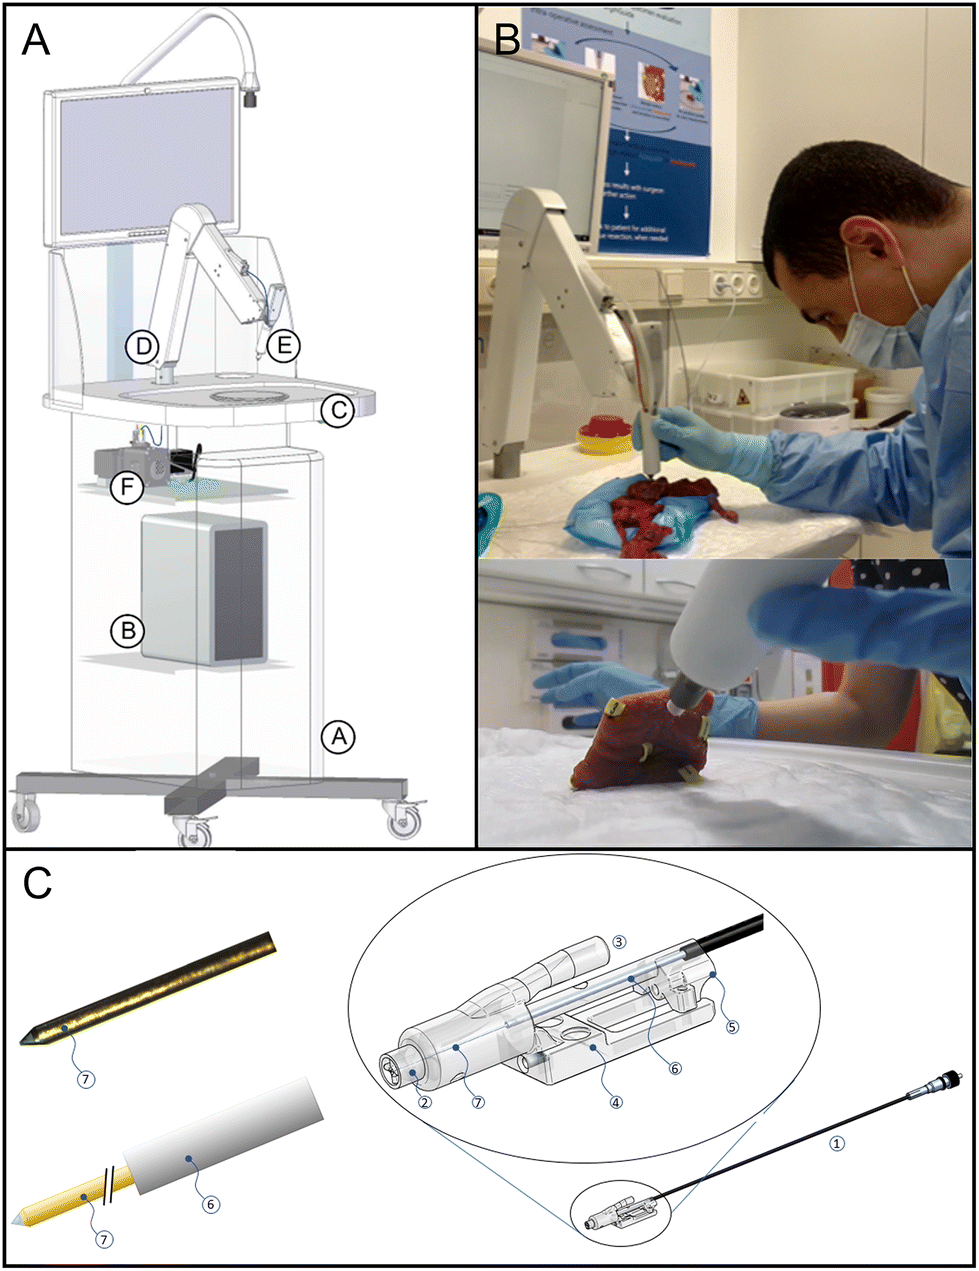 | ||
| Fig. 1 RIOARM-device. Panel A: Main components of the RIOARM-device: (A): custom-built cart, (B): personal computer (Windows 10, Hewlett-Packard prodesk), (C): workspace for specimen positioning, (D): positioning arm, for positioning the fiber-optic needle probe, (E): the disposable fiber-optic needle probe (illustrated in panels (B) and (C)), which is fiber-optically coupled to (F): a custom-built raman spectroscopy module. Panel B: positioning of the fiber-optic needle probe on a specimen. Panel C: Disposable fiber-optic needle probe, comprised of: – a single copper-coated multimode fused silica fiber (core/cladding/coating diameter: 105/125/150 μm) in a thin (300 μm outer diameter) metal tube (6), covered by protective braided pebax/polyamide tubing. – an Fc/Pc-connector at its proximal end, butt-coupling the probe to the internal fiber patch cord of the raman-RIOARM-device (panel A). – a port 3, connected to a vacuum system. It maintains an under pressure in chamber 2, around the fiber-optic probe end, when the chamber is placed on the tissue. This fixes the tissue in place against tip 2, preventing surface deformation when the fiber-optic needle is inserted into the tissue. – Part 4, used to fasten the fiber-optic needle probe to the positioning arm of the Raman-RIOARM-device. – Part 5, connecting the fiber-optic probe to the linear translation stage in the positioning arm, enabling the insertion of the fiber-optic needle into the tissue at a set speed. – The distal end 7 of the needle which penetrates the tissue measures 150 μm in diameter and has a conically polished tip. (Further details in the ESI, S1 RIOARM device†). | ||
It employs disposable HWVN single fiber-optic needle probes. The proximal end of the single fiber of the disposable fiber-optic needle probe is butt-coupled to a fiber patch cord in the RIOARM-device positioning arm, which at the other end is connected to a Raman module. The Raman module launches laser light (671 nm, 65 mW) into the fiber and receives Raman scattered light from the fiber. Because the RIOARM-device records high-wavenumber Raman spectra in the 2600–4000 cm−1 region, where the background signal of the optical fibers is very low, a single fiber can be used to guide laser light to the tissue and to collect Raman scattered light from the tissue.20,21 The spectral resolution of the system is <12.5 cm−1 over the entire spectral interval. The depth resolution of the system is <0.35 mm (details described in the ESI, S2: Experimental determination of the depth resolution†). The experiments were performed in a room with ceiling lighting comprised of LED-lamps having no emission above 700 nm. Because Raman spectra were collected above 800 nm, experiments could be carried out with room lighting on without any interference with the collection of Raman spectra.
The fiber-optic needle probe is connected to the motorized translation stage of the RIOARM-device positioning arm and a vacuum system. The motorized translation stage is used to drive the fiber-optic needle into the tissue under investigation. The vacuum system serves to create an under pressure that prevents tissue deformation during the insertion of the fiber-optic needle.
In operation, the fiber-optic needle probe was positioned perpendicular to the tissue surface and then inserted with a velocity of 1.8 mm s−1, over a distance of 7 mm. Raman spectra were recorded every 0.14 seconds, resulting in 4 Raman spectra per mm.
Data preprocessing
All data preprocessing and data analysis software routines were built in-house using MATLAB (version 2020a, Mathworks, Natick, MA, USA).All spectra were intensity and wavenumber calibrated as described earlier.22 Cosmic ray events were removed, and any background signal generated in the systems optical path was subtracted. Autofluorescence (AF) contributes in varying degrees to the tissue spectra. This AF background signal was fitted with a 3rd-order polynomial and was subtracted from the measured spectrum to obtain the Raman signal. The polynomial fit was optimized for the 2600–2800 cm−1 and 3800–4000 cm−1 spectral regions, which do not contain significant Raman signal contributions. The subtracted polynomial was used to quantify the autofluorescence background signal.
The following criteria were used to exclude low-quality spectra from the data set:
• Saturation of the CCD detector by very high tissue AF.
• Raman signal-to-noise ratio (RSNR) <0.1. The RSNR is defined as the mean of the ratios between the Raman signal and the square root of the total acquired signal (Raman signal + AF + device background) in the spectral region between 2600–4000 cm−1.
Data analysis
Three Raman spectral tissue markers were used as discriminators between OCSCC and healthy tissue:1. The water concentration [H2O] defined as water mass percentage (expressed in grams of water per 100 grams of wet tissue) was calculated using the method developed by Caspers et al.23 and described in detail in previous studies.24–26
2. The Raman signal intensity ratio of two wavenumber regions (I2852–2884 cm−1:I2910–2966 cm−1) of the CH-stretching region was determined, indicative of the lipid-to-protein ratio (Lipid/Protein).27,28
3. The Raman signal to AF signal ratio (Raman/AF) was calculated for the 3350–3550 wavenumber region (IRaman 3350–3550 cm−1:IAF 3350–3550 cm−1).
Development of a tissue classification model
For the development of the tissue classification model, Raman measurements were performed on fresh specimen cross-sections containing both tumor and healthy tissue. For these measurements, the RIOARM-device was slightly modified. The positioning arm was replaced by a manual X–Y positioning stage (with a better than 100 μm positioning precision) to which the fiber-optic needle probe was attached (Fig. 2A and B). This enabled precise positioning of the fiber-optic needle probe on the specimen and retrieval of measurement locations needed for histopathological annotation of Raman spectra. To prevent dehydration of the cross-section tissue surface, the tissue was shielded from ambient air with plastic foil wrapped around the X–Y positioning stage (Fig. 2C).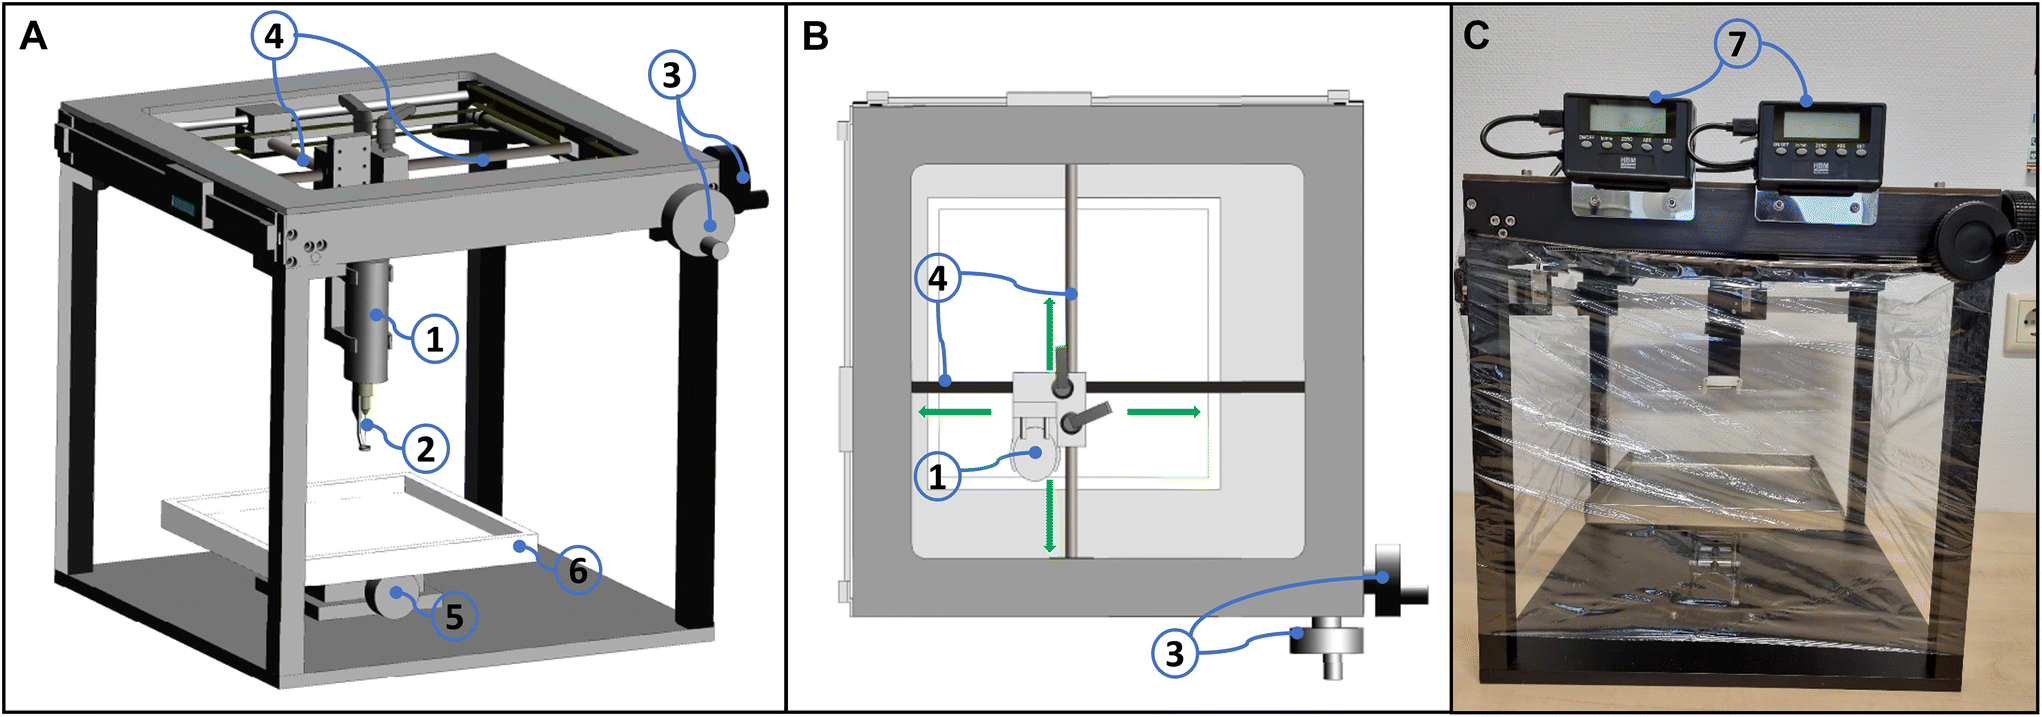 | ||
| Fig. 2 Manual X–Y positioning stage. (A). A front-side view showing the fiber-optic needle probe 1 and needle 2; the two actuators 3 are used to move the fiber-optic needle probe in the X and Y directions along the guiding rods 4; the specimen is placed on the plate 6 and is moved towards needle 2 by means of actuator 5. (B). Top view of the stage. The X–Y movements of the fiber-optic needle probe 1 along the 2 guiding rods 4 are indicated by the green arrows. (C). Picture of the stage showing two monitors 7 to read the X–Y position of the fiber-optic needle probe. The stage is wrapped in plastic foil to prevent tissue dehydration during the measurements. | ||
For the measurements, due care was taken to maintain anatomical orientation, as required for final histopathology, which is the gold standard for diagnosis and prognostication.
The specimen cross-section was fixed onto a cork substrate and placed under an X–Y positioning stage, to which the fiber optic probe of the RIOARM-device was attached (Fig. 3A).
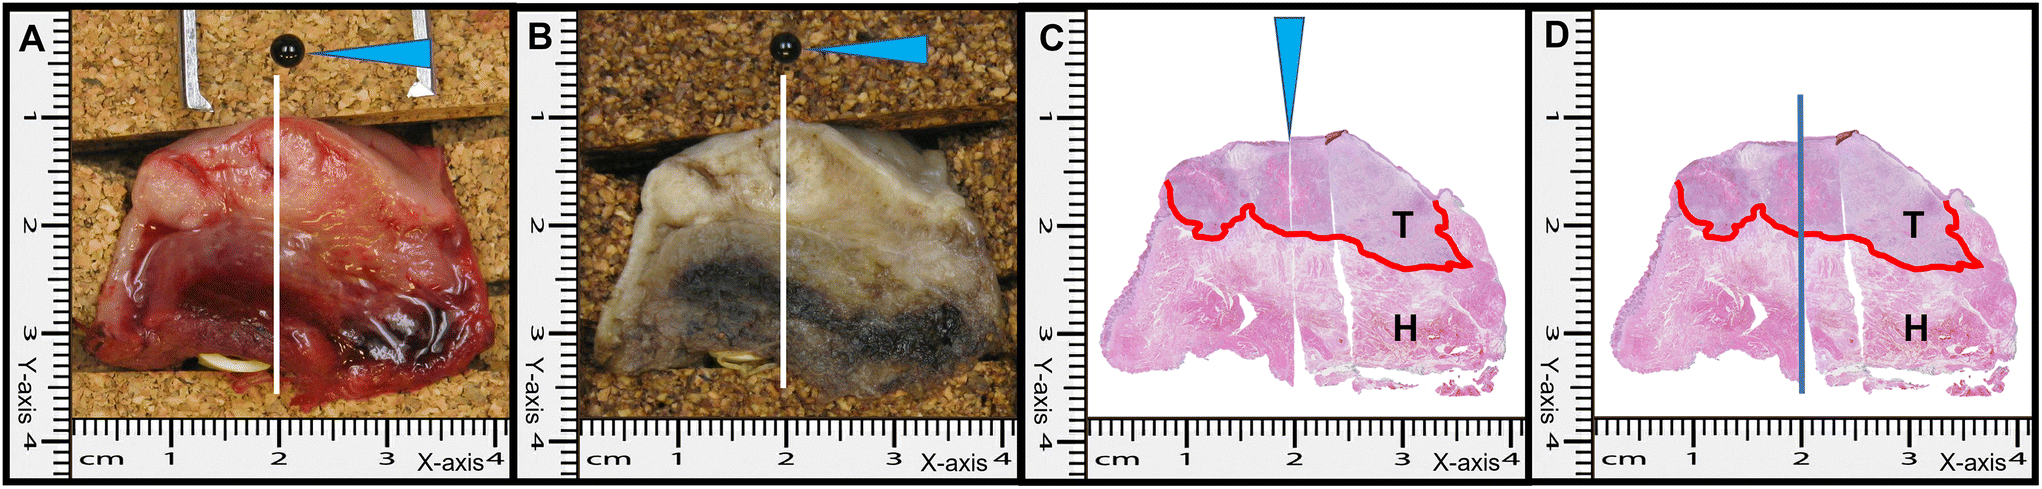 | ||
| Fig. 3 Illustration of the procedure for histopathological annotation of raman measurements on specimen cross-sections. (A) and (B). Cross-section of a resection specimen before and after formalin fixation. The black pin (blue arrow) demarcates the X-position of the first line of raman measurements (white line). (C) and (D). H&E slide obtained from the cross-section surface. The reference incision that was used for identifying the first Raman line measurement is clearly visible (blue arrowhead). The red line marks the tumor border. T: Tumor, H: Healthy Tissue. The first raman line measurement is indicated by the blue line (D). | ||
Raman experiments were performed as follows:
a. A series of Raman measurements were performed along a straight line, using the Y-axis of the X–Y stage (white lines, Fig. 3A), moving from the resection surface towards and into the tumor with a step size of 1 mm.
b. The X-position of the first line measurement was demarcated by a pin (black pin, Fig. 3A) inserted into the cork. The location of this pin served as the reference point for histological annotation after the experiment (Fig. 3A).
c. At each measurement location, the fiber-optic needle was driven into the tissue, with a velocity of 3.6 mm s−1, while collecting Raman spectra from the tissue cross-section surface to 3 mm below the surface. Raman spectra were recorded every 0.14 seconds, resulting in 2 Raman spectra per mm. A laser power of 65 mW was used.
d. Depending on the size of the specimen cross-section, a number of line measurements were performed, spaced 1 mm apart along the X-axis.
After the experiment, a photograph was taken and the cross-section was formalin-fixed for further processing (Fig. 3B).
Each measurement location was histologically annotated and labeled “healthy” or “tumor”.
For the histological annotation, a superficial straight incision was made in the cross-section surface, at the position of the first Raman line measurement, starting at the black demarcation pin (Fig. 3B). This was also done on the opposite side of the cross-section. From both sides, hematoxylin and eosin (H&E) stained thin tissue sections were made (Fig. 3C), using the reference incisions for annotation of Raman measurement locations as healthy or tumor (Fig. 3D). Raman measurement locations were excluded from further analysis if the histological annotation was not the same for both H&E slides.
In our estimation, the relocation of Raman measurement locations for histopathological annotation has an uncertainty of 1 mm in both X and Y directions. For this reason, measurements within 2 mm of the tumor border were excluded from further analysis.
The tissue classification model was developed using a support vector machine (SVM) method with a fine Gaussian kernel (Machine Learning Toolbox, MATLAB 2020a). The values for [H2O], Lipid/Protein, and Raman/AF obtained from the tissue spectra were used as input, together with the histological classification of the tissue (binary classifier: tumor or healthy).
For each [H2O], Lipid/Protein, Raman/AF input set, the model yields a tumor probability. The model was trained using k-fold cross-validation (k = number of patients). A receiver operating characteristic (ROC) curve was calculated as internal validation. The discriminative power of the model was determined by calculating the area under the curve (AUC) obtained for different tumor-probability thresholds. The accuracy, sensitivity, and specificity of this model were determined at a tumor-probability threshold of 0.5. The model was validated on an independent data set.
Development of a margin length prediction model
The RIOARM-device was used on intact fresh specimens, to obtain Raman spectra from the resection surface to 7 mm below the resection surface (Raman profiles). Depending on the size of the specimen, up to six measurement locations were selected. The intact specimens were kept in a closed container until the Raman measurements were performed which lasted between 5 and 10 minutes.Two considerations are at the heart of the experimental design described below. We estimate that the relocation of the position of Raman measurements on resection specimens, in H&E slides is only precise to about 1 mm. This can lead to an error in the histological margin length annotation of the measurement, because the border between tumor and healthy tissue is neither regular nor parallel to the resection surface.
To minimize the effect on the development of the margin length prediction model, an approach was chosen in which up to 6 RIOARM-device profile measurements were performed within a resection surface area of about 2 mm × 2 mm, each yielding a margin length. The center of the measurement area was demarcated by a numbered needle, inserted perpendicularly to the resection surface. After tissue processing, the histological margin lengths were determined at up to 6 locations less than 1 mm from the numbered relocation needle. The mean margin length prediction of the RIOARM-device was then compared to the mean histological margin length. A measurement location was excluded if individual histological margin lengths differed by more than 2 mm.
After the experiment, a picture was taken (Fig. 4A). The intact specimen with the numbered needles was then formalin-fixed for further processing. After fixation, another photograph was taken (Fig. 4B). The specimen was grossed, following the standard pathology procedure, without the removal of the numbered needles (Fig. 4C and D). This resulted in specimen cross-sections of 2 to 3 mm in thickness. Along the length of a numbered needle, superficial incisions were made on both sides of the specimen cross-sections. H&E slides were prepared from both sides of the cross-section, in which the incisions served as a reference for histological annotation of the profile measurements (Fig. 4E and F).
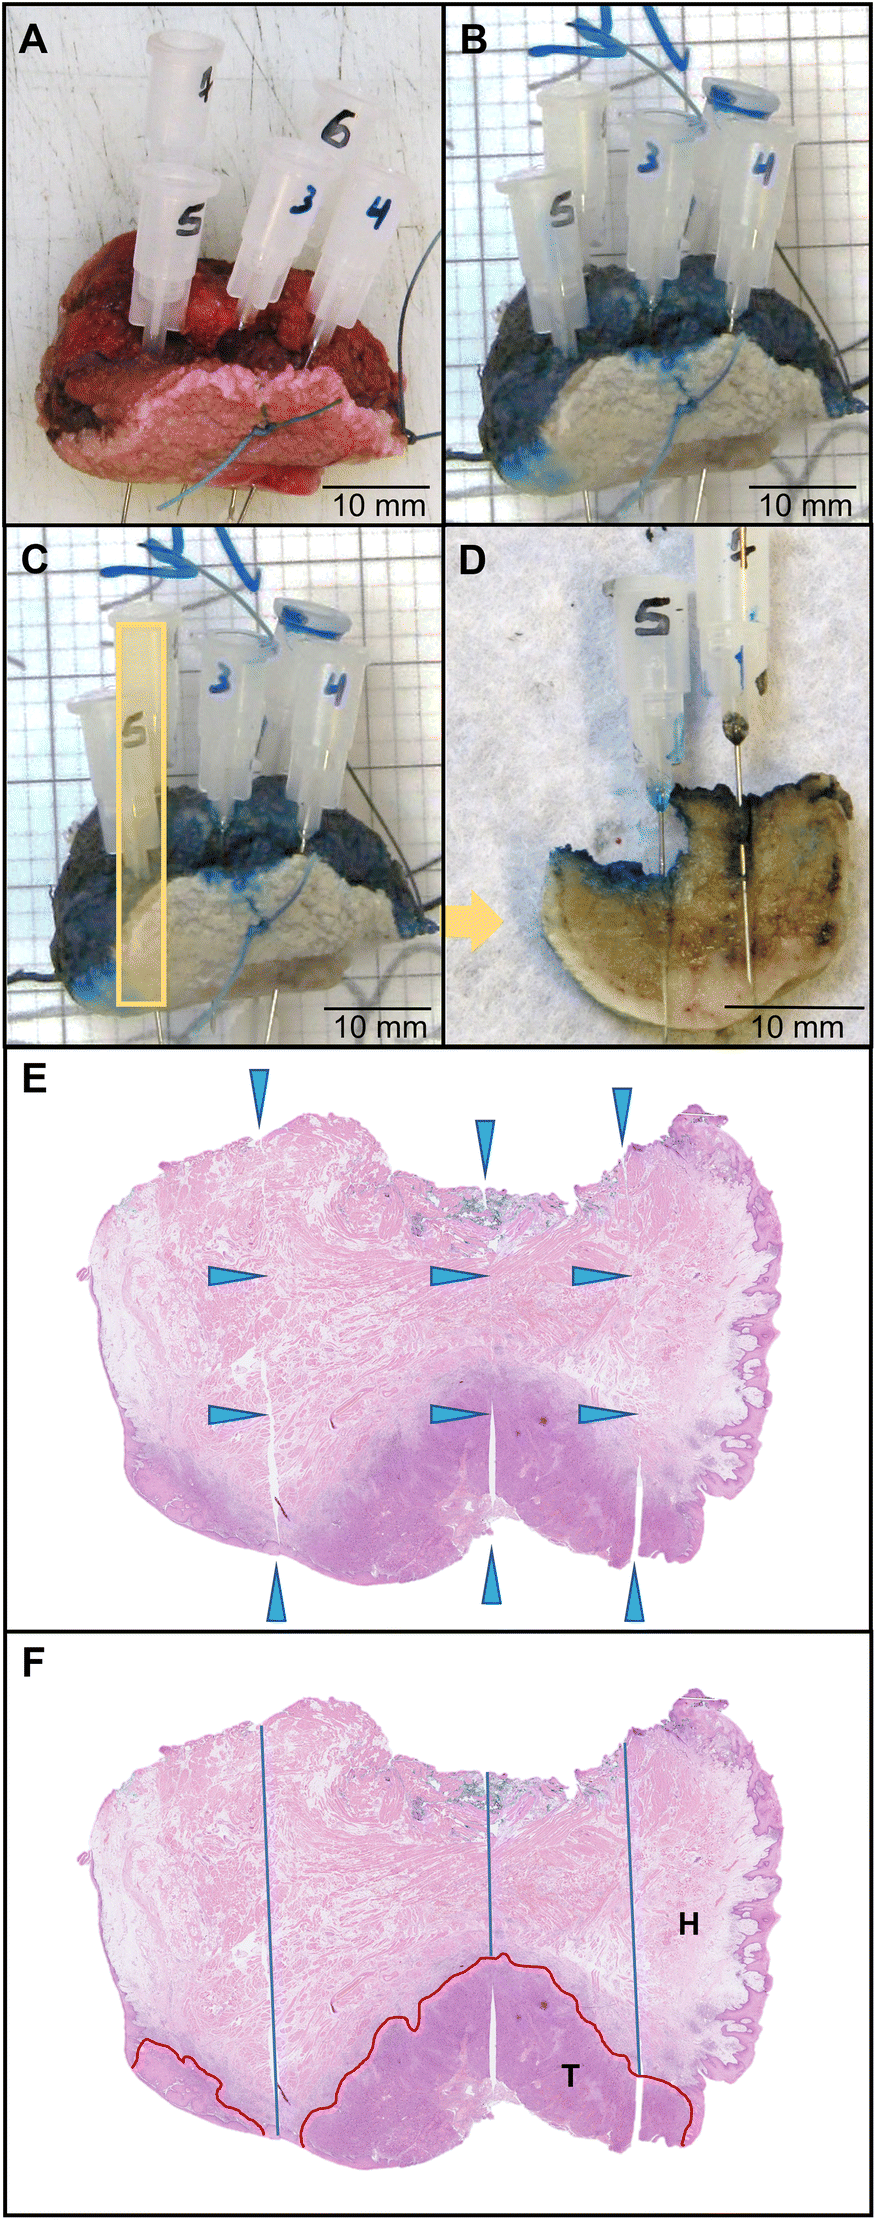 | ||
| Fig. 4 Illustration of the procedure for histological annotation of raman profile measurements. (A). Intact fresh resection specimen with numbered needles demarcating the Raman profile measurement areas. (B). The specimen after formalin fixation. (C). The specimen of figure B with the yellow square indicating the location of the cross-section shown in figure (D). (D). Specimen cross-section containing measurement locations marked by needles 5 and 7. Superficial incisions were made along the numbered needles, to enable identification of the trajectory of the Raman profile measurements in H&E-slides. (E). H&E-slide showing the trajectories of the raman profile measurements indicated by needles 5 and 7. (F). The H&E-slide of figure (E), illustrates the histological annotation. The red line marks the tumor border. H: Healthy Tissue, T: Tumor. | ||
Based on the tissue classification model, each spectrum of a Raman profile was converted into a tumor probability, resulting in tumor probability profiles, showing tumor probability as a function of distance to the resection surface.
1. When the whole 7 mm profile has a probability <0.5, no tumor is encountered and the margin length is ≥7 mm.
2. When the whole profile has a probability ≥0.5, the margin length is 0 mm.
3. When the probability profile has only one transition from low (<0.5) to high (≥0.5) tumor probability, the location of this transition demarcates the margin length.
4. Profiles with more than 4 crossings of the 0.5 threshold are considered inconclusive, and no margin length prediction is given.
5. For all other tumor probability profiles, a simple parametrized interpretation model was adopted for the prediction of the margin length.
In summary; 2 parameters, related to the length of low and high tumor probability segments in a tumor probability profile, were optimized; Hmin and Lmax:
• If a segment of a profile with a high tumor probability is longer than value Hmin, the decision is that the tumor border is located at the start of that segment.
• If a segment of a profile with a high tumor probability is shorter than the value Hmin, the decision rule depends on additional profile shape characteristics. For example, if 2 segments of high tumor probability are interrupted by a segment of low tumor probability, the decision rule for the location of the tumor border, depends on the length of that low probability segment.
- If it is smaller than the value Lmax the presence of that low probability segment is ignored.
- If it is larger than value Lmax the presence of the first high probability segment is ignored.
The margin length determined at final pathology was used as gold standard. ESI Table 4† shows the different tumor probability profiles and the decision rules for predicting the margin length. Using the development data set, both Hmin and Lmax were varied from 1 to 6 mm with a step size of 1 mm.
The difference between the histological margin lengths and the predicted margin lengths was calculated for each combination of Hmin and Lmax for all tumor probability profiles. In this way, the combination of Hmin and Lmax that yielded the lowest mean error was determined.
Data obtained from a specimen were either used for the development of the margin length prediction model, or for the validation of the model. Allocation of specimens to either the model development dataset or the model validation dataset was based on balancing anatomical tumor locations (tongue, floor of mouth, buccal mucosa, gingiva maxilla, and gingiva mandible) and the number of adequate/inadequate margins in both groups.
Valid tumor probability profiles were used to calculate a mean margin length prediction for a measurement location. Profiles were considered invalid if, during a profile measurement the vacuum broke, which leads to tissue surface deformation during needle insertion. A profile was also considered invalid if it contained more than 2 consecutive points for which no tumor probability could be calculated. Finally, profiles that gave an inconclusive margin length prediction (ESI Table 5;† profile shape 10), were excluded.
Measurement locations with 2 or more valid tumor probability profiles were used to test the margin length prediction model, for both the development data set and the validation data set.
The mean error in margin length prediction was calculated to investigate a potential bias of the RIOARM-device. The mean absolute error in margin length prediction was calculated to determine the error in the margin length determination by the RIOARM-device.
Results
Tissue classification model
Raman measurements were performed on fresh specimen cross-sections from 40 OCSCC patients. Patient and tumor characteristics are shown in ESI Table 2.† Data from 25 patients were used to develop the tissue classification model and data from 15 patients were used for its validation.The development of the tissue classification model was based on 1347 tumor spectra and 1784 healthy tissue spectra. Typical Raman spectra of tumor and healthy tissue are shown in Fig. 5A, B, and C. Each spectrum was analyzed to yield values for 3 Raman spectral tissue markers: [H2O], Lipid/Protein, and Raman/AF. Fig. 5D, E, and F compare the distribution of values of these 3 markers for healthy tissue (green) and tumor (red), for all spectra in the development data set. A wide range of [H2O]-values are found for healthy tissue. Tumor is characterized by a narrow range of [H2O]-values, overlapping with the highest [H2O]-values found in healthy tissue. Similarly, healthy tissue shows a wide range of Lipid/Protein-values. Tumor is characterized by a narrow range of values, overlapping with the lowest Lipid/Protein-values found in healthy tissue. Finally, many healthy tissue spectra are characterized by an intense AF background, resulting in low Raman/AF-values. This is only rarely encountered in tumor spectra.
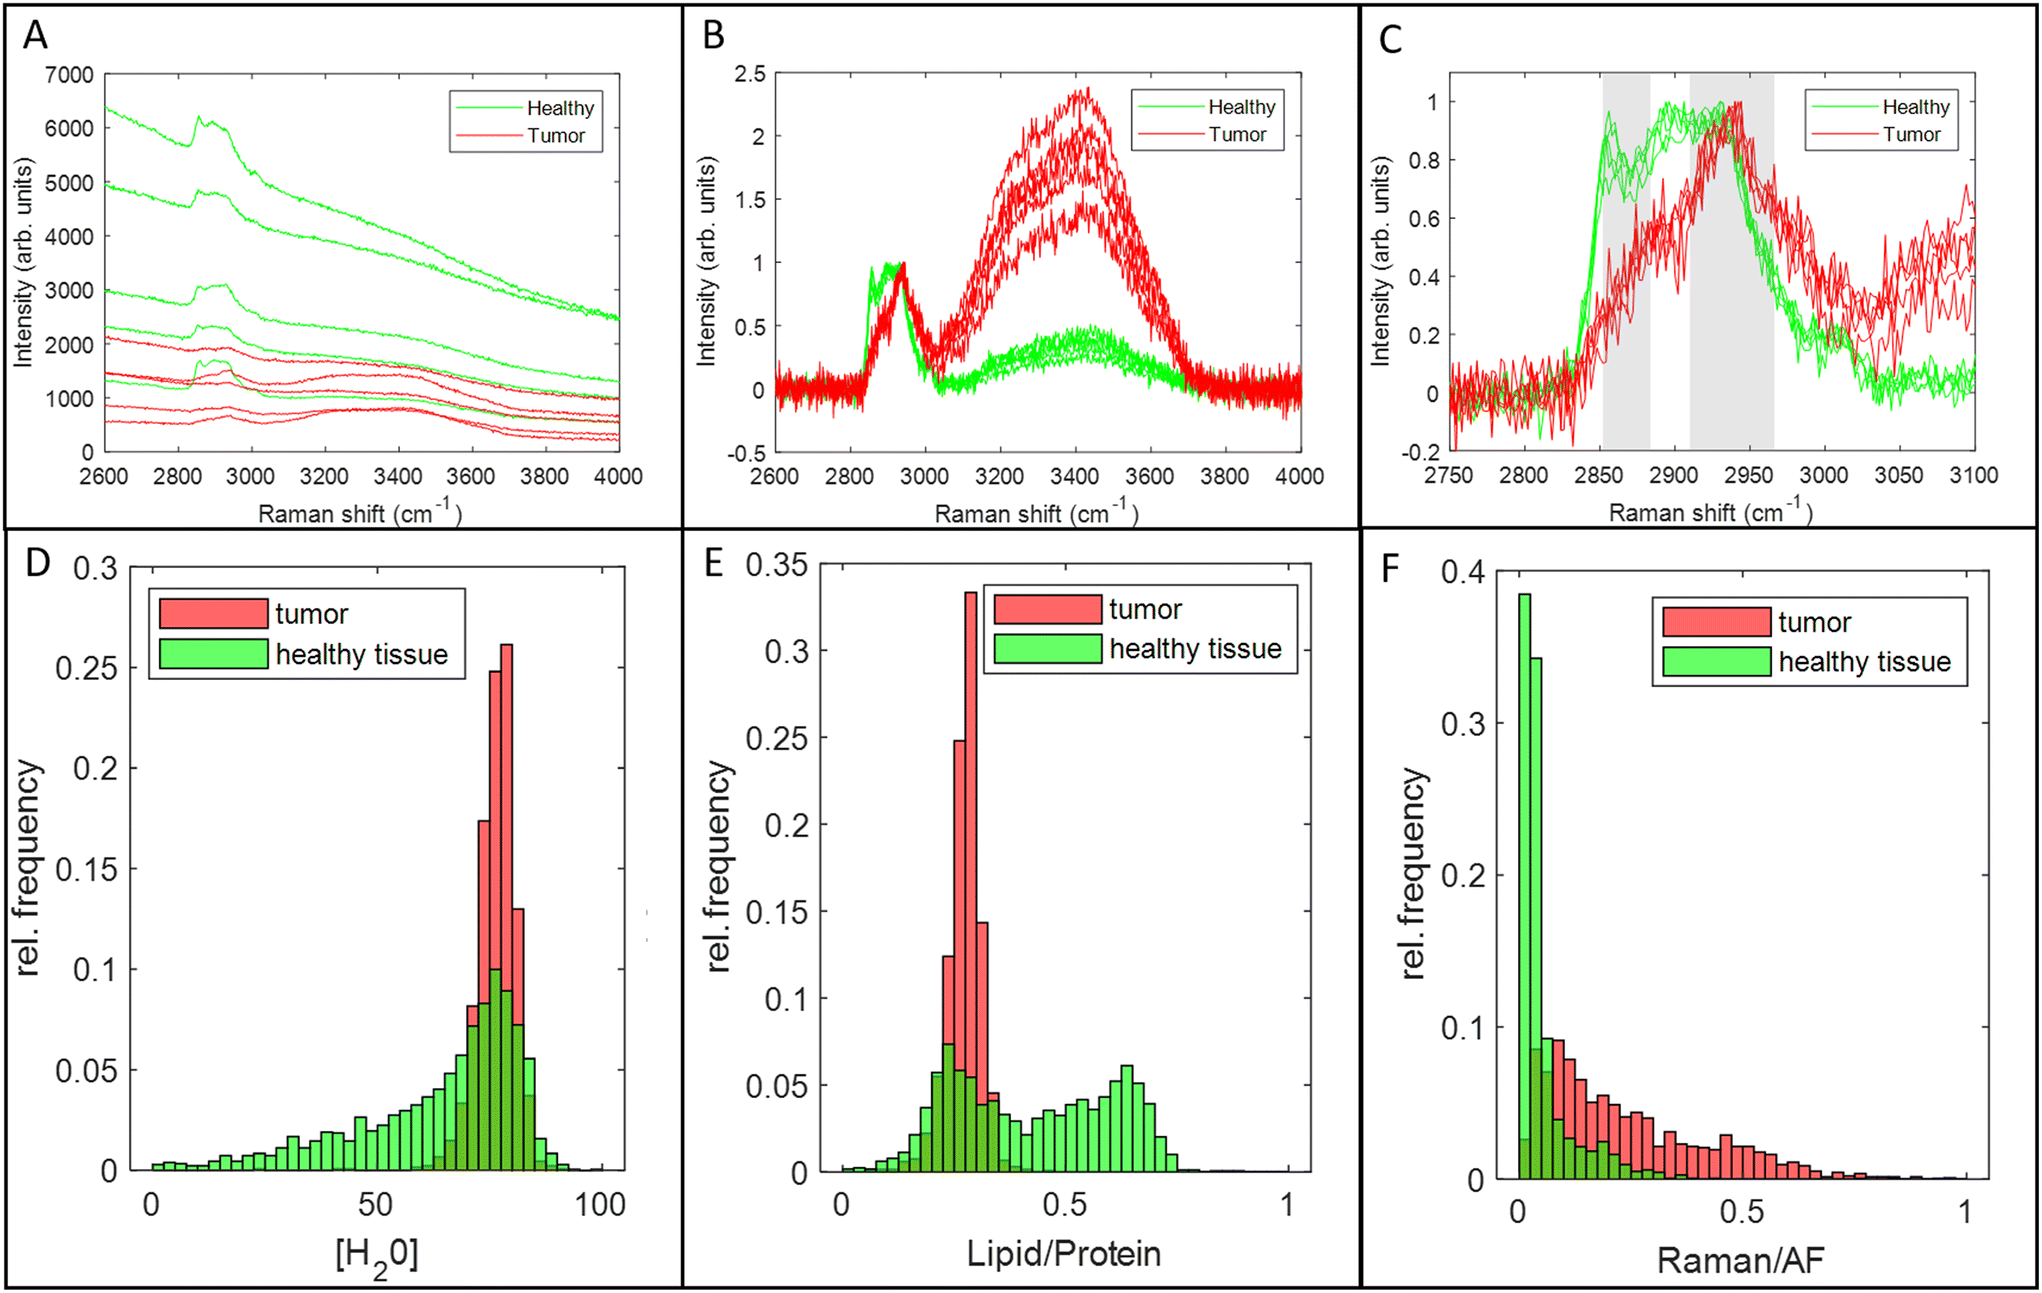 | ||
| Fig. 5 Examples of Raman spectra of tumor and healthy tissue. (A). Raman spectra after pre-processing (Materials and methods, section Data preprocessing), illustrating the higher tissue autofluorescence (AF) background in most healthy tissue spectra. (B). Raman spectra of figure A after subtraction of the AF background and intensity normalization on the CH-stretching region (2910–2966 cm−1), illustrating the higher intensity in the OH-stretching region (3350–3550 cm−1) in tumor spectra due to the higher water concentration in tumor.19,20 (C). Close-up of the 2750–3100 cm−1 CH-stretching region of the spectra of figure B, illustrating the higher lipid-to-protein band ratio in healthy tissue. (D). Histogram of [H2O] values. (E). Histogram of Lipid/Protein values. (F). Histogram of Raman/AF values. | ||
The calculated values of [H2O], Lipid/Protein, and Raman/AF, and the respective histological annotation of each spectrum were used as input for the development of the tissue classification mode (see Materials and Methods). The tissue classification model showed a discriminative power of 0.93 (based on the area under the ROC-curve, Fig. 6A), an accuracy of 0.89, a sensitivity of 0.87, and a specificity of 0.91 at the tumor probability threshold value of 0.5.
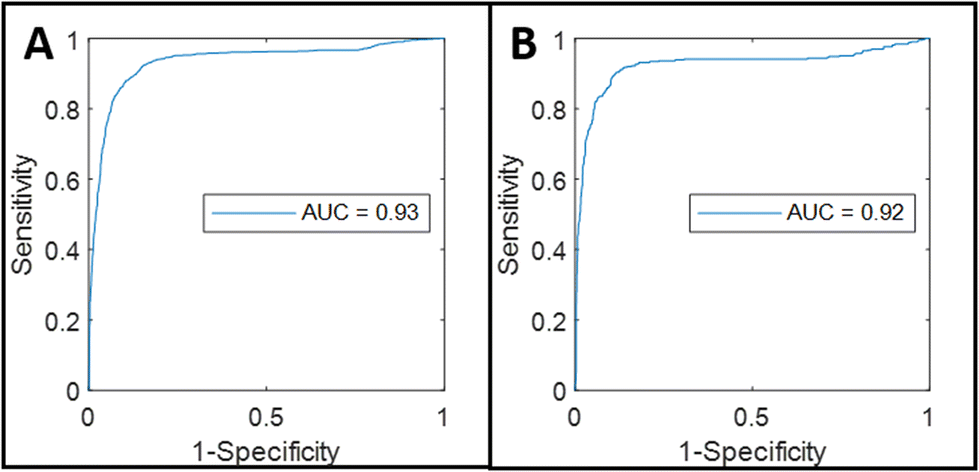 | ||
| Fig. 6 ROC-curves for the development and validation data sets of the tissue classification model. (A). ROC-curve of the leave-one-patient-out internal validation of the tissue classification model. (B). ROC-curve of the validation of the tissue classification model on the independent data set. | ||
The developed classification model was validated on an independent data set obtained from specimens of 15 patients, made up of 426 tumor spectra and 1240 healthy tissue spectra. A discriminative power of 0.92, an accuracy of 0.90, a sensitivity of 0.85, and a specificity of 0.92 were found.
Margin length prediction model
Raman profile measurements were performed on fresh intact specimens of 31 OCSCC patients, to obtain tumor probability profiles from the resection surface to a depth of 7 mm. Patient and tumor characteristics are shown in ESI Table 3.†Data from fourteen specimens were used for the development of the margin length prediction model. Raman and histology data were obtained at 44 resection surface locations (28 adequate margins and 16 inadequate margins) yielding a total of 217 tumor probability profiles (examples are shown in Fig. 7).
 | ||
| Fig. 7 Examples of tumor probability profiles. (A): Tumor probability <0.5 over the entire length of the profile. (B): Tumor probability ≥0.5 over the entire length of the profile. (C): Starting segment with tumor probability <0.5 followed by a segment with tumor probability ≥0.5. (D): Multiple alternating segments of high (≥0.5) and low (<0.5) tumor probability. | ||
The data set contained 86 profiles with a tumor probability <0.5 over the entire length of the profile, 22 profiles with a starting segment of tumor probability <0.5 after which tumor probability changed and remained≥ 0.5, and 9 profiles with tumor probability≥ 0.5 over their entire length. Interpretation of these profiles in terms of margin length prediction is straightforward (Materials and methods and ESI Table 5†).
One hundred profiles had more complex shapes with alternating segments of high (≥0.5; H) and low (<0.5; L) tumor probability.
The combination of the Hmin and Lmax values (see Materials and Methods) that yielded the lowest mean error between margin length prediction and histology was: Hmin = 4 mm and Lmax = 2 mm, leading to the decision rules shown in ESI Table 5.†
Using these decision rules, the mean margin length prediction by Raman spectroscopy was compared to the mean histological margin length, for each measurement location. Five of the 44 measurement locations were excluded because insufficient valid tumor probability profiles were available for the calculation of a mean margin length prediction.
Fig. 8A shows the histogram of the error in margin length prediction for the development data set. The mean difference between margin length prediction by the RIOARM-device and histology was −0.15 mm, showing an absence of significant bias. The mean absolute difference in the margin length prediction was 0.69 mm, which is within the estimated error margin of the gold standard histological margin length.
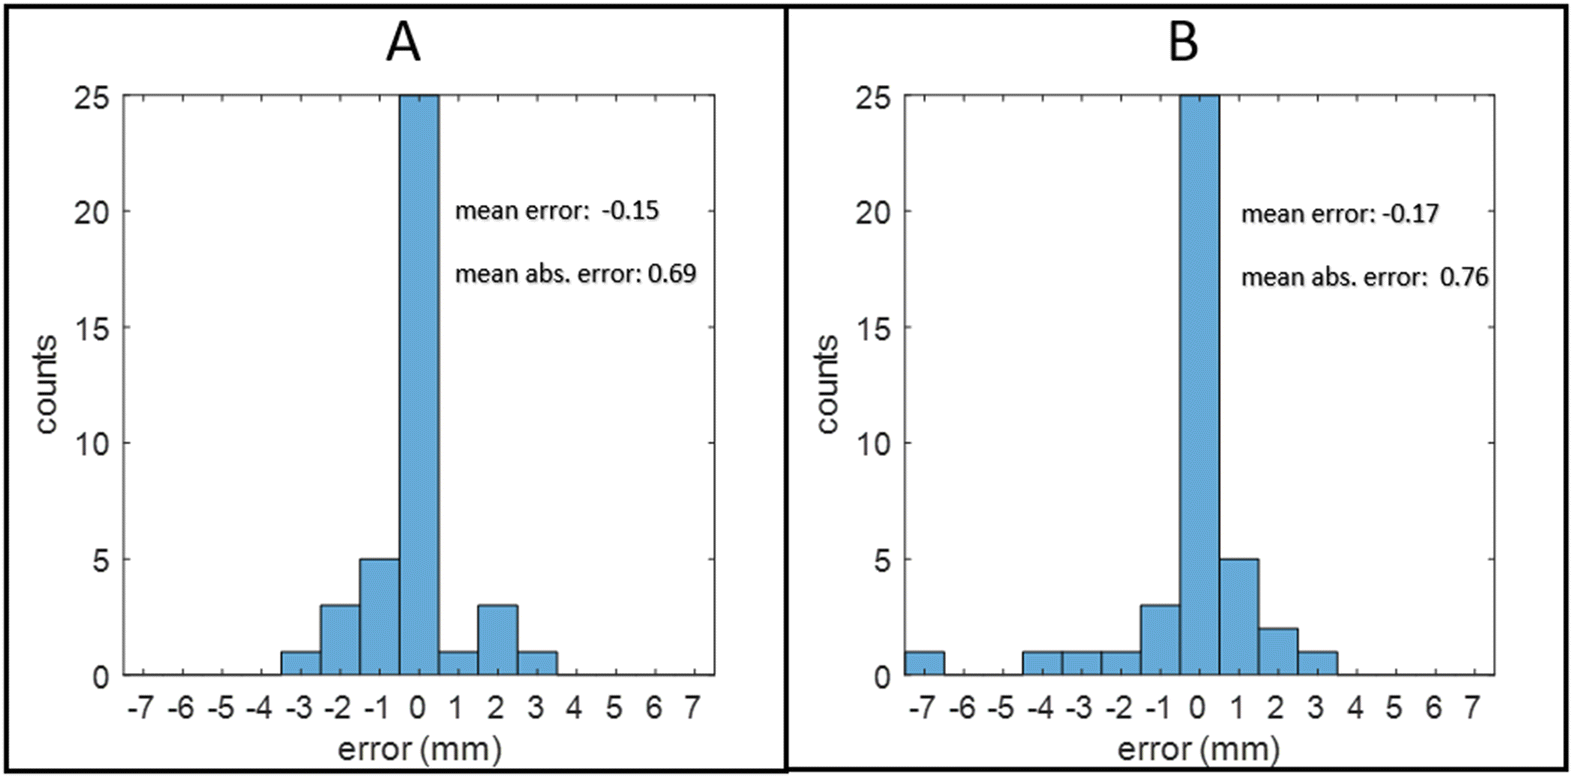 | ||
| Fig. 8 Histograms of margin length prediction errors (RIOARM-device margin length prediction minus gold standard histological margin length). (A): Results for the model data set on which the model parameters were optimized. (B): Results for the independent validation data set. | ||
An independent data set, obtained from 17 specimens (44 measurement locations; 29 adequate margins and 15 inadequate margins, and a total of 211 tumor probability profiles) was used for the validation of the margin length prediction model. Four measurement locations were excluded because insufficient valid tumor probability profiles were available for the calculation of a mean margin length prediction.
Fig. 8B shows the histogram of the error in the margin length prediction. The mean difference between margin length prediction by the RIOARM-device and histopathology was −0.17 mm. The mean absolute difference in the margin length prediction was 0.76 mm.
Fig. 9 shows the confusion matrix of RIOARM-device adequate/inadequate margin predictions based on individual Raman profiles against histology. In 166 cases the RIOARM-device prediction is correct. There are 9 false negatives (i.e., missed inadequate margins) and 2 false positives. Based on these numbers, sensitivity and specificity for inadequate margins are 78% and 98%, respectively.
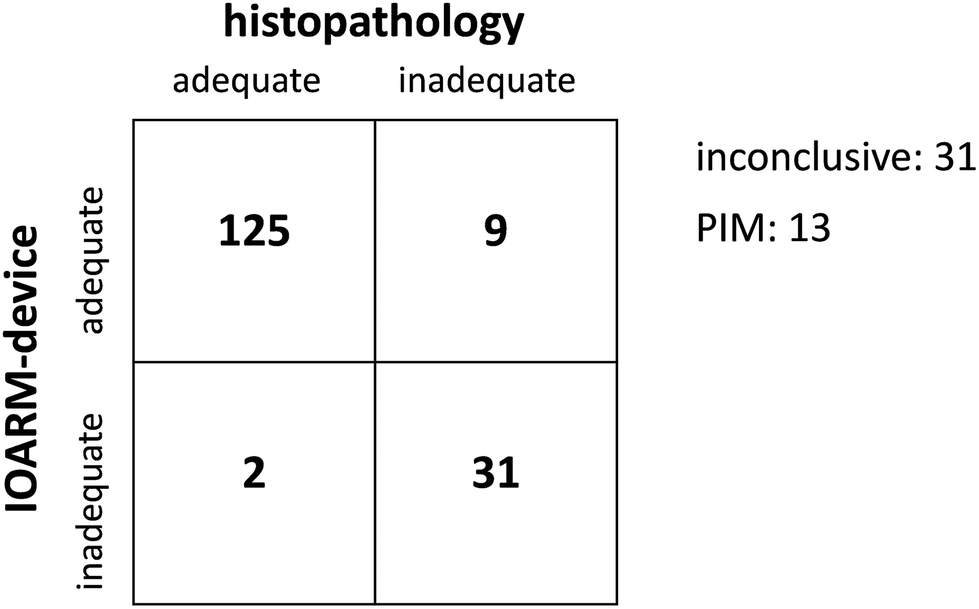 | ||
| Fig. 9 Confusion matrix of RIOARM-device adequate/inadequate margin predictions against histology. The acronym PIM stands for potentially inadequate margin. | ||
The RIOARM-device returned a margin length between 4 and 6 mm for 13 profiles. Given the mean absolute error in the margin length prediction (0.76 mm) we classify such a result as “potentially inadequate margin (PIM)”.
Of the 211 profiles in the validation data set, 31 belonged to the inconclusive category of ESI Table 5,† for which currently no margin length prediction is rendered. These are separately mentioned in Fig. 9.
Discussion
The clinical relevance of adequate resection margins in OCSCC surgery is evident. Patients with adequate resection margins have higher survival rates and fewer patients need adjuvant (radio)therapy; a well-known cause of additional morbidity.4,5,29This study demonstrates the feasibility of an easy-to-use device for the objective assessment of tumor resection margins on fresh resection specimens. A measurement at a single location takes about 5 seconds and in principle, data analysis can take place in real-time, although for this paper it was carried out off-line. This allows for the assessment of the resection margins at many locations of a specimen, within a short period of time, while the patient is still in the operating room. Moreover, the measurements could be carried out in, or close to, the operating room and would not necessarily be carried out by a pathologist.
The mean absolute error in the margin length prediction by the RIOARM-device was <1 mm. This is within the estimated 1 mm uncertainty in our gold standard histological margin length assessment. Moreover, the RIOARM-device showed no positive or negative bias in margin length with respect to histology.
Therefore, it may be expected that the RIOARM-device will indicate adequate and inadequate margins with high accuracy. This is confirmed by a test on the profiles of the margin length prediction validation data set. If a “PIM”- or an “inconclusive”-result would be obtained, additional measurements close to that location could be performed for a definitive result.
Despite the very high specificity, inevitably some false positives will occur. If an isolated measurement shows an “inadequate margin”-result, additional measurements can be performed in the vicinity of that location, to either confirm or reject that result.
The combination of high specificity (98%) and short measurement time can partly compensate for the lower 78% sensitivity, because it enables measurements at many locations, without the risk of introducing high numbers of false positive results. Moreover, both the tissue classification model and the margin length prediction model, although validated on independent data sets, are still based on data sets of limited sizes. Therefore, it is expected that they can be further improved.
The next step towards implementation of the technology, is the development of a measurement protocol for systematic IOARM and result reporting, that takes the above considerations into account. It appears feasible to determine the resection margins on a specimen at up to 100 locations within an acceptable time frame of 15 minutes, which is currently not achievable in any other way. Intraoperative detection of inadequate margins can be combined with the recently introduced paired-tagging technique for accurate relocation of such inadequate margins in the wound bed.30 This provides the surgeon with the opportunity to return to the patient and remove additional tissue at the exact location of the inadequate margin, to achieve an adequate tumor resection.
Conclusions
We have presented the development and technical validation of a Raman spectroscopic technology for quick and accurate assessment of oral cavity tumor resection margins.We expect that the intraoperative assessment of resection margins based on Raman spectroscopy will lead to at least the same dramatic improvement in the rate of adequate resections, that was obtained with the IOARM-method based on visual inspection and palpation of the specimen. However, RIOARM is much more conducive to widespread adoption.5
Margin status is an important prognostic factor, and one of the few that can be brought under the control of the surgeon. Especially in oral cancer surgery, there is immense room for improvement. RIOARM has the potential to play an important role in addressing this need.
We have developed our technology with a focus on oral cancer surgery, but its application is by no means limited to that. The ability to locate the closest resection margin intraoperatively provides the surgeon with actionable information that facilitates the further improvement of many other tumor resection procedures.31
Author contributions
YA: Conceptualization, data curation, formal analysis, investigation, methodology, project administration, validation, visualization, writing – original draft, writing – review & editing. MNS: Conceptualization, data curation, formal analysis, methodology, project administration, software, validation, visualization, writing – original draft, writing – review & editing. TBS: Conceptualization, data curation, formal analysis, investigation, methodology, project administration, software, supervision, validation, visualization, writing – original draft, writing – review & editing. EB: Conceptualization, data curation, formal analysis, investigation, methodology, project administration, software, validation, visualization, writing – original draft, writing – review & editing. MvdW: Investigation, software, visualization, writing – review & editing. ES: Investigation, software, visualization, writing – review & editing. VA: Investigation, resources, visualization, writing – review & editing. AB: Investigation, resources, visualization, writing – review & editing. IU: Investigation, resources, visualization, writing – review & editing. CvL: Investigation, writing – review & editing. LO: Investigation, data curation, validation, visualization, writing – original draft, writing – review & editing. HM: Investigation, writing – review & editing. ItH: Investigation, writing – review & editing. BJ: Investigation, writing – review & editing. SKe: Investigation, writing – review & editing. DM: Investigation, writing – review & editing. AS: Investigation, writing – review & editing. JH: Investigation, writing – review & editing. RBJ: Investigation, writing – review & editing. SKo: Conceptualization, data curation, formal analysis, funding acquisition, investigation, methodology, project administration, resources, supervision, validation, visualization, writing – original draft, writing – review & editing. GP: Conceptualization, data curation, formal analysis, funding acquisition, investigation, methodology, project administration, resources, software, supervision, validation, visualization, writing – original draft, writing – review & editing.Conflicts of interest
G. J. P, T. C. B. S. M. vd W. are employees and shareholders of RiverD International B. V. R. J. B. J. and I. H. are shareholders of RiverD International B. V. M. R. N. S. and E. S. are employees of RiverD International B. V. V. A. is a shareholder of art photonics GmbH. I. U. and A. B. are employees of art photonics GmbH.Acknowledgements
We would like to thank Mahesh Algoe, Sanneke Matlung, Roxanna Haak, Vera van Dis, Ian Overduin, and Vincent Noordhoek Hegt for their expert assistance in tissue processing, study logistics, carrying our measurements, and for valuable discussions.Financial support – the Dutch Cancer Society (Project 106467) and the EU-Eurostars-programme (Project 12076 – RA-SURE).
References
- J. Ferlay, M. Colombet, I. Soerjomataram, C. Mathers, D. M. Parkin, M. Piñeros, A. Znaor and F. Bray, Int. J. Cancer, 2019, 144, 1941–1953 CrossRef CAS PubMed.
- M. A. Varvares, S. Poti, B. Kenyon, K. Christopher and R. J. Walker, Laryngoscope, 2015, 125, 2298–2307 CrossRef PubMed.
- Y. Aaboubout, I. ten Hove, R. W. H. Smits, J. A. Hardillo, G. J. Puppels and S. Koljenovic, Oral Dis., 2021, 27(1), 111–116, DOI:10.1111/odi.13619.
- R. W. H. Smits, S. Koljenović, J. A. Hardillo, I. ten Hove, C. A. Meeuwis, A. Sewnaik, E. A. C. Dronkers, T. C. Bakker Schut, T. P. M. Langeveld, J. Molenaar, V. N. Hegt, G. J. Puppels and R. J. Baatenburg de Jong, Head Neck, 2016, 38, E2197–E2203 CrossRef PubMed.
- R. W. H. Smits, C. G. F. van Lanschot, Y. Aaboubout, M. de Ridder, V. N. Hegt, E. M. Barroso, C. A. Meeuwis, A. Sewnaik, J. A. Hardillo, D. Monserez, S. Keereweer, H. Mast, I. Ten Hove, T. C. Bakker Schut, R. J. Baatenburg de Jong, G. J. Puppels and S. Koljenović, Front. Oncol., 2020, 10, 1–9 CrossRef PubMed.
- E. A. Dik, S. M. Willems, N. A. Ipenburg, S. O. Adriaansens, A. J. W. P. Rosenberg and R. J. J. Van Es, Oral Oncol., 2014, 50(6), 611–615, DOI:10.1016/j.oraloncology.2014.02.014.
- F. J. Voskuil, J. Vonk, B. van der Vegt, S. Kruijff, V. Ntziachristos, P. J. van der Zaag, M. J. H. Witjes and G. M. van Dam, Nat. Biomed. Eng., 2021, 6(5), 503–514, DOI:10.1038/s41551-021-00808-8.
- K. J. de Koning, S. A. Koppes, R. de Bree, J. W. Dankbaar, S. M. Willems, R. J. J. van Es and R. Noorlag, Oral Oncol., 2021, 116, 105249, DOI:10.1016/j.oraloncology.2021.105249.
- J. Heidkamp, W. L. J. Weijs, A. C. H. van Engen-van Grunsven, I. de Laak-de Vries, M. C. Maas, M. M. Rovers, J. J. Fütterer, S. C. A. Steens and R. P. Takes, Head Neck, 2020, 42(8), 2039–2049, DOI:10.1002/hed.26125.
- J. Heidkamp, M. Scholte, C. Rosman, S. Manohar, J. J. Fütterer and M. M. Rovers, Int. J. Cancer, 2021, 149(3), 635–645, DOI:10.1002/ijc.33570.
- J. J. Kain, A. C. Birkeland, N. Udayakumar, A. B. Morlandt, T. M. Stevens, W. R. Carroll, E. L. Rosenthal and J. M. Warram, Laryngoscope, 2020, 130(1), 128–138, DOI:10.1002/lary.27943.
- R. Noorlag, R. de Bree and M. J. H. Witjes, Curr. Opin. Oncol., 2022, 34(3), 170–176, DOI:10.1097/CCO.0000000000000824.
- C. I. Faur, A. Falamas, M. Chirila, R. C. Roman, H. Rotaru, M. A. Moldovan, S. Albu, M. Baciut, I. Robu and M. Hedesiu, Int. J. Oral Maxillofac. Surg., 2022, 51(11), 1373–1381, DOI:10.1016/j.ijom.2022.02.015.
- H. P. S. Heng, C. Shu, W. Zheng, K. Lin and Z. Huang, Transl. Biophotonics, 2021, 3(1) DOI:10.1002/tbio.202000018.
- M. G. Lizio, R. Boitor and I. Notingher, Analyst, 2021, 146(12), 3799–3809, 10.1039/D1AN00296A.
- H. J. Byrne, I. Behl, G. Calado, O. Ibrahim, M. Toner, S. Galvin, C. M. Healy, S. Flint and F. M. Lyng, Spectrochim. Acta, Part A, 2021, 252, 119470, DOI:10.1016/j.saa.2021.119470.
- G. Azemtsop Matanfack, J. Rüger, C. Stiebing, M. Schmitt and J. Popp, J. Biophotonics, 2020, 13(9), e202000129, DOI:10.1002/jbio.202000129.
- T. J. E. Hubbard, A. Shore and N. Stone, Analyst, 2019, 144, 6479–6496 RSC.
- D. Bury, C. L. M. Morais, K. M. Ashton, T. P. Dawson and F. L. Martin, Biosensors, 2019, 9(2), 49, DOI:10.3390/bios9020049.
- S. Koljenović, T. C. Bakker Schut, R. Wolthuis, B. de Jong, L. Santos, P. J. Caspers, J. M. Kros and G. J. Puppels, J. Biomed. Opt., 2005, 10(3), 031116, DOI:10.1117/1.1922307.
- I. P. Santos, P. J. Caspers, T. C. Bakker Schut, R. Van Doorn, V. Noordhoek Hegt, S. Koljenović and G. J. Puppels, Anal. Chem., 2016, 88(15), 7683–7688, DOI:10.1021/acs.analchem.6b01592.
- R. Wolthuis, T. C. B. Schut, P. J. Caspers, H. P. J. Buschman, T. J. Römer, H. A. Bruining and G. J. Puppels, in Fluorescent and Luminescent Probes for Biological Activity, Elsevier, 1999, pp. 433–455 Search PubMed.
- P. J. Caspers, G. W. Lucassen, E. A. Carter, H. A. Bruining and G. J. Puppels, J. Invest. Dermatol., 2001, 116(3), 434–442, DOI:10.1046/j.1523-1747.2001.01258.x.
- E. M. Barroso, R. W. H. Smits, T. C. Bakker Schut, I. ten Hove, J. A. Hardillo, E. B. Wolvius, R. J. Baatenburg de Jong, S. Koljenović and G. J. Puppels, Anal. Chem., 2015, 87(4), 2419–2426, DOI:10.1021/ac504362y.
- E. M. Barroso, R. W. H. Smits, C. G. F. van Lanschot, P. J. Caspers, I. ten Hove, H. Mast, A. Sewnaik, J. A. Hardillo, C. A. Meeuwis, R. Verdijk, V. Noordhoek Hegt, R. J. Baatenburg de Jong, E. B. Wolvius, T. C. Bakker Schut, S. Koljenović and G. J. Puppels, Cancer Res., 2016, 76, 5945–5953 CrossRef CAS PubMed.
- E. M. Barroso, I. ten Hove, T. C. Bakker Schut, H. Mast, C. G. F. van Lanschot, R. W. H. Smits, P. J. Caspers, R. Verdijk, V. Noordhoek Hegt, R. J. Baatenburg de Jong, E. B. Wolvius, G. J. Puppels and S. Koljenović, Eur. J. Cancer, 2018, 92, 77–87, DOI:10.1016/j.ejca.2018.01.068.
- C. S. Choe, J. Lademann and M. E. Darvin, J. Dermatol. Sci., 2015, 79(2), 176–178, DOI:10.1016/j.jdermsci.2015.05.004.
- K. Czamara, Z. Majka, M. Sternak, M. Koziol, R. B. Kostogrys, S. Chlopicki and A. Kaczor, Int. J. Mol. Sci., 2020, 21(14), 4838, DOI:10.3390/ijms21144838.
- C.-J. Kang, Y.-W. Wen, S.-R. Lee, L.-Y. Lee, C. Hsueh, C.-Y. Lin, K.-H. Fan, H.-M. Wang, C.-H. Hsieh, S.-H. Ng, C.-H. Yeh, C.-H. Lin, C.-K. Tsao, T.-J. Fang, S.-F. Huang, L.-A. Lee, K.-H. Fang, T.-C. Yen, N.-M. Cheng, T.-Y. Tsai, S.-F. Tai and C.-Y. Tsai, Cancers, 2021, 14, 15 CrossRef PubMed.
- C. G. F. van Lanschot, H. Mast, J. A. Hardillo, D. Monserez, I. ten Hove, E. M. Barroso, F. L. J. Cals, R. W. H. Smits, M. F. van der Kamp, C. A. Meeuwis, A. Sewnaik, R. Verdijk, G. J. L. H. van Leenders, V. Noordhoek Hegt, T. C. Bakker Schut, R. J. Baatenburg de Jong, G. J. Puppels and S. Koljenović, Head Neck, 2019, 41(7), 2159–2166, DOI:10.1002/hed.25690.
- I. P. Santos, E. M. Barroso, T. C. Bakker Schut, P. J. Caspers, C. G. F. van Lanschot, D.-H. Choi, M. F. van der Kamp, R. W. H. Smits, R. van Doorn, R. M. Verdijk, V. Noordhoek Hegt, J. H. von der Thüsen, C. H. M. van Deurzen, L. B. Koppert, G. J. L. H. van Leenders, P. C. Ewing-Graham, H. C. van Doorn, C. M. F. Dirven, M. B. Busstra, J. Hardillo, A. Sewnaik, I. ten Hove, H. Mast, D. A. Monserez, C. Meeuwis, T. Nijsten, E. B. Wolvius, R. J. Baatenburg de Jong, G. J. Puppels and S. Koljenović, Analyst, 2017, 142, 3025–3047 RSC.
Footnote |
| † Electronic supplementary information (ESI) available. See DOI: https://doi.org/10.1039/d3an00650f |
| This journal is © The Royal Society of Chemistry 2023 |