
The impact of RGO and MWCNT/RGO on the microwave absorption of NiFe2O4@Fe3O4 in the presence or absence of PANI
Farnaz
Jamadi
,
Jamileh
Seyed-Yazdi
 *,
Fatemeh
Ebrahimi-Tazangi
* and
Seyed Mohammad
Hosseiny
*,
Fatemeh
Ebrahimi-Tazangi
* and
Seyed Mohammad
Hosseiny
Department of Physics, Faculty of Science, Vali-e-Asr University of Rafsanjan, Rafsanjan, Iran. E-mail: j.seyedyazdi@gmail.com; fatemehebrahimi.edu2024@gmail.com
First published on 16th July 2024
Abstract
This study investigates the impact of 1D (MWCNT) and 2D (RGO) carbonaceous structures on the microwave absorption performance of NiFe2O4@Fe3O4 nanocomposites decorated with/without PANI. These nanocomposites were fabricated using hydrothermal, coprecipitation, and in situ polymerization methods, resulting in various morphologies. The absorbers feature core@shell structures, 1D nanotubes, and 2D reduced graphene oxide layers, coated with polyaniline. These components contribute to quad-band absorption in the S, C, X, and Ku bands, with a maximum effective absorption bandwidth of 4.8 GHz for S7 at a matching thickness of only d = 1.6 mm. The optimal reflection loss for S5 reaches RLmin of −47.5 dB at 4.6 GHz with a matching thickness of 4.6 mm, showing its best EAB of 4 GHz for d = 1.6 mm. Additionally, CST simulation software demonstrates that the prepared materials effectively dissipate microwave energy in practical use. The impressive reflection loss and quad-band absorption are a result of the synergetic effects of various factors, such as core@shell structures, heterogeneous interfaces, multidimensional structures, and created defects. Analysis using the Smith chart confirmed the excellent impedance matching properties and strong electromagnetic wave attenuation of the conductive network of PANI/MWCNT/RGO, which collectively enhance the broadband absorption performance. The results of our study on MWCNT/graphene/polymer-based magneto-electric nanocomposite systems offer a promising foundation for the development of lightweight, high-performance microwave-absorbing materials with potential practical applications.
1 Introduction
With the continuous and rapid advancement of electronic communication technology, popular intelligent electronic devices have brought convenience to people's lives, yet they also present a serious health risk due to the generation of electromagnetic (EM) pollution. In this era of telecommunications, many new electronic devices are being developed to address human needs, many of which operate at gigahertz frequencies. Various solutions have been proposed to mitigate concerns such as electromagnetic interference pollution, performance disruptions, and potential health hazards. One promising approach to addressing these issues involves utilizing absorbent materials, leading to significant research and development efforts in the realm of microwave-absorbing materials (MAMs).1–5As a result, EM protective materials can incorporate magnetic substances like spinel ferrites (MFe2O4, where M represents elements such as Fe, Ni, Co, Cu, Zn, Mn, and Mg). Ferrites are recognized for their chemical and thermal stability, as well as their adjustable absorption capabilities. These materials are renowned for their ferrimagnetic properties, which allow them to efficiently convert EM energy into thermal and various other forms of energy.6 Nickel ferrite (NiFe2O4) is distinguished by its exceptional properties, such as high resistivity, magnetic permeability, low coercivity, significant saturation magnetization, high anisotropy field, and corrosion resistance,7,8 making it valuable for various applications like supercapacitors,9,10 electrocatalysis,11 and microwave absorption.12,13 Its distinctive attributes also make it a suitable choice for use as soft magnetic materials in high-frequency applications.14,15
In various industries, magnetite (Fe3O4) is commonly utilized as a magnetic loss microwave absorbent due to its high Curie temperature, strong spin polarization, affordability, and semi-metallic properties that make it suitable for microwave absorption applications. To enhance its dielectric loss capabilities, Fe3O4 can be combined with conductive carbonaceous materials.16,17
Carbon-based materials such as graphene, graphene oxide (GO), reduced graphene oxide (RGO), and carbon nanotube (CNT) possess exceptional characteristics such as superior thermal conductivity, chemical stability, large specific surface area, low density, thin profile, high conductivity, and inherent polarization.18,19 High permittivity and electrical conductivities enable the formation of an interconnected network within nanocomposites, which enhances microwave absorption dissipation.20–23
Over the past few decades, significant research has focused on polymers, particularly conductive polymers like polyaniline (PANI), to develop composite materials with enhanced magnetic and dielectric attributes. PANI offers numerous advantages, such as excellent thermal, chemical, and environmental stability, high conductivity, lightweight nature, cost-effectiveness, and significant mechanical properties.24 The high spin density of PANI25 positions it as a promising candidate for combination with ferrites in MAMs. For example, Cai et al. synthesized an RGO/f-Fe3O4(1![[thin space (1/6-em)]](https://www.rsc.org/images/entities/char_2009.gif) :10)@PANI composite that exhibited the best reflection loss of −46.49 dB at 9.93 GHz with a thickness of only 2.5 mm and a broadband of 4.25 GHz.17
:10)@PANI composite that exhibited the best reflection loss of −46.49 dB at 9.93 GHz with a thickness of only 2.5 mm and a broadband of 4.25 GHz.17
Numerous studies have explored the properties of ferrites and carbon-based materials. For example, Ebrahimi-Tazangi et al. synthesized α-Fe2O3@CoFe2O4/GO nanocomposites via the hydrothermal method, decorating the GO surface with two ratios (3:1) and (5:1) to GO. Their (5:1) sample exhibited the highest reflection loss of −81.24 dB at 11.98 GHz, with a thickness of 1.4 mm and a broadband of 3.78 GHz.26 Moreover, Zhang et al. combined carbon nanofibers with cobalt ferrite, leading to outstanding microwave absorption properties. The composite demonstrated a maximum reflection loss of −137 dB at 11.3 GHz with a thickness of 2.6 mm.27 Additionally, Ma et al. hydrothermally synthesized spherical RGO/ZnFe2O4/Ni nanohybrids and achieved an optimal reflection loss of −22.57 dB at 4.2 GHz with a thickness of 2.5 mm and a broadband of 6.6 GHz.28 Li et al. achieved a notable reflection loss of −76.5 dB at 7.9 GHz for MnFe2O4/RGO/Diatomite, with an effective bandwidth of 3.6 GHz, using a 2.5 mm thickness.29 Previous research suggests that utilizing nanostructures with heterogeneous multi-layers can enhance absorption performance. Therefore, in this study, various multi-component MAMs comprising NiFe2O4/Fe3O4/PANI NiFe2O4/Fe3O4/PANI/MWCNT, NiFe2O4/Fe3O4/PANI/RGO, NiFe2O4/Fe3O4/RGO/MWCNT, and NiFe2O4/Fe3O4/PANI/RGO/MWCNT were synthesized through different methods. The structural, morphological, magnetic, and microwave absorption properties of these nanocomposites were thoroughly investigated.
2 Experimental
2.1 Materials
Ni(NO3)2·6H2O, Fe(NO3)2·9H2O, NH4·OH, FeCl2·4H2O (purity: 99.99%), FeCl3·6H2O (purity: 98%), PANI, RGO, multi-walled carbon nanotubes (MWCNT), ammonia, hydrochloric acid (HCl), ethanol (ET) (99.9%), (NH4)2·S2O8 (ammonium persulfate), were obtained from Merck (Germany).2.2 Synthesis of NiFe2O4 (S1)
NiFe2O4 was synthesized using the hydrothermal method. Initially, 50 mmol of Fe (NO3)2·9H2O and 25 mmol of Ni (NO3)2·6H2O were dissolved in 76 mL of deionized (DI) water and stirred separately for 20 minutes. Subsequently, ammonia solution was dropwise added to the mixture while stirring for 1 hour to adjust the pH of the precursor solution to 11. After ultrasonication of the mixed solution for 1 hour, it was transferred into a 250 mL Teflon-lined stainless steel autoclave and sealed. The autoclave was then heated to 180 °C and maintained at this temperature for 24 hours for the hydrothermal reaction. After the reaction, the autoclave was allowed to cool to room temperature. The resulting product was washed five times with ethanol and DI water to achieve a neutral pH of 7. Finally, the sample was separated using a magnet and dried at 40 °C for 6 hours.2.3 Synthesis of NiFe2O4/Fe3O4 (S2)
NiFe2O4/Fe3O4 was prepared using the co-precipitation method. Initially, 0.75 g of NiFe2O4 was dissolved in 100 mL DI water, stirred for 30 minutes, and subjected to ultrasonication for 40 minutes. Subsequently, the solution was placed in an oil bath at 75 °C, and 2.6 g of FeCl3·6H2O and 1.6 g of FeCl2·4H2O were added. The mixture was stirred for 30 minutes under a nitrogen atmosphere. Following this, 15 mL of ammonia was added dropwise to the solution under the same conditions, and the solution was heated and stirred for an additional two hours. Finally, the resulting product (S2) was collected using a magnet, washed with ethanol and DI water until reaching a neutral pH of 7, and then dried.2.4 Synthesis of NiFe2O4/Fe3O4/PANI (S3)
Initially, 1.4 g of NiFe2O4/Fe3O4 was dissolved in 100 mL of DI water and sonicated for 35 minutes. A solution was prepared by adding 0.33 mL of HCl to 100 mL of DI water. Following this, the HCl solution was combined with the solution containing NiFe2O4/Fe3O4, and 0.7 g of aniline was added dropwise. The mixture was dispersed using ultrasonication for 60 minutes and subsequently placed in an ice bath at 0–5 °C with continuous stirring for an additional 60 minutes. Finally, 0.7 g of ammonium persulfate dissolved in 60 mL of water was added to the mixture, and the resulting mixture was stirred for 7 hours at 0–5 °C. After collection using a magnet, washing with DI water and ethanol, the product was dried.2.5 Synthesis of NiFe2O4/Fe3O4/PANI/RGO (S4)
The initial step involved dissolving 0.3 g of NiFe2O4/Fe3O4/PANI in 100 mL of deionized (DI) water and dispersing it using ultrasonication. Subsequently, 0.1 g of RGO was dissolved in a mixture of 100 mL of DI water and ethanol. The first solution and the RGO solution were then combined and stirred for 24 hours. The synthesis of NiFe2O4/Fe3O4/PANI/MWCNT (S5) was carried out using the same procedure.2.6 Synthesis of NiFe2O4/Fe3O4/RGO/MWCNT (S6)
0.3 g of NiFe2O4/Fe3O4 was dissolved in 100 mL of DI water. Subsequently, 0.05 g of RGO and 0.05 g of MWCNT were dissolved in a mixture of 25 mL of DI water and 75 mL of ethanol, and the solution was dispersed using probe sonication for 30 minutes. Finally, the two solutions were combined and stirred for 24 hours using a magnetic stirrer.2.7 Synthesis of NiFe2O4/Fe3O4/PANI/RGO/MWCNT (S7)
0.3 g of NiFe2O4/Fe3O4/PANI was dissolved in 100 mL DI water. Subsequently, 0.05 g of RGO and 0.05 g of MWCNT, previously dissolved in a mixture of DI water and ethanol and dispersed, were combined. The resulting materials were then stirred for 24 hours using a magnetic stirrer and subsequently dried.The prepared samples, namely NiFe2O4, NiFe2O4/Fe3O4, NiFe2O4/Fe3O4/PANI, NiFe2O4/Fe3O4/PANI/RGO, NiFe2O4/Fe3O4/PANI/MWCNT, NiFe2O4/Fe3O4/RGO/MWCNT, and NiFe2O4/Fe3O4/PANI/RGO/MWCNT, are designated as S1, S2, S3, S4, S5, S6, and S7, respectively. The steps involved in the preparation of the nanocomposite samples are illustrated in Fig. 1.
 | ||
| Fig. 1 Schematic representation of the synthesis of samples S1, S2, S3, S4, S5, S6, and S7 at room temperature (RT). | ||
3 Results and discussion
X-ray diffraction (XRD) analysis was conducted to determine the phases present in the prepared samples. Fig. 2 displays the XRD patterns of samples S1, S2, S3, S4, S5, S6, and S7. In the XRD spectrum of NiFe2O4, peaks at 2θ = 30.3°, 35.7°, 43.4°, 53.8°, 57.4°, and 63° are respectively indexed to the (220), (311), (400), (422), (511), and (440) crystal planes, indicating the cubic spinel structure of NiFe2O4.15 The sharpness of the XRD peaks suggests well-crystallized nanoparticles. Additionally, Bragg peaks at 2θ = 18.4°, 30.2°, 35.5°, 43.2°, 53.7°, 57.2°, 62.4°, and 74.3° correspond to (111), (220), (311), (400), (422), (511), (440), and (533) crystal planes assigned to Fe3O4. | ||
| Fig. 2 XRD patterns of the synthesized nanocomposites: (S1) NiFe2O4, (S2) NiFe2O4/Fe3O4, (S3) NiFe2O4/Fe3O4/PANI, (S4) NiFe2O4/Fe3O4/PANI/RGO, (S5) NiFe2O4/Fe3O4/PANI/MWCNT, (S6) NiFe2O4/Fe3O4/RGO/MWCNT, (S7) NiFe2O4/Fe3O4/PANI/RGO/MWCNT. | ||
In the XRD pattern of sample S2, several peaks are observed at consistent angles, indicating that the cubic spinel structure of NiFe2O4 remains unchanged by the addition of Fe3O4. In the XRD pattern of samples S4, S5, and S7 (inset of Fig. 2), a weak peak at approximately 2θ = 14.7°, 13.5°, 12° with low intensity corresponds to PANI.30,31 The reduced intensity of the PANI peaks in sample S3 is probably attributed to its lower concentration within the composites.32 The lack of a peak at 2θ = 26°, typically associated with graphite, suggests that the presence of NiFe2O4, Fe3O4, and PANI could potentially disrupt the layered structure of RGO. The robust bonding between these nanoparticles and RGO inhibits the rearrangement of RGO layers, resulting in the isolation of RGO layers.33,34 The MWCNT-related peak in the XRD pattern of sample S5 is likely obscured due to the low MWCNT content in the composite.35 In sample S6, new peaks are observed at specified Bragg angles, with one prominent peak at 26.6°. This peak may be attributed to both RGO and MWCNT, as they typically exhibit diffraction peaks around 26° on the (002) plane. The presence of PANI in the samples causes a reduction in the intensity of the original peaks, as PANI absorbs some of the incident X-ray radiation.36
The crystallite sizes of the ferrite nanoparticles, calculated using Scherer's eqn (1), are indicated beside each graph.
 | (1) |
Raman spectroscopy is a highly effective non-destructive technique used to characterize carbon materials and assess the degree of graphitization of carbon atoms in synthesized nanocomposites. The degree of crystallinity and presence of disorders/defects in carbon-based materials can be determined by analyzing the intensity ratio of the D-band to the G-band.37 To further elucidate the contributions of PANI, RGO, and MWCNT in the synthesized nanocomposites, Raman spectroscopy was employed using a 785 nm wavelength excitation laser. The Raman spectra of four prepared samples (S4, S5, S6, S7) are presented in Fig. 3.
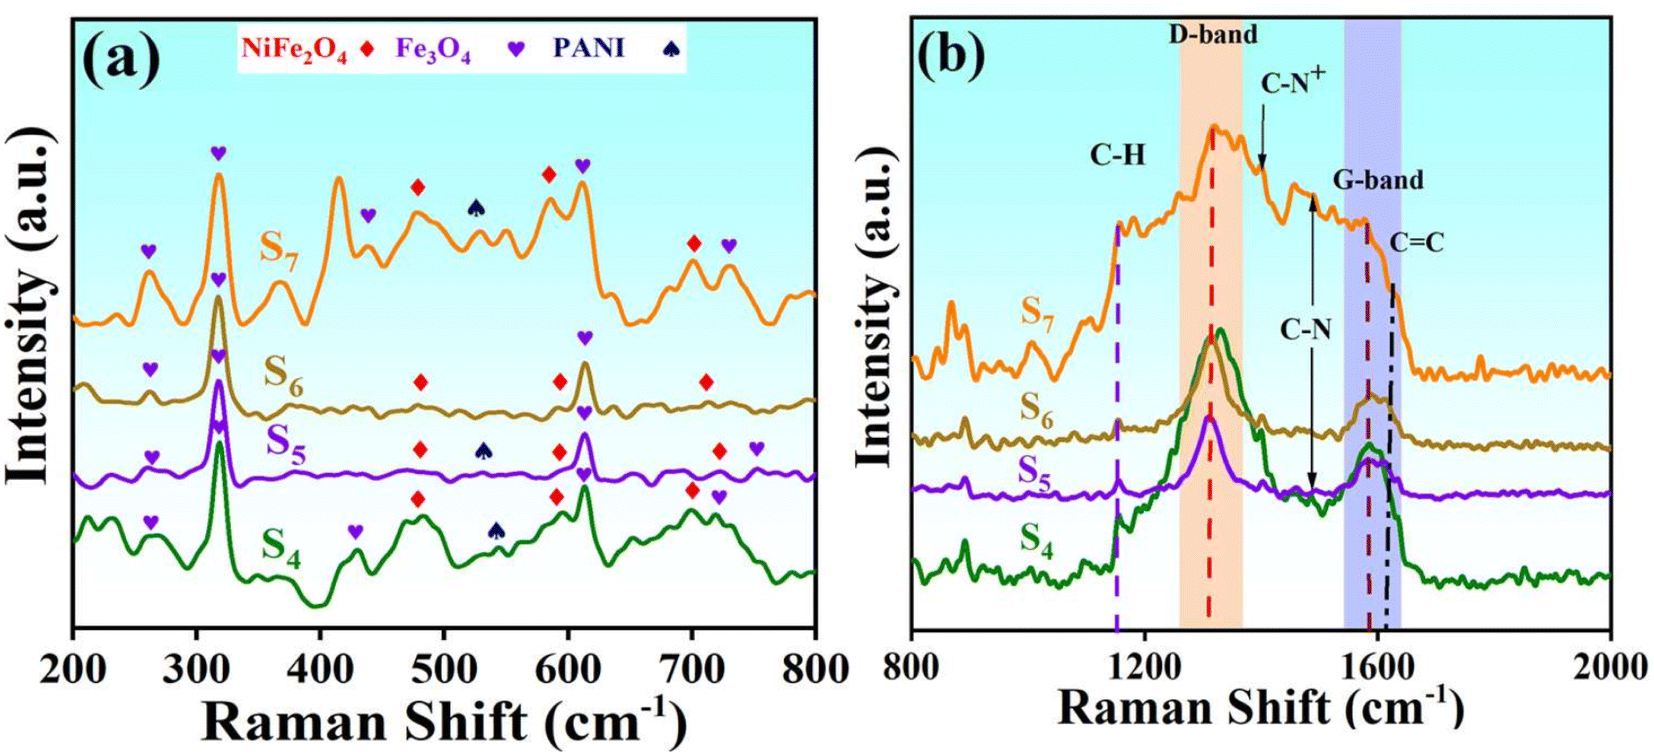 | ||
| Fig. 3 Raman spectrum obtained for S4, S5, S6, and S7 in different ranges from (a): (200–800 cm−1) and (b): (800–2000 cm−1). | ||
In Fig. 3b, D- and G-bands centered at 1330 and 1585 cm−1 for S4 show a red shift compared to free-standing RGO. The D-band arises from lattice defects in the carbon atoms, with higher defect concentrations correlating to increased D-band intensity. This band is linked to the vibrational modes of carbon atoms in the presence of structural defects that can perturb the sp2 hybridization network, resulting in enhanced phonon scattering.
On the other hand, the G-band primarily originates from the in-plane stretching vibration of carbon atoms in the sp2 hybridization of graphitic materials (degenerate in-plane E2g mode of sp2 rings and chains at the Γ point). The 2D band is associated with the second-order Raman mode (degenerate in-plane A1g breathing mode in rings at the K point).38,39 Raman spectroscopic analysis of pristine MWCNT in the 500 cm−1 to 1700 cm−1 range revealed the presence of the D-band (around 1300 cm−1), and the G-band (around 1600 cm−1).40 The observed Raman shifts for pure RGO are consistent with these values, with some polyaniline Raman peaks (e.g., around 1340 and 1585 cm−1) showing similarities to the peaks of RGO and MWCNT. The presence of vibration modes in PANI, RGO, and MWCNT within the S7 nanocomposite (orange curve) leads to peak broadening, indicating the formation of new covalent bonds.34 The integrated peaks, particularly around the D- and G-bands in S7, signify significant contributions from each component. The broadband peaks incorporate contributions from PANI, MWCNT, and RGO in a symmetrical manner, resulting in a complex structure in S7 that highlights the heterogeneity of the nanocomposite samples.41,42 The slight displacements of the D- and G-bands in the tested samples are attributed to their interactions with other components of the nanocomposites. The peak intensities provide insights into the concentration of cations in each sample.41 Additionally, there are broad, weak peaks around 2600–2700 cm−1 corresponding to the 2D band.
Additional PANI peaks are illustrated in Fig. 3a. The C–H bond, arising from the bending vibration of the quinoid/benzenoid ring, is observed at 1155 cm−1. Additionally, the C–N stretching vibration bond associated with the benzenoid ring is detected at 1489 cm−1 for S7, 1486 cm−1 for S4, and 1492 cm−1 for S5. Raman spectra of all nanocomposite samples exhibit peaks attributed to NiFe2O4 and Fe3O4 in the 200–800 cm−1 range, with slight displacements due to the varying composition of materials. The combined peaks are depicted in Fig. 3a and appear relatively weaker compared to the peaks related to the carbon-based materials in our nanocomposites. This disparity becomes apparent when materials are combined in a 1:1 mass ratio to create nanocomposites, as the volume of nickel ferrite is smaller than that of RGO and MWCNT. Consequently, detecting the presence of nickel ferrite within the overall nanocomposites using Raman spectroscopy can pose a challenge.38
Spinel ferrites typically exhibit 5 peaks in the 150–750 cm−1 range, representing A1g, Eg, and three T2g vibration modes. Some of these modes share similar characteristics between NiFe2O4 and Fe3O4.41 The ID/IG ratio is a key indicator of the level of graphitization in such materials. Enhancing the degree of graphitization is crucial for improving the electrical conductivity of the nanocomposites.37
Fourier transform infrared (FTIR) spectroscopy has been utilized to analyze the presence of various functional groups in nanocomposites and identify the types of bonds.14 The FTIR spectra for the S1, S2, S3, S4, S5, S6, and S7 samples in the wavenumber range of 3600–400 cm−1 are shown in Fig. 4. The peak observed at 3427 cm−1 is associated with the stretching vibration bond of the hydroxyl (O–H covalent bond), indicating the adsorption of water on the surface of the nanocomposites. The appearance of characteristic peaks at 596 cm−1, and 667 cm−1 correspond to metal–oxygen bonds Ni–O and Fe–O in all samples, suggesting the presence of an inverse spinel structure in the nanomagnetic composites and the uniform formation of NiFe2O4 nanoparticles within the composite. Peaks at 1251 cm−1 and 1119 cm−1 are attributed to the stretching vibrations in the secondary amine C–N bond and the N![[double bond, length as m-dash]](https://www.rsc.org/images/entities/char_e001.gif) QN ring in the polyaniline structure. The absorption band at 1602 cm−1 is assigned to the CC bonds, while the narrow band at 2920 cm−1 is determined by the stretching vibration of the C–H bond.
QN ring in the polyaniline structure. The absorption band at 1602 cm−1 is assigned to the CC bonds, while the narrow band at 2920 cm−1 is determined by the stretching vibration of the C–H bond.
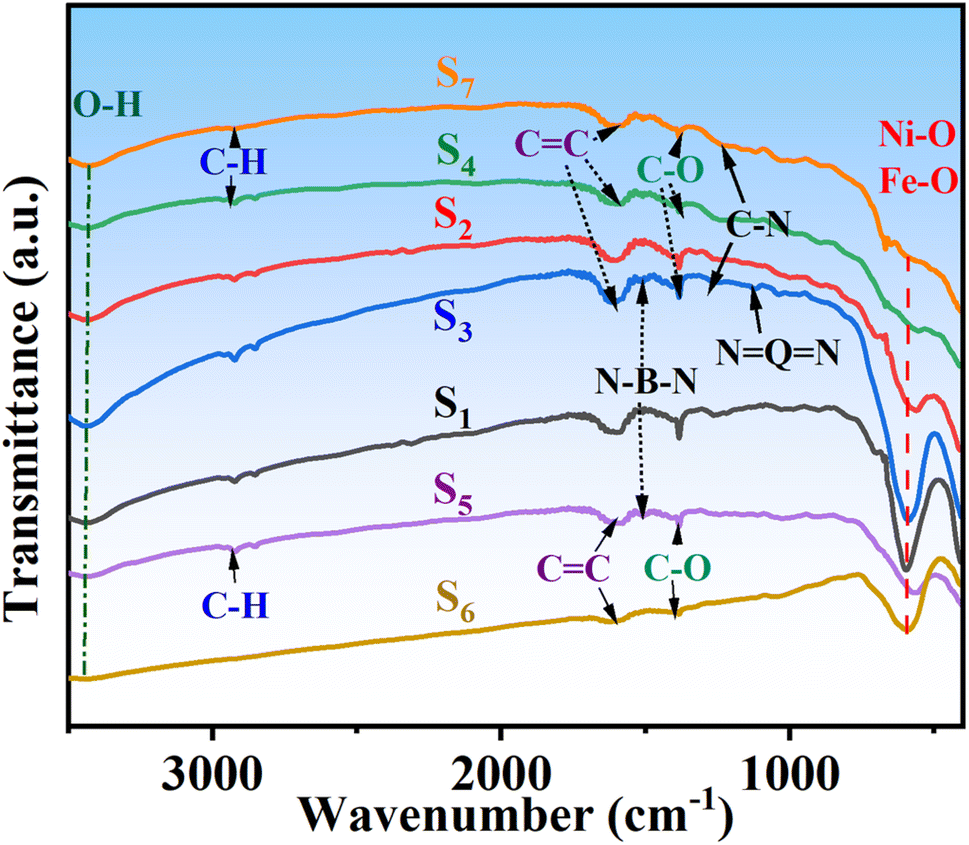 | ||
| Fig. 4 FTIR analysis of (S1) NiFe2O4, (S2) NiFe2O4/Fe3O4, (S3) NiFe2O4/Fe3O4/PANI, (S4) NiFe2O4/Fe3O4/PANI/RGO, (S5) NiFe2O4/Fe3O4/PANI/MWCNT, (S6) NiFe2O4/Fe3O4/MWCNT/RGO, (S7) NiFe2O4/Fe3O4/PANI/RGO/MWCNT samples. | ||
The morphology, particle size, and characterization analysis of the specimens were determined using SEM and TEM images, as depicted in Fig. 5 and 6. The SEM images are presented in Fig. 5a, and the corresponding EDS diagrams are shown in Fig. 5b. In Fig. 5 (S2(a)), it can be observed that nanomagnetic particles of S2 have agglomerated in certain areas due to their magnetic properties. The EDS analysis of this specimen reveals the presence of Fe, O, and Ni elements (Fig. 5 S2(b)). The PANI networks formed after the polymerization process are decorated on NiFe2O4 and Fe3O4 (Fig. 5 S3(a)),43 with the EDS diagram (Fig. 5 S3(a)) indicating the presence of N and C elements in addition to the previously mentioned elements in the nanocomposite structure. In Fig. 5 (S4(a)), nanoparticles including ferrite nickel, the magnetic materials, and PANI are distributed nearly uniformly on the surface of the RGO sheet. Fig. 5 (S5(a)) shows abundant nanoparticles are observed that adhere to the surface of carbon nanotubes. The EDS diagrams confirm the constituent elements of the nanocomposites. Fig. 5 (S6(a,b)) illustrates the SEM and EDS of S6—the absence of PANI, and the lack of nitrogen elements in the EDS analysis. Fig. 5 (S7(a)) shows nanoparticles of NiFe2O4, Fe3O4, PANI, and MWCNTs situated on the surface of RGO sheets. The EDS analysis reveals the presence of Ni, O, Fe, C, and N elements in the composition.
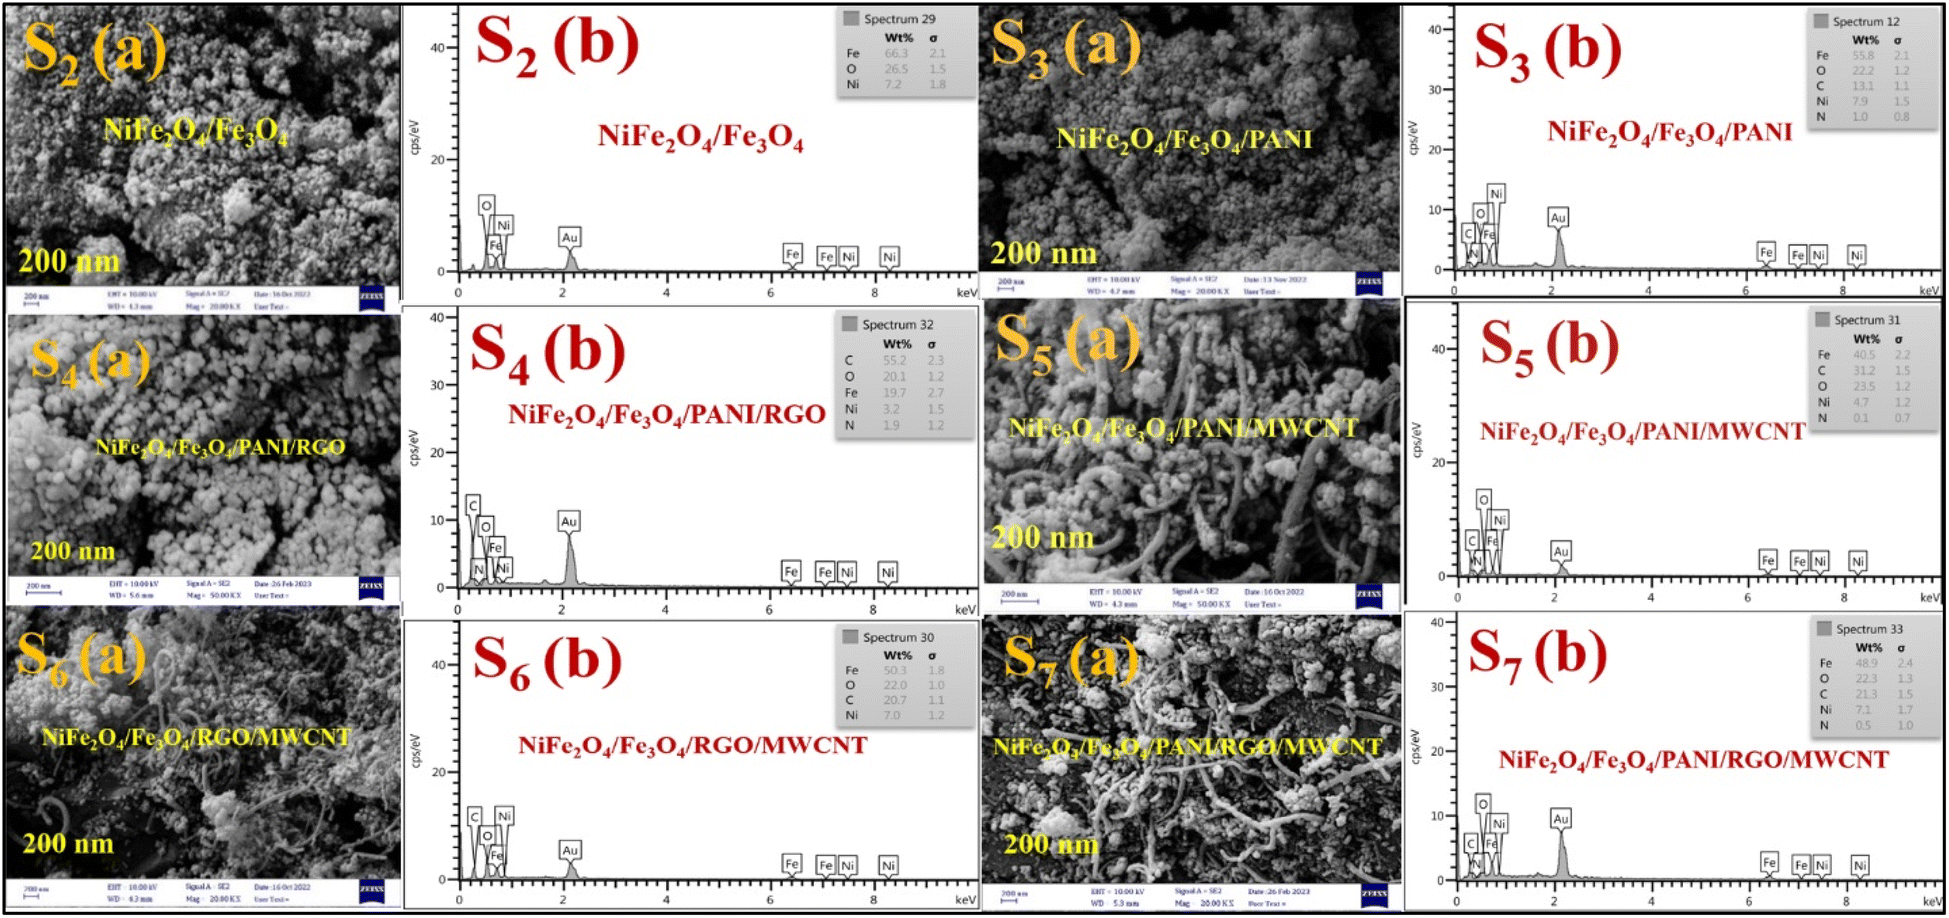 | ||
| Fig. 5 SEM images and EDS analysis of S1(a,b), S2(a,b), S3(a,b), S4(a,b), S5(a,b), S6(a,b), S7(a,b). NiFe2O4/Fe3O4 (S2), NiFe2O4/Fe3O4/PANI (S), NiFe2O4/Fe3O4/PANI/RGO (S4), NiFe2O4/Fe3O4/PANI/MWCNT (S5), NiFe2O4/Fe3O4/MWCNT/RGO (S6), NiFe2O4/Fe3O4/PANI/RGO/MWCNT (S7) samples. | ||
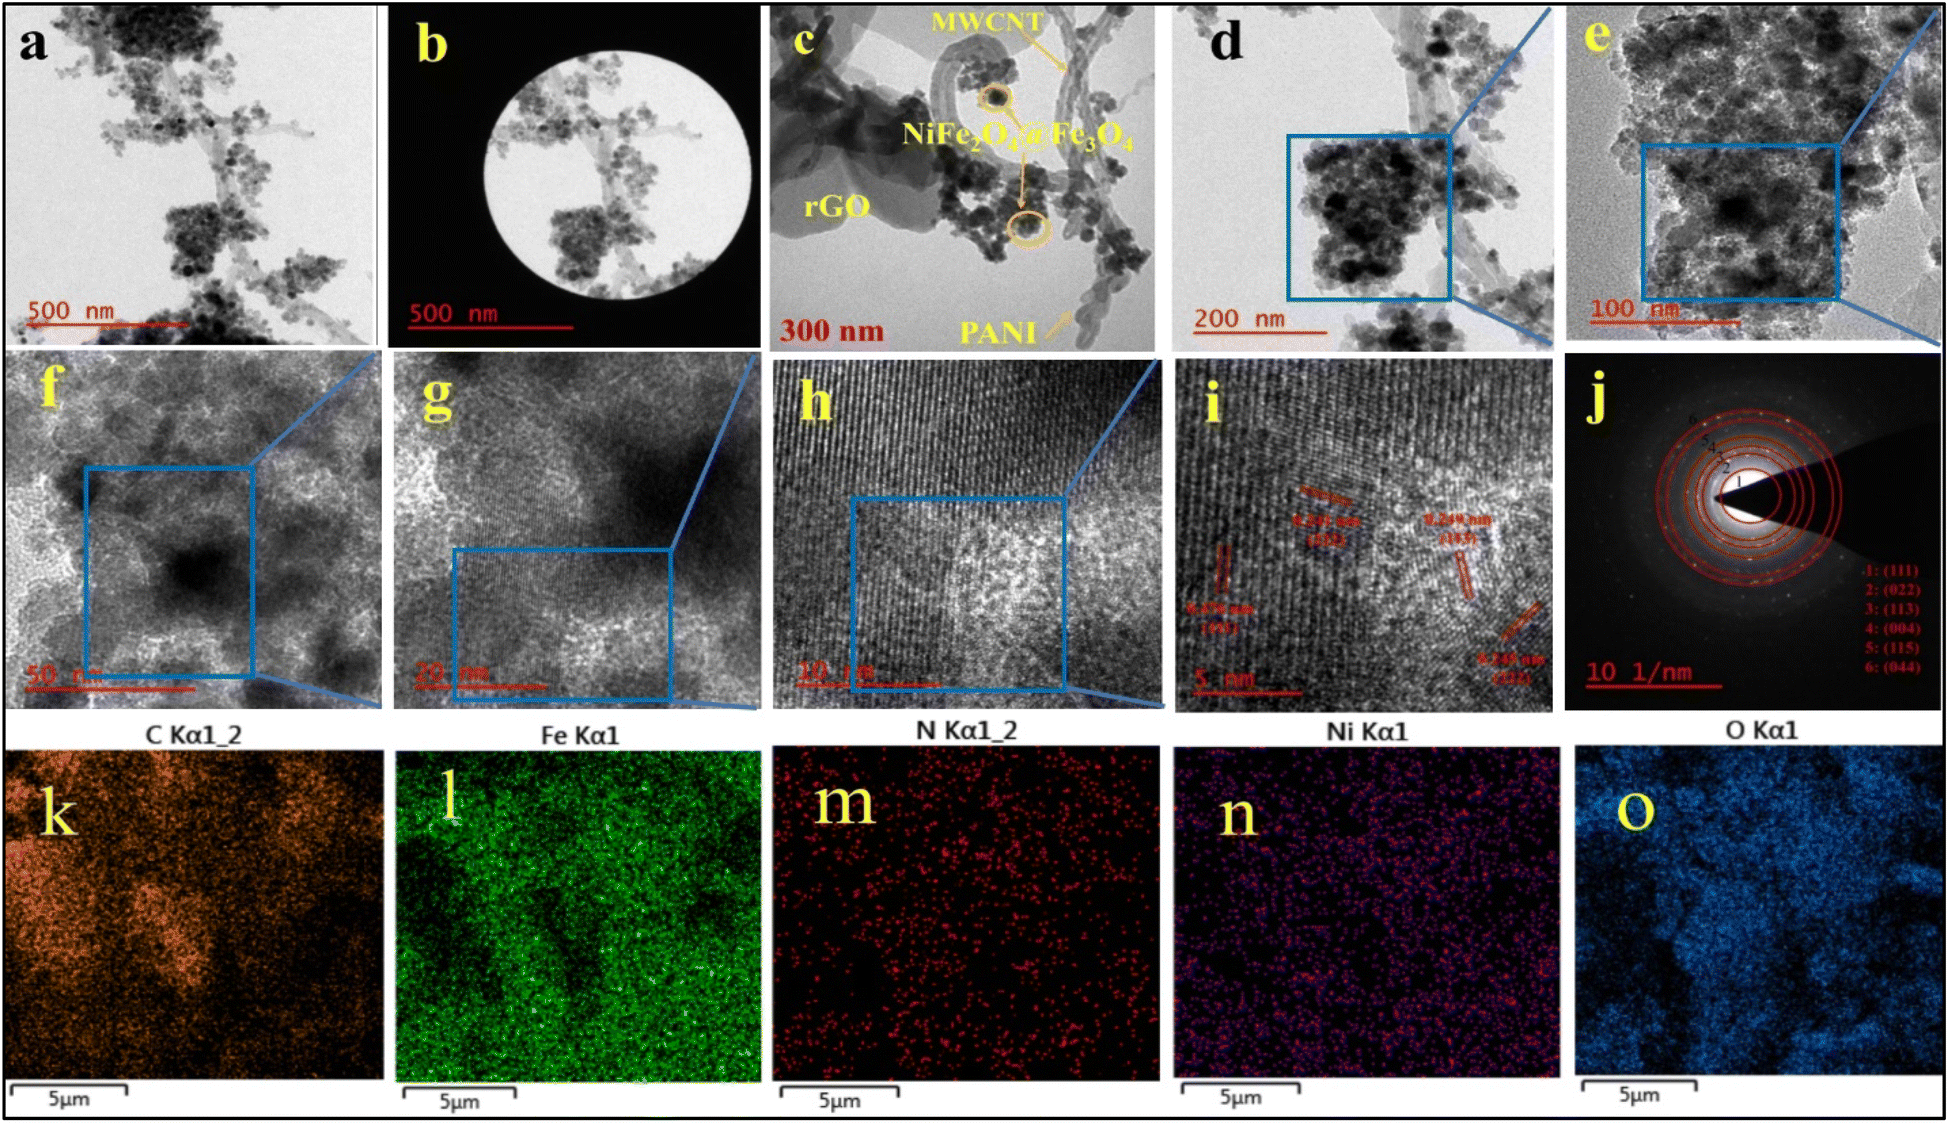 | ||
| Fig. 6 TEM images of S7 (NiFe2O4/Fe3O4/PANI/RGO/MWCNT) in different scales: (a and b) 500 nm, (c) 300 nm, (d) 200 nm, (e) 100 nm, (f) 50 nm, (g) 20 nm, (h) 10 nm, (i) 5 nm, (j) SAED and (k–o) EDS elemental mapping. | ||
Fig. 6a–j displays the TEM images of the S7 sample, revealing the heterogeneous structure of the specimen. The series of images from (a) to (i) in Fig. 6 are sequentially magnified. In Fig. 6c and d, spherical core–shells of NiFe2O4@Fe3O4 are evident. The dark regions represent the cores of NiFe2O4 particles with high electron density, while the lighter areas surrounding the cores correspond to the Fe3O4 shells. This contrast arises from variations in electron dispersion during transmission electron microscopy imaging. In Fig. 6d, it can be observed that the large surface area of RGO facilitates the uniform distribution of nanoparticles, which are to the OH groups of RGO and the OH groups of NiFe2O4 particles.26 As shown in Fig. 6c and e congress-like polymer chains of PANI are observed alongside some edges of nanotubes and around certain particle ferrites. This phenomenon is a result of the interaction between the oxygen atoms of ferrite and PANI. One of the primary reasons for incorporating PANI into nanocomposites is to prevent the aggregation of nanoparticles and facilitate their dispersion more effectively.31 PANI serves as a protective layer around NiFe2O4/Fe3O4 particles. The average width of PANI nanospheres, which sometimes exhibit a rice grain shape, ranges from 42 to 129 nm. The median size of the NiFe2O4/Fe3O4 composite falls between 17.8 and 37.9 nm, aligning with the sizes calculated using the Debye–Scherer equation. The TEM images validate the findings from the SEM images, confirming the successful synthesis of the samples. In Fig. 6k–o, the element mapping analysis of S7 demonstrates a uniform distribution of C, Fe, N, Ni, and O elements, indicating the successful synthesis of S7. In HRTEM image (i), lattice spacing values of 0.476, 0.245, 0.241, and 0.249 correspond to (111), (222), (222), and (113) planes, respectively, matching the d-spacing values obtained from XRD analysis of NiFe2O4 and Fe3O4. These values are further corroborated by the d-spacing values derived from the SAED analysis.
3.1 Magnetic properties by VSM analysis
The magnetic characteristics of the nanocomposites were measured using a vibration sample magnetometer (VSM) device. As depicted in Fig. 7, the hysteresis diagram of the samples changes with the applied magnetic field in the range of −14 to 14 kOe. The inset of Fig. 7 highlights the presence of very low hysteresis, indicating superparamagnetic behavior in the nanocomposites. The saturation magnetization of S1, S2, S3, S4, S5, S6, and S7 are 35.18, 66.92, 21.83, 27.55, 26.31, 15.40, and 27.29 (emu g−1) respectively, at a maximum magnetic field of 14 kOe.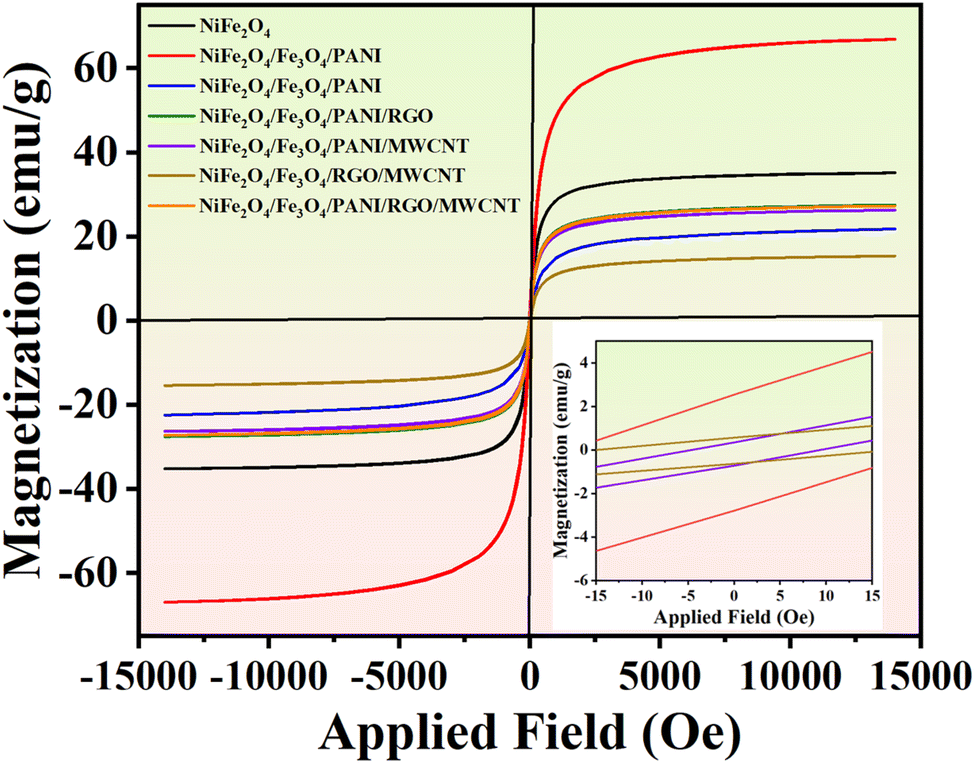 | ||
| Fig. 7 VSM analysis of synthesized nanocomposites: (S1) NiFe2O4, (S2) NiFe2O4/Fe3O4, (S3) NiFe2O4/Fe3O4/PANI, (S4) NiFe2O4/Fe3O4/PANI/RGO, (S5) NiFe2O4/Fe3O4/PANI/MWCNT, (S6) NiFe2O4/Fe3O4/RGO/MWCNT, (S7) NiFe2O4/Fe3O4/PANI/RGO/MWCNT. | ||
The addition of Fe3O4 to Ni ferrite enhances saturation magnetization, while PANI decreases the magnetic property of S3.17 Typically, the introduction of RGO results in a decrease in the saturation magnetization of the nanocomposites, although there exists an optimal value for this effect. Additionally, a specific amount of RGO can actually enhance magnetization to some extent.44 The presence of MWCNT contributes to a decrease in the saturation magnetization (Ms) of S5. In fact, both RGO and MWCNT contribute almost equally to the reduction in Ms.45 The total quantity of RGO and MWCNT utilized in S7 is equivalent to the amount of RGO in S4 or the amount of MWCNT in S5, leading to similar magnetization properties for these nanocomposites.
3.2 Microwave absorption analysis
To better understand the absorption mechanism of microwaves, the electromagnetic parameters were measured using a vector network analyzer.17 The complex permittivity (εr = ε′ − jε′′) and complex permeability (μr = μ′ − jμ′′) of the prepared nanocomposite demonstrate strong frequency-dependent properties. The real parts show the storage of electric and magnetic energy, while the imaginary parts indicate the dissipation capacity of electromagnetic energy.46 Generally, the dielectric constant is mainly influenced by the material's conductivity. As shown in Fig. 8a, the ε′ of all nanocomposite samples tends to decrease, with samples without MWCNT showing a smaller reduction with frequency. This decrease is attributed to the frequency dispersion effect, where dipole directions align with the low-frequency electric field but cannot keep up with fluctuations in the high-frequency fields, leading to charge accumulation. Samples with MWCNT exhibit higher real permittivity, indicating their high storage electric capacity.45 The presence of RGO in combination with MWCNT in S6, leads to interfacial polarization between RGO and other components, causing charge accumulation within the interfaces.47 In the case of S7, PANI balances the magnetic and electric components with varying magnetic and dielectric properties, resulting in the low ε′ of S7.17 The addition of RGO to S4 resulted in an increased electric storage energy compared to the other samples, with the exception of those containing MWCNT. The high ε′ of the S5 and S7 not only results in high conductivity but also provides good impedance matching.48 Due to the presence of PANI coating as a conductive polymer, RGO sheets, and MWCNT, the dielectric loss ε′′ decreases with increasing frequency.49 The dielectric loss of S6 is higher than other samples up to 9.3 GHz (Fig. 8b), then gradually decreases with two resonance peaks, indicating the presence of multi-polarization relaxation involving dipole and interfacial polarizations.50 The dipole polarizations originate from defects in RGO sheets, MWCNT, and PANI, as well as functional groups such as oxygenated chemical bonds (CO and C–O bonds) connected to PANI and RGO. The diverse electron capabilities of carbon and oxygen atoms cause electron movements that generate polarization under periodic electromagnetic fields.28 Other polarization mechanisms arise from heterogeneous junctions, leading to interface polarization. The compositions of different magnetic and electric materials (NiFe2O4, Fe3O4, PANI, RGO, MWCNT) create a heterojunction structure that enhances the interfacial area by providing active chemical sites to connect functional groups in RGO and MWCNT.50 According to free-space theory, higher ε′′ indicates greater conductivity in samples containing MWCNT.51 In S6, a minor peak at 8.3 GHz is detected, attributed to significant polarization loss between MWCNT-RGO and the magnetic components, as well as between Fe, Ni, and the PANI coating.49
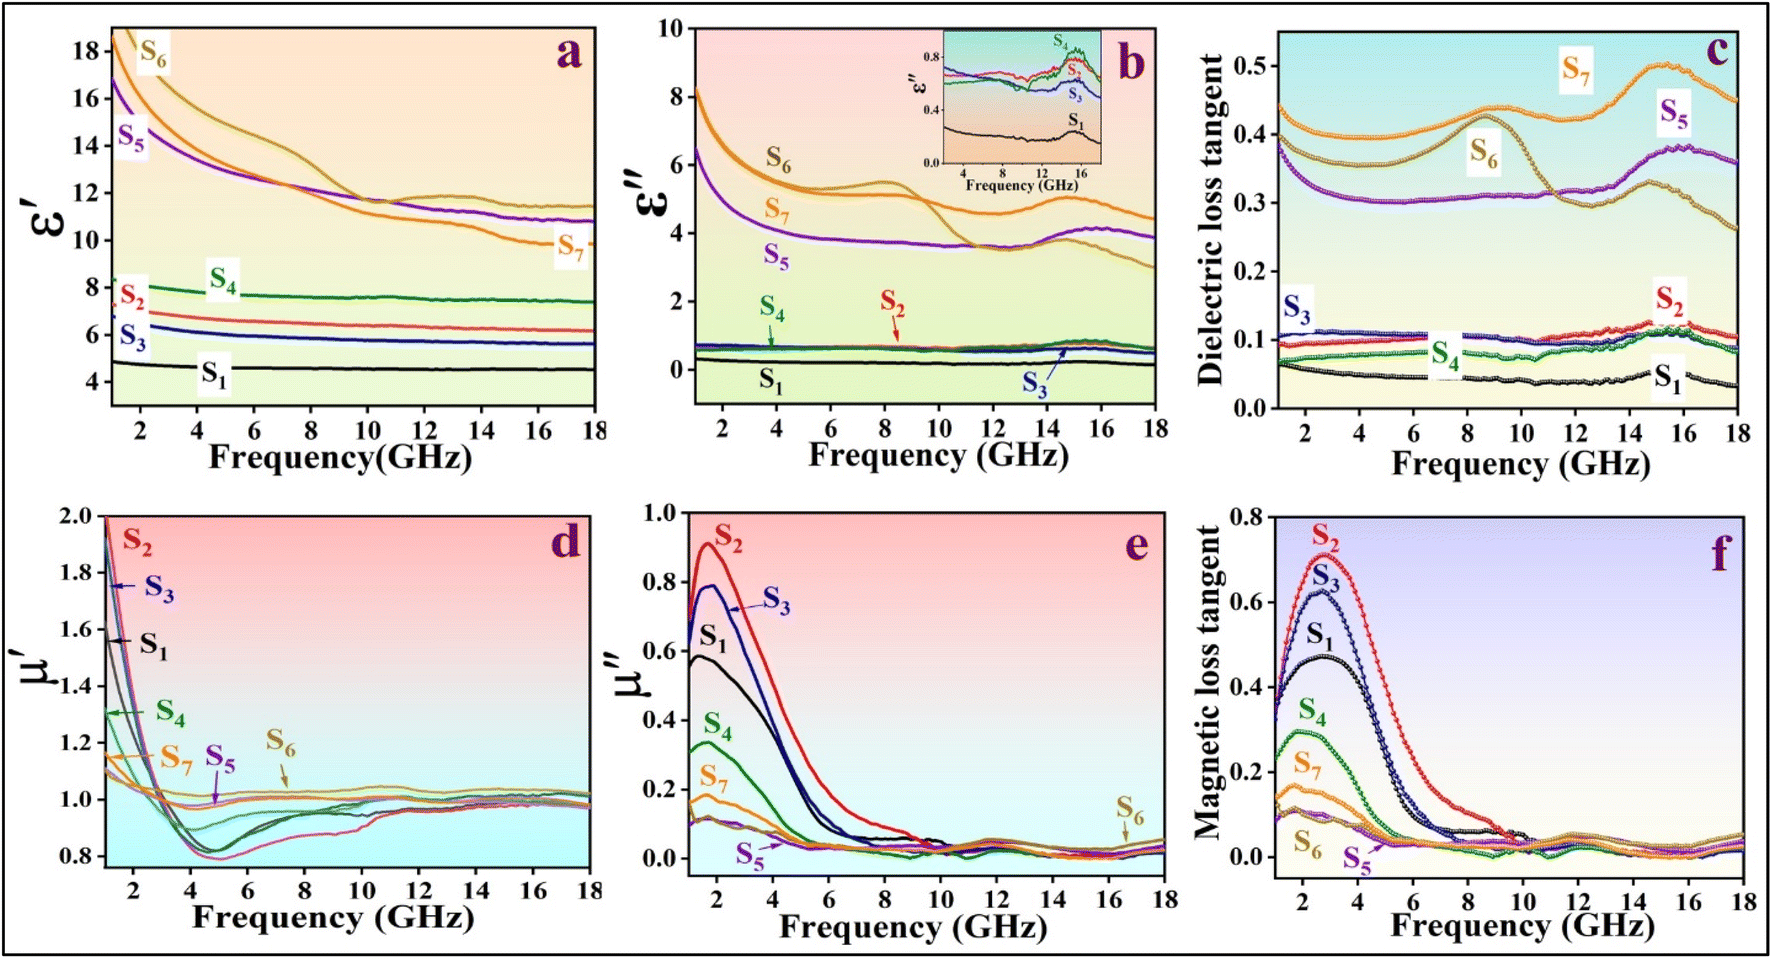 | ||
| Fig. 8 (a and b) Real part (ε′), and imaginary part (ε′′) of complex permittivity, (c) dielectric loss tangent, (d and e) real part (μ′) and imaginary part (μ′′) of complex permeability, (f) magnetic loss tangent, respectively for: (S1) NiFe2O4, (S2) NiFe2O4/Fe3O4, (S3) NiFe2O4/Fe3O4/PANI, (S4) NiFe2O4/Fe3O4/PANI/RGO, (S5) NiFe2O4/Fe3O4/PANI/MWCNT, (S6) NiFe2O4/Fe3O4/RGO/MWCNT, (S7) NiFe2O4/Fe3O4/PANI/RGO/MWCNT. | ||
As depicted in Fig. 8d and e, the real part (μ′) and imaginary part (μ′′) of all samples exhibit a similar decreasing trend. The formation of magnetic dipoles in nanocomposites is influenced by μ′, particularly materials with unpaired electrons. The combination of Fe3O4 with nickel ferrite enhances the magnetic storage capacity.52 Initially, the NiFe2O4/Fe3O4 composite shows the highest μ′ value at the lower end of the frequency range. Subsequently, the introduction of nonmagnetic materials leads to a decrease in μ′. Samples containing MWCNT exhibit a slower decreasing trend in μ′ with frequency compared to other samples. As depicted in (Fig. 8e), with an increase in the amount of magnetic ingredients, there is a higher magnetic loss observed, making NiFe2O4/Fe3O4 exhibit the greatest magnetic loss up to 10 GHz.
Superparamagnetic materials have electrons with unpaired spins that respond to periodic magnetic fields. At frequencies between 2–10 GHz, magnetic moments rotate more slowly compared to 10–18 GHz frequencies. The presence of more magnetic ingredients in a sample, results in more magnetic moments, facilitating relaxation at low-frequency ranges. In high frequencies, numerous moments may not be able to follow the EM field fluctuations. The addition of nonmagnetic materials, such as MWCNT, reduces the number of magnetic moments and makes spin rotation relaxation easier, and consequently, the magnetic loss tangent (μ′′) can contribute to maintaining a low and consistent magnetic loss tangent within the 10–18 GHz frequency range.
Negative values in the magnetic loss of S4 may occur in response to a periodic EM field. When a conductive composite is exposed to an external periodic magnetic field, an internal electrical field is generated, affecting the movement of charges within the nanocomposite and leading to induced magnetic fields. If the internal magnetic field surpasses the external magnetic field, μ′′ can exhibit negative values.53 In the frequency range of 2–10 GHz, the magnetic loss of samples containing nonmagnetic materials decreases, indicating natural resonance. However, in 10–18 GHz frequencies, the dominant loss mechanism is eddy currents with a minimal contribution from exchange resonance (Fig. 8e and f). There are additional magnetic loss mechanisms, such as domain wall resonance, that typically occur at lower frequencies (<100 MHz), which were not investigated in this study.
The high conductivity of MWCNT contributes to samples containing MWCNT having a higher dielectric loss tangent compared to other samples, while their magnetic loss tangent is lower. The dielectric loss tangent of S7 is the highest due to its three conductive components.
As depicted in Fig. 8c, the dielectric loss tangent curves of all specimens with MWCNT are higher compared to others, strengthening the dielectric loss capacity. The multi-component structure of S7 leads to the highest value of tanδε, primarily due to the interfacial polarization mechanism. However, some other important factors affected the MA and they will be discussed.
In Fig. 8f, the magnetic loss tangent of all samples tends to decrease with increasing frequency. The magnetic loss tangent of NiFe2O4/Fe3O4 (S2) surpasses the others up to 9.1 GHz, demonstrating significant magnetic loss capabilities. A distinct peak associated with natural resonance is observed at lower frequencies.
The magnetic loss tangent remains stable between 10 GHz and 18 GHz across all samples. In samples containing PANI, like S4, occasional negative values are observed at certain frequencies, possibly stemming from negative magnetic loss (μ′′) values at those specific frequencies.54 Furthermore, in the 10–18 GHz range, the dielectric loss tangent is notably higher than the magnetic loss tangent, particularly in samples containing MWCNT. This suggests a predominant dielectric loss mechanism within the specimens.54
Electromagnetic protective materials need to possess specific attributes, including lightweight, thinness, and a broad absorption bandwidth.55 The reflection loss (RL) can assess these properties and is calculated using the transmission line theory (eqn (2)):
 | (2) |
The RL can be calculated from εr and μr quantities. The input impedance is defined by eqn (3):56
 | (3) |
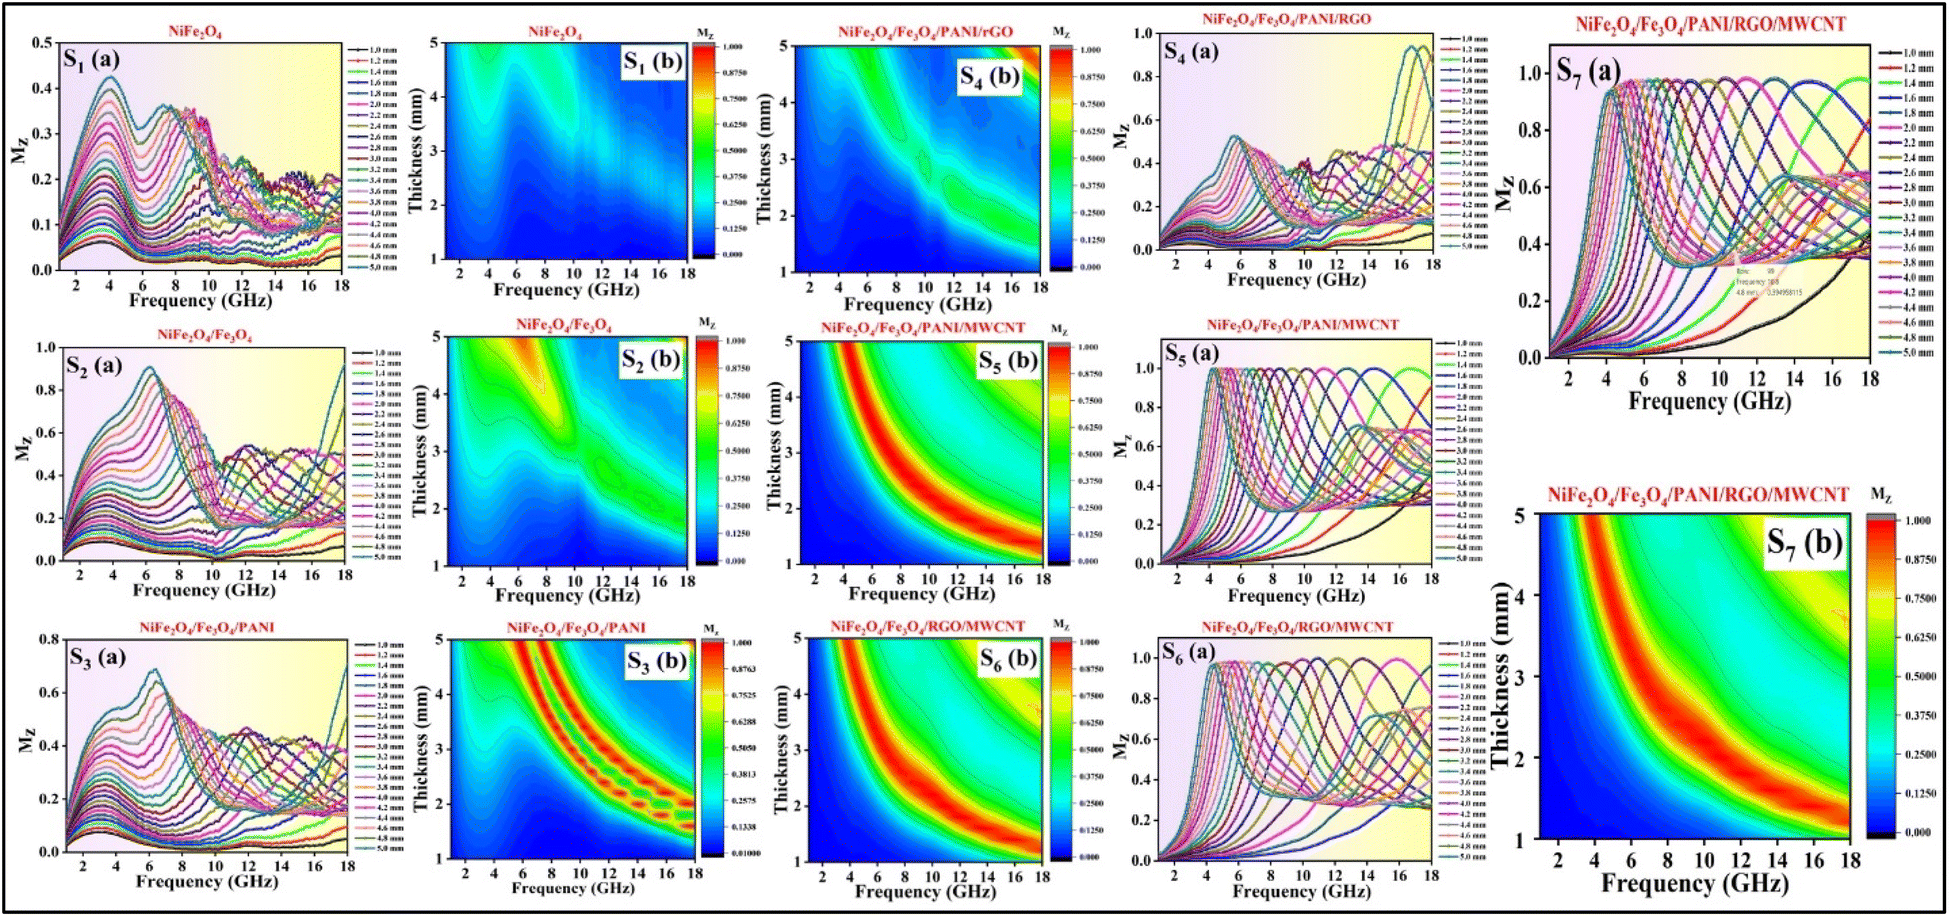
Fig. 9 depicts the planar diagrams, 3D RL, 2D RL, and the contour map at different thicknesses for all the prepared nanocomposites. The 3D RL diagrams vary based on the material thickness (ranging from 1.0 to 5.0 mm) and microwave frequency (2–18 GHz), aligning with the 2D RL diagrams. The intensities of RL are indicated by varying colors in both the 3D and contour RL diagrams.
 | ||
| Fig. 9 (a) 2D, (b) 3D reflection loss diagrams and (c) contour diagram of thickness versus frequency for (S1) NiFe2O4, (S2) NiFe2O4/Fe3O4, (S3) NiFe2O4/Fe3O4/PANI, (S4) NiFe2O4/Fe3O4/PANI/RGO, (S5) NiFe2O4/Fe3O4/PANI/MWCNT, (S6) NiFe2O4/Fe3O4/RGO/MWCNT, and (S7) NiFe2O4/Fe3O4/PANI/RGO/MWCNT. | ||
The effective absorption bandwidth (EAB) is a crucial parameter for the microwave absorption of the specimens. It signifies the frequency range where the RL values are below −10 dB.57 This implies that if RL < −10 dB, the sample will absorb over 90% of the incident EM waves.58 In Fig. 9 S1(a–c), despite having moderate magnetic loss, the RL values of the NiFe2O4 sample indicate poor MA performance, with RLmin values exceeding −10 dB within 2–18 GHz. Therefore, this sample should be combined with other materials. Magnetite can significantly enhance the absorption properties of the nanocomposites due to its high magnetic properties. In Fig. 9 S2(a–c), S2 exhibits RLmin = −13.8 dB at 18 GHz, with an EAB of 1.3 GHz at d = 5 mm. Fig. 9 S4(a–c) illustrates S4 with RLmin = −15.2 dB at 17.4 GHz (d = 4.8 mm). The RGO sheets somewhat enhance the conductivity characteristics of the previous sample, with an EAB of 1.4 GHz. S5 exhibits the highest RLmin value of −47.5 dB at 4.6 GHz (d = 4.6 mm) among all samples, with an EAB of 4 GHz at d = 1.6 mm (Fig. 9 S5(a–c)). The introduction of MWCNT to the composite has led to an improvement in MA performance.
Analysis from Fig. 9 S6(a–c) shows that S6 not only demonstrates good EAB and microwave absorption compared to previous samples but also achieves an RLmin of −38.7 dB at 10.9 GHz for a thickness of 2 mm, with the EAB remaining at 4 GHz within the range of 14–18 GHz. The broadest EAB among all samples belongs to S7, which is 4.8 GHz at d = 1.6 mm. RLmin is −20.7 dB at 11.4 GHz (d = 2 mm) for S7. It is worth noting that for samples S5, S6, and S7, nearly all RLmin values for various thicknesses are below −10 dB, demonstrating the strong microwave absorption capabilities of the samples. In S7, the synergic effects of RGO, MWCNT, and PANI in producing an extended conductive network have led to this phenomenon and expanded the EAB to 4.8 GHz, the widest EAB among all samples. The thickness of the absorbent material greatly influences the MA performance. The last two samples (S6 and S7) exhibit fantastic MA properties at thin thickness (d = 2 mm) (Fig. 10).
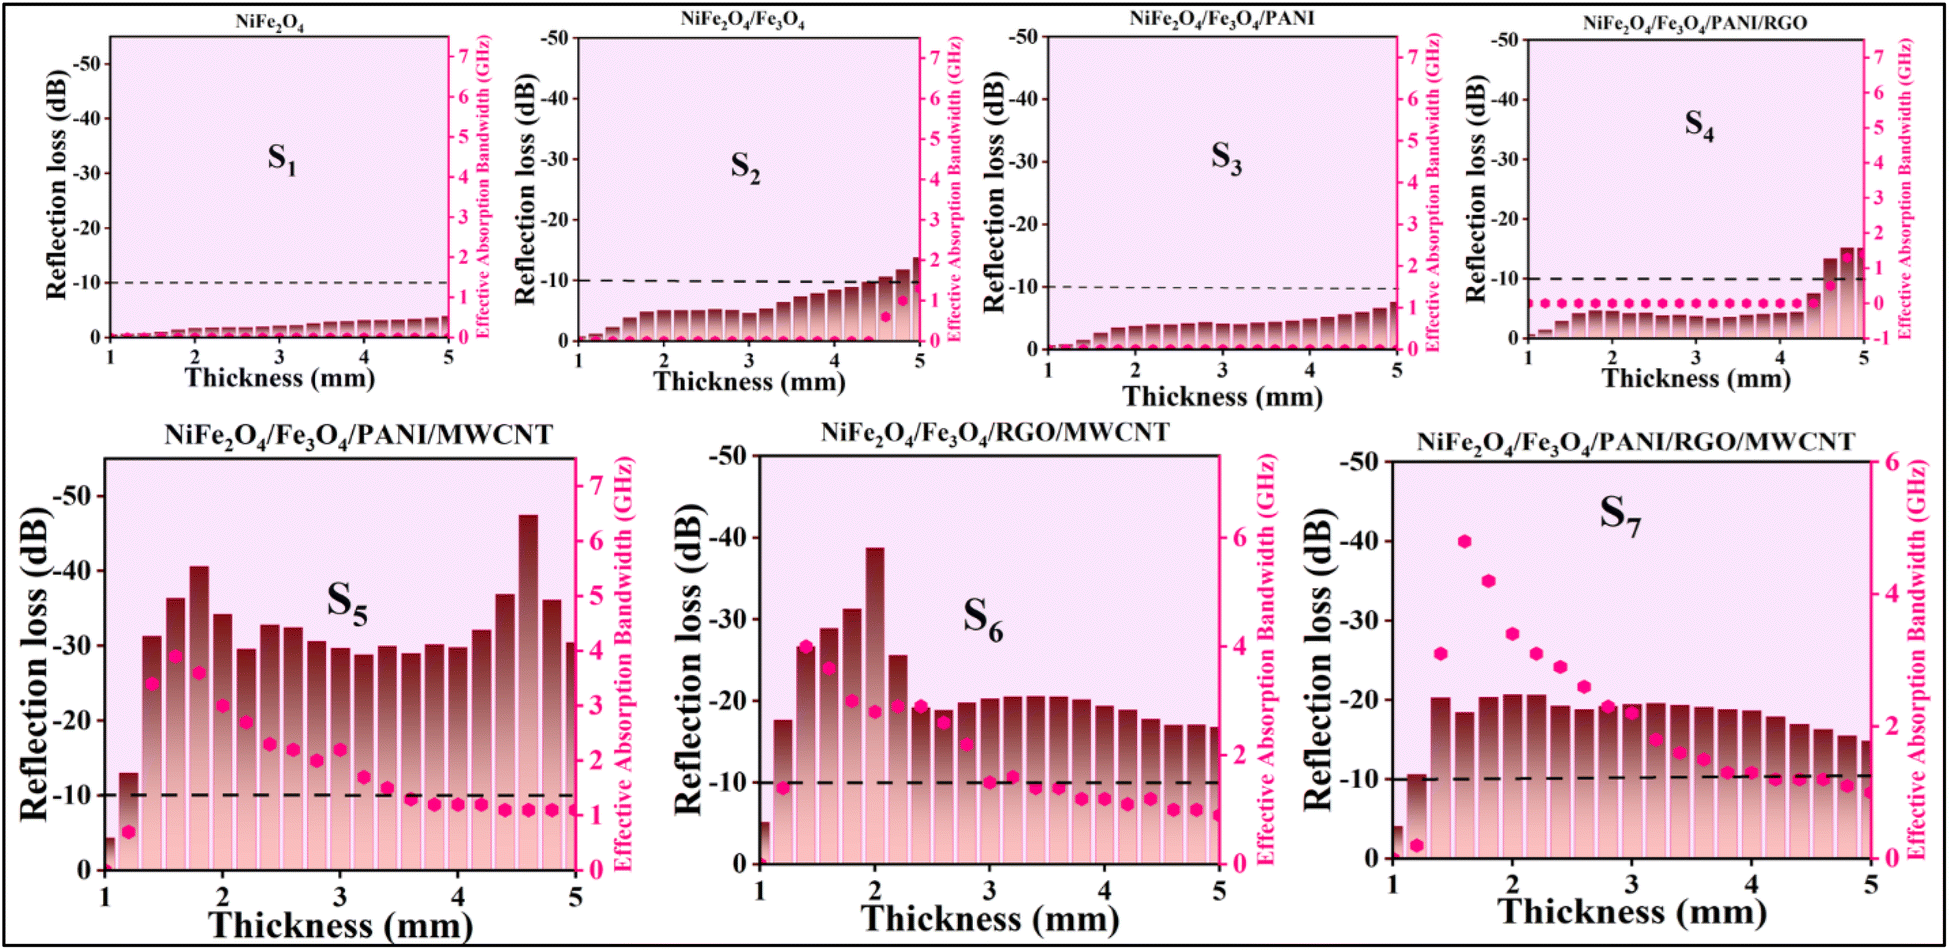 | ||
| Fig. 10 RL and EAB versus thickness for (S1) NiFe2O4, (S2) NiFe2O4/Fe3O4, (S3) NiFe2O4/Fe3O4/PANI, (S4) NiFe2O4/Fe3O4/PANI/RGO, (S5) NiFe2O4/Fe3O4/PANI/MWCNT, (S6) NiFe2O4/Fe3O4/RGO/MWCNT, (S7) NiFe2O4/Fe3O4/PANI/RGO/MWCNT. | ||
Table 1 displays the RLmin, absorber thickness, EAB, coercive field (Hc), remanence magnetization (Mr), and saturation magnetization (Ms) of all the prepared samples.
| Sample | RLmin (dB) | f (GHz) | t m (mm) | EAB (GHz) | |Hc| (Oe) | M r (emu g−1) | M s (emu g−1) |
|---|---|---|---|---|---|---|---|
| NiFe2O4 (S1) | −3.9 | 4.1 | 5 | 0 | 23.4 | 2.5 | 35.18 |
| NiFe2O4/Fe3O4 (S2) | −13.8 | 18 | 5 | 1.3 | 17.9 | 2.6 | 66.92 |
| NiFe2O4/Fe3O4/PANI (S3) | −7.6 | 18 | 5 | 0 | 7.8 | 0.36 | 21.8 |
| NiFe2O4/Fe3O4/PANI/RGO (S4) | −15.2 | 17.4 | 4.8 | 1.4 | 3.8 | 0.31 | 27.55 |
| NiFe2O4/Fe3O4/PANI/MWCNT (S5) | −47.5 | 4.6 | 4.6 | 4 | 4.7 | 0.35 | 26.31 |
| NiFe2O4/Fe3O4/RGO/MWCNT (S6) | −38.7 | 10.9 | 2 | 4 | 14.6 | 0.57 | 15.40 |
| NiFe2O4/Fe3O4/PANI/RGO/MWCNT (S7) | −20.7 | 11.4 | 2 | 4.8 | 7.4 | 0.58 | 27.29 |
In Fig. 11a and b, the 3D and 2D reflection loss versus frequency is depicted. Fig. 11c illustrates a radar chart for S2, S4, S5, S6, and S7, showing their thickness, filler content, and EAB. Additionally, Fig. 11d displays the EAB for S2, S4, S5, S6, and S7.
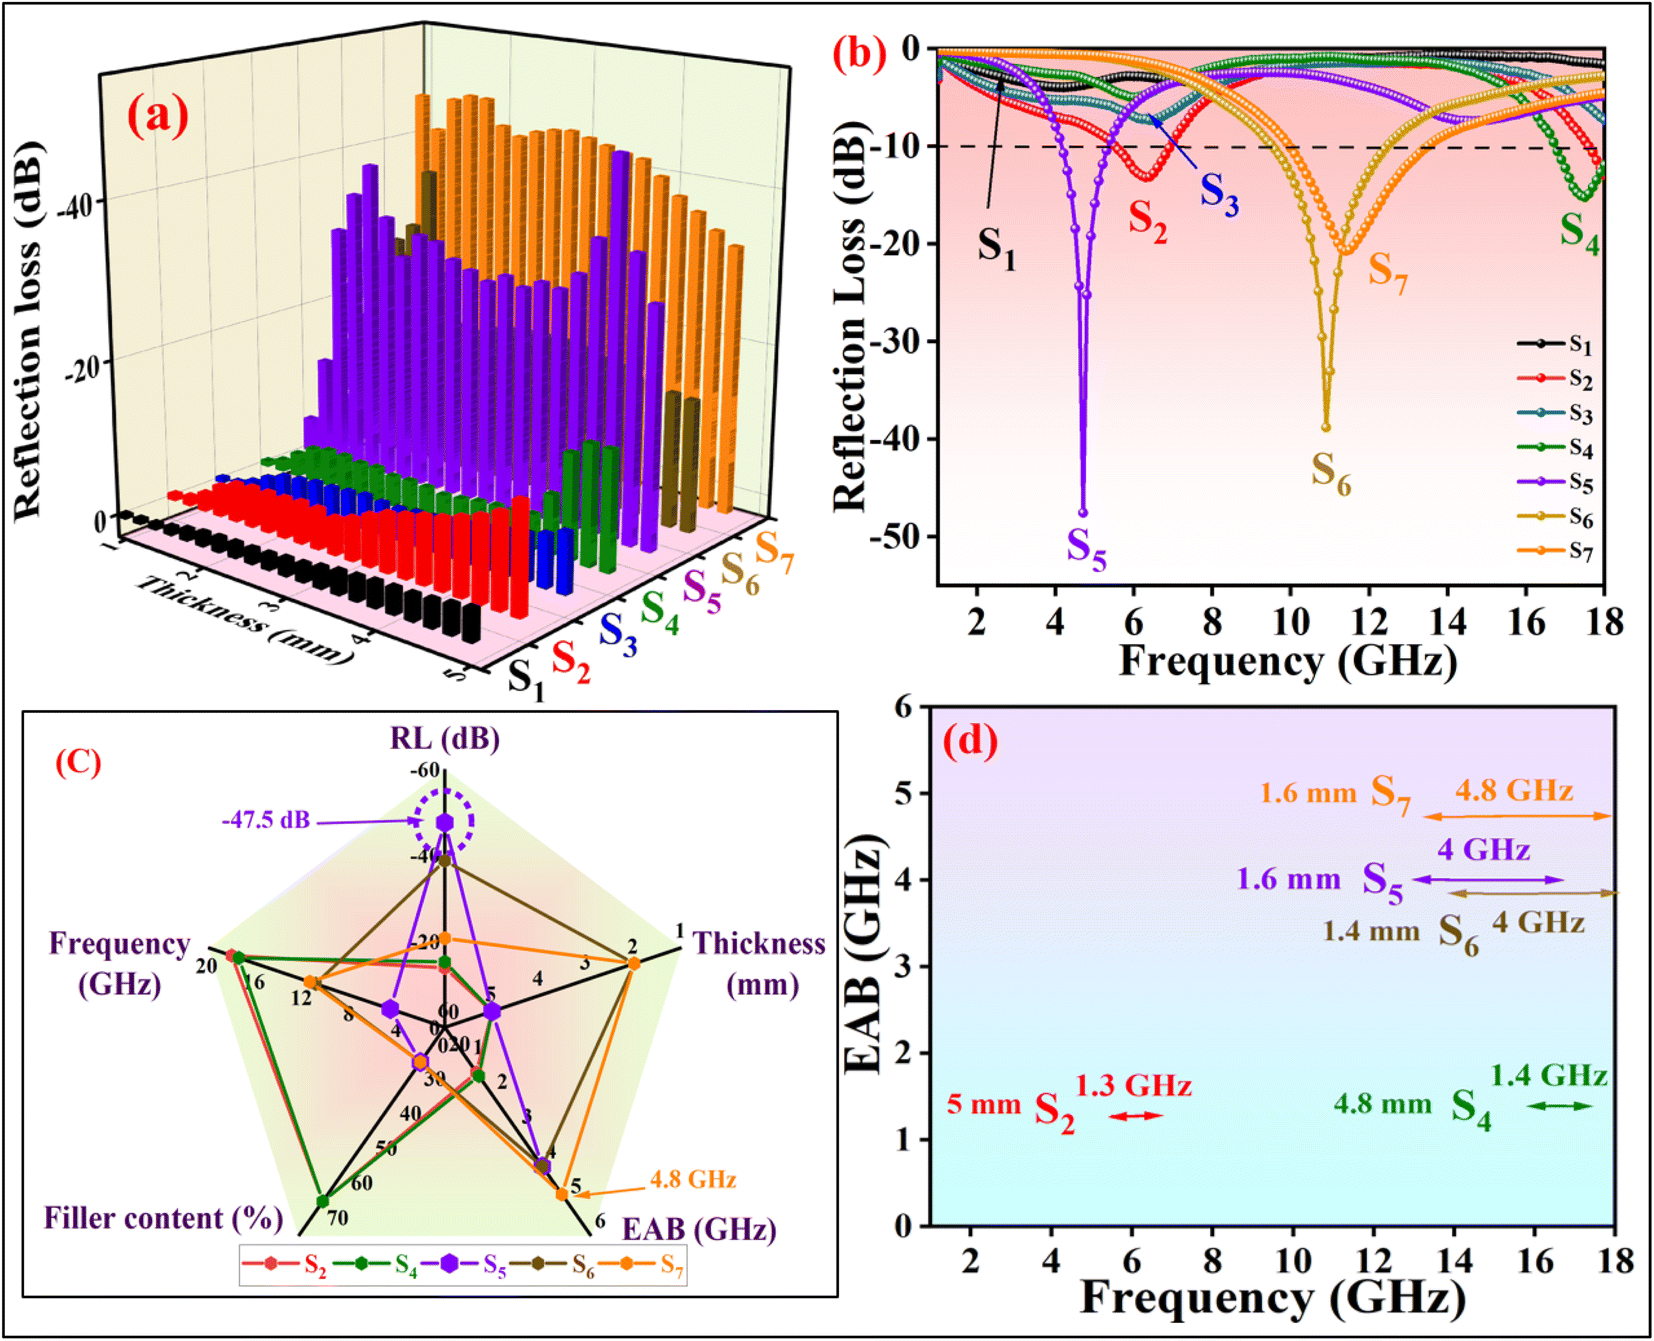 | ||
| Fig. 11 (a) Reflection loss of all samples, (b) the best RLmin, (c) radar chart, (d) EAB for: (S1) NiFe2O4, (S2) NiFe2O4/Fe3O4, (S3) NiFe2O4/Fe3O4/PANI, (S4) NiFe2O4/Fe3O4/PANI/RGO, (S5) NiFe2O4/Fe3O4/PANI/MWCNT, (S6) NiFe2O4/Fe3O4/RGO/MWCNT, (S7) NiFe2O4/Fe3O4/PANI/RGO/MWCNT. | ||
Fig. 12 compares the absorption parameters of our work with some related studies, including RLmin, EAB, and absorption thickness.
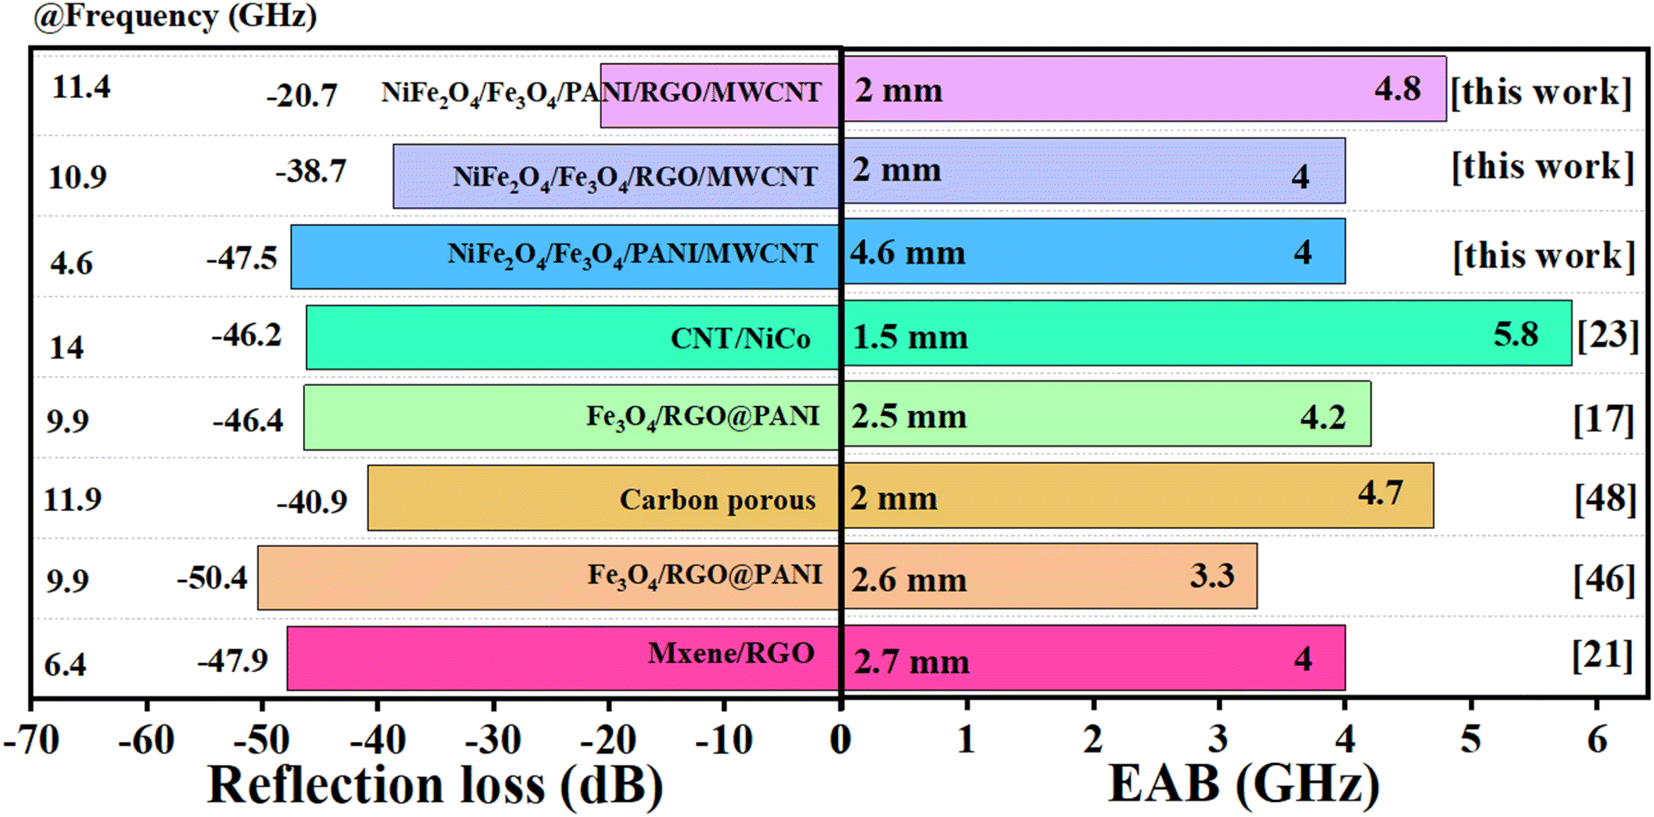 | ||
| Fig. 12 The comparison of absorption parameters of our work with other related studies. | ||
While the RL parameter is essential for describing the microwave absorption (MA) performance of materials, impedance matching is also crucial. Impedance matching plays a key role in the absorption of electromagnetic waves and is defined in eqn (4)
 | (4) |
When the impedance matching value is close to 1, the absorbing material can absorb EM waves effectively without reflection.59Fig. 13 shows that the impedance matching values of samples containing MWCNT (S5, S6, S7) are nearly equal to 1 compared to samples without MWCNT. Despite the higher dielectric loss of S7 compared to S6 and S5, S5 demonstrates the best RLmin due to its superior impedance-matching capabilities. In Fig. 13c, the impedance matching of all samples versus frequency is depicted for the thicknesses that include the best RLmin.
 | ||
| Fig. 13 2D (a), contour impedance matching diagrams (b), the Z (impedance matching) versus frequency for thickness including the best RLmin (c), the best input impedance matching coefficient (Mz) (d) of S1, S2, S3, S4, S5, S6, S7. | ||
The input impedance matching coefficient (Mz), defined in eqn (5), is shown only for the best values of each sample in Fig. 13d and detail for all samples in Fig. 14:
 | (5) |
 is the real normalized input impedance. If the characteristic impedance of the material is nearly equivalent to the characteristic impedance of free space, (Mz) impedance matching is close to 1, and therefore this good impedance matching causes to strengthened absorption peak.60Fig. 14 illustrates that compared to the other samples, S5, S6, and S7 have acceptable Mz values, indicating their good impedance matching and high electromagnetic wave absorption performance.
 | ||
| Fig. 14 2D, contour diagrams of input impedance matching coefficient for S1 (a, b), S2 (a, b), S3 (a, b), S4 (a, b), S5 (a, b), S6 (a, b), S7 (a, b). | ||
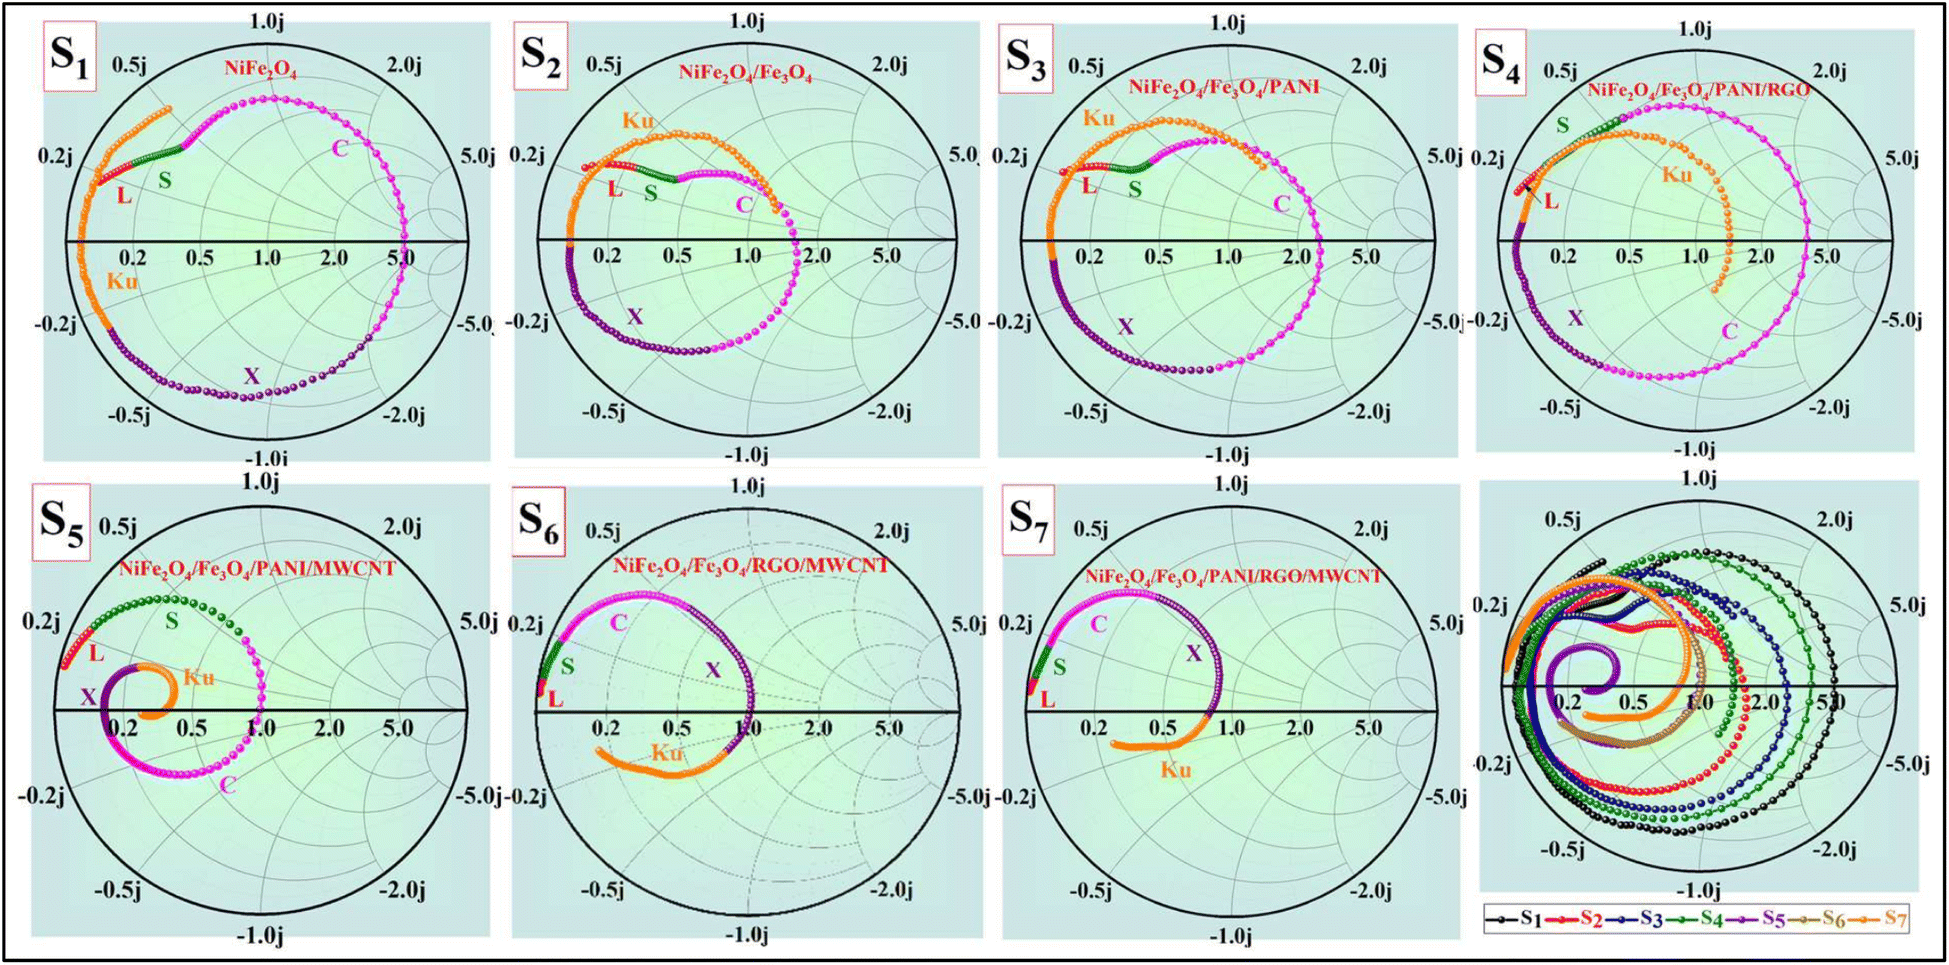 | ||
| Fig. 15 The Smith chart characteristics of S1, S2, S3, S4, S5, S6, and S7 are depicted with different colors to distinguish each frequency band. The frequency bands L, S, C, X, and Ku are represented by red, green, pink, purple, and orange colors respectively for clarity. | ||
 | (6) |
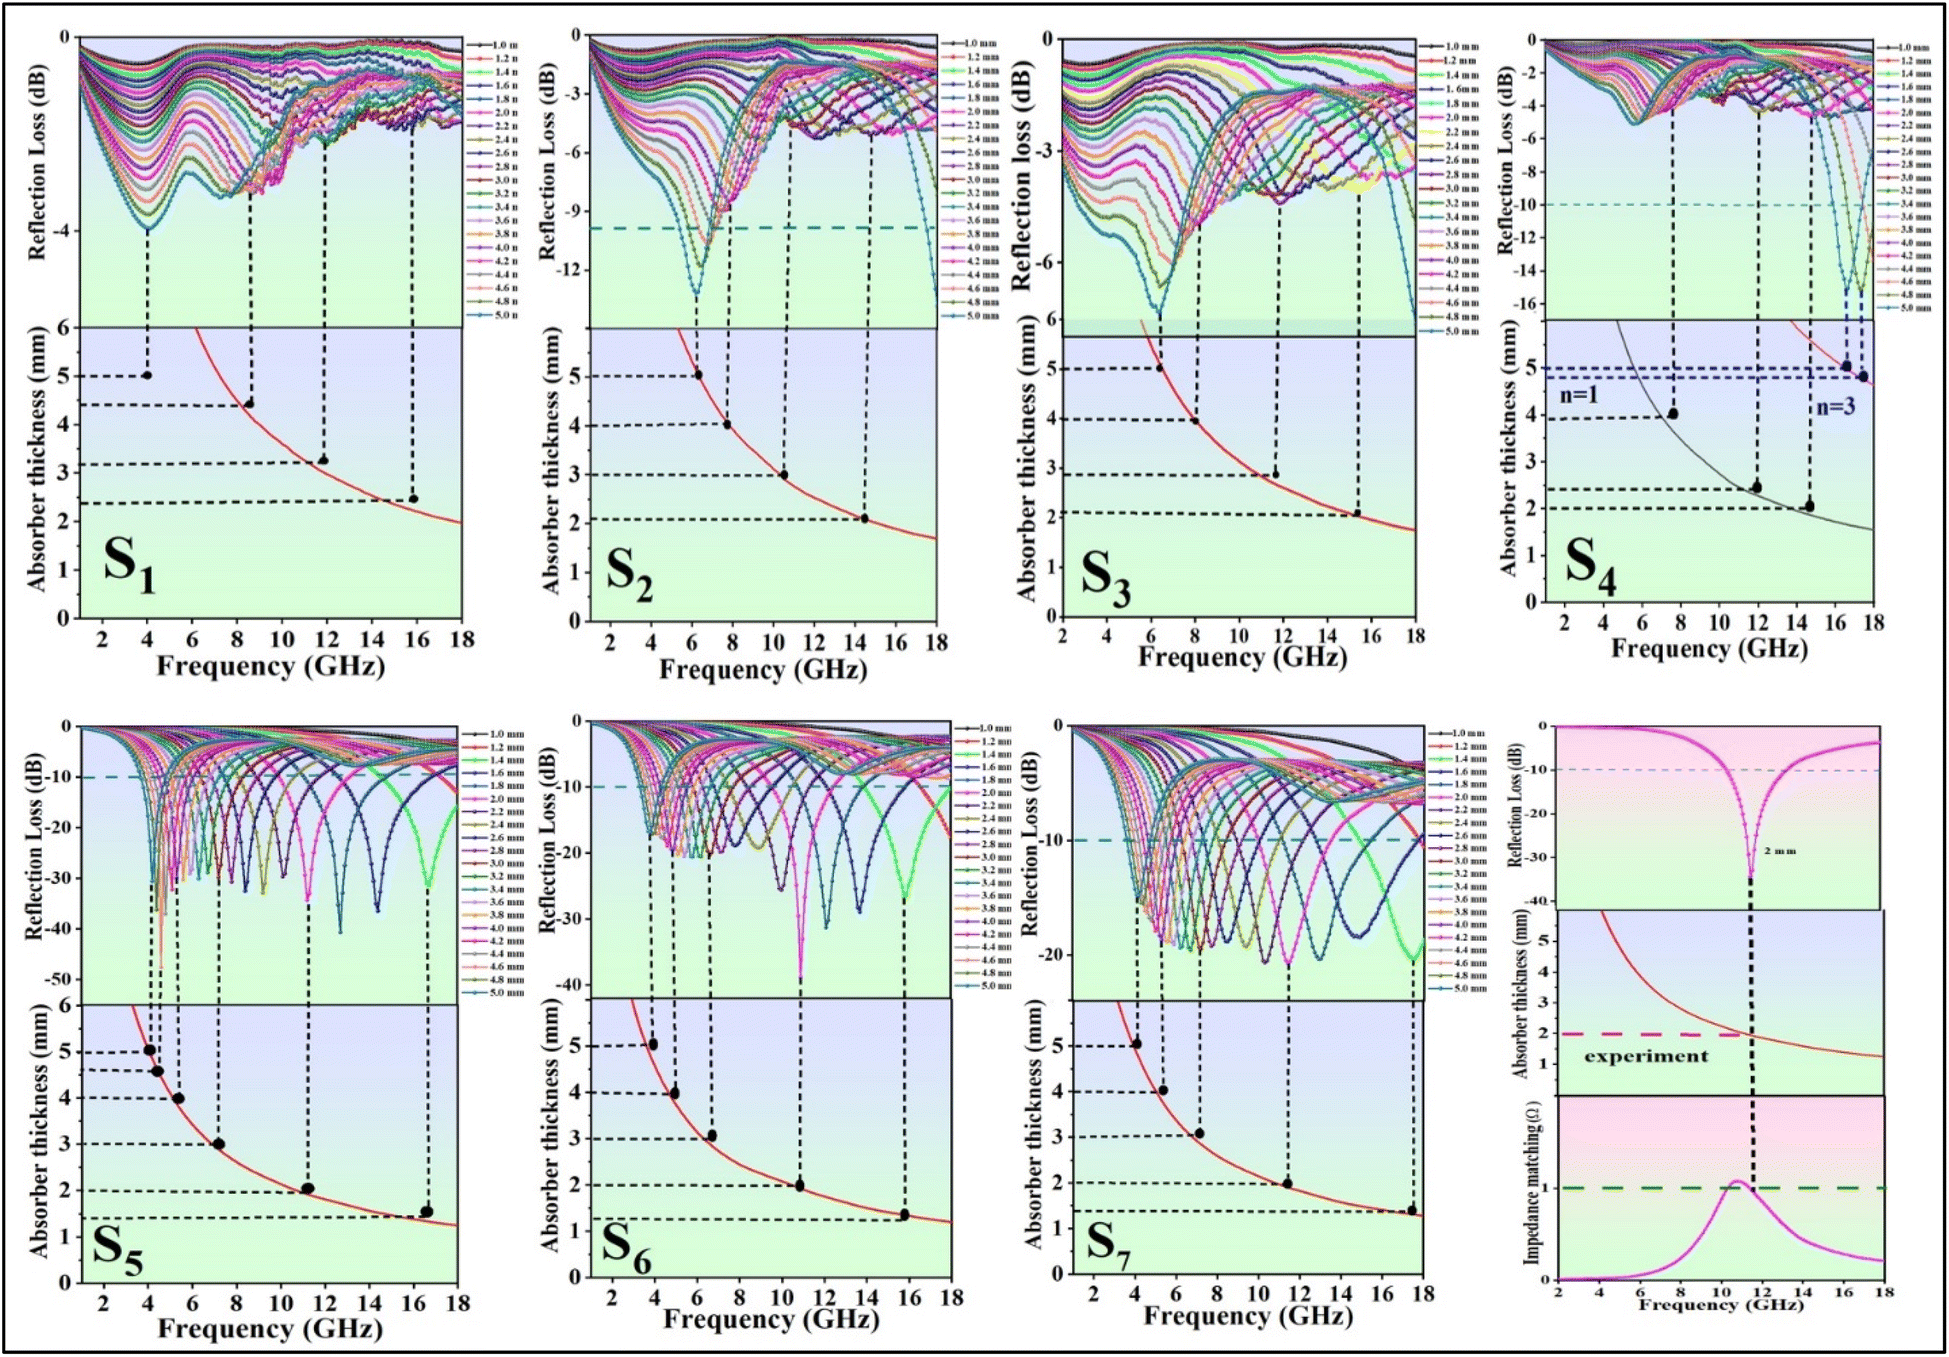 | ||
| Fig. 16 RL curves and absorber thickness (experimental and fitted matching thicknesses) versus frequency of (S1) NiFe2O4, (S2) NiFe2O4/Fe3O4, (S3) NiFe2O4/Fe3O4/PANI, (S4) NiFe2O4/Fe3O4/PANI/RGO, (S5) NiFe2O4/Fe3O4/PANI/MWCNT, (S6) NiFe2O4/Fe3O4/RGO/MWCNT, (S7) NiFe2O4/Fe3O4/PANI/RGO/MWCNT. | ||
To assess the impact of eddy current loss, the coefficient C0 is evaluated using eqn (7):
| C0 = μ′′(μ′)−2f−1 | (7) |
If eddy current loss is the sole mechanism contributing to magnetic loss within a specific frequency range, the coefficient C0 will remain constant. In Fig. 17a, it can be observed that between 2–10 GHz, C0 exhibits a diminishing trend, with fluctuations indicating the presence of natural resonance. However, beyond 10 GHz C0 remains constant, signifying the dominance of eddy current loss. Hence, eddy current losses are the primary cause of magnetic losses in the 10–18 GHz range, albeit at a relatively low magnitude.64 At higher frequencies where fluctuations are not prominent, the impact of exchange resonance on losses is minimal. Generally, ferrites with high electrical resistance exhibit low dielectric loss, resulting in low eddy current losses in nanocomposites containing ferrites.
 | ||
| Fig. 17 (a): Eddy current loss coefficient, and (b): attenuation constant, (c): interface reflection coefficient, (d): dielectric conductivity of (S1) NiFe2O4, (S2) NiFe2O4/Fe3O4, (S3) NiFe2O4/Fe3O4/PANI, (S4) NiFe2O4/Fe3O4/PANI/RGO, (S5) NiFe2O4/Fe3O4/PANI/MWCNT, (S6) NiFe2O4/Fe3O4/RGO/MWCNT, (S7) NiFe2O4/Fe3O4/PANI/RGO/MWCNT. | ||
The attenuation constant is another crucial parameter for assessing the absorption capabilities of absorbing materials, determined by the permittivity and permeability, as defined by eqn (8):
 | (8) |
The attenuation constants of the nanocomposites are illustrated in Fig. 17b. Among the samples, those containing MWCNT exhibit higher attenuation constants compared to the others. This indicates that the introduction of MWCNT into the nanocomposites has significantly enhanced their dielectric loss capabilities and attenuation constant (α), attributed to the notable increase in the electrical conductivity of the nanocomposites. While sample S6 boasts the highest attenuation constant, its impedance matching value is 0.9, resulting in a weaker RLmin compared to sample S5, which possesses an impedance matching value closer to 1 and consequently achieves the best RL performance. An ideal EM absorber should have a high attenuation coefficient and near-perfect impedance matching (close to 1) simultaneously.50
EM waves typically reflect at the interface between the absorbing material and air. The interface reflection coefficient (R) represents the ratio of the reflected wave to the incident wave and is derived from eqn (9):65
 | (9) |
In Fig. 17d, it is observed that the dielectric conductive loss is directly proportional to the conductivity of the absorbents. The incorporation of conductive components in the nanocomposite formulation can enhance the conductive loss, as calculated using eqn (10):51
| σ = ωε0ε′′ | (10) |
The presence of the conductive material RGO has increased the dielectric conductivity of nano composition S4 compared to S1, S2, and S3. However, MWCNT plays a significant role in improving conductive loss, leading to higher conductive loss in S5, S6, and S7.
Fig. 18 presents 3D and 2D Cole–Cole curves for all samples. Specifically, Fig. 18(h) and (i) display 2D Cole–Cole curves for S1, S2, S3, S4, S5, S6, and S7. The polarization-relaxation phenomena are fundamental dielectric loss mechanisms that absorb electromagnetic microwaves, as described by the Cole–Cole model.66,67 In the Cole–Cole curve, each semicircle represents a Debye relaxation process. Fig. 18 illustrates that all samples exhibit multiple semicircles, indicating multiple relaxations. These multiple relaxations include interface polarization and dipolar polarization.42 Another dielectric loss mechanism is identified by the deviation from the circular state, attributed to conduction loss.4 This conduction loss originates from the migration of electrons within the conductive network of RGO and MWCNT, with PANI playing a minor role, ultimately enhancing conduction loss.
 | ||
| Fig. 18 3D Cole–Cole curves for (S1) NiFe2O4, (S2) NiFe2O4/Fe3O4, (S3) NiFe2O4/Fe3O4/PANI, (S4) NiFe2O4/Fe3O4/PANI/RGO, (S5) NiFe2O4/Fe3O4/PANI/MWCNT, (S6) NiFe2O4/Fe3O4/RGO/MWCNT, (S7) NiFe2O4/Fe3O4/PANI/RGO/MWCNT, (h) 2D curves of all samples, (i) 2D curves of the samples contains MWCNT. | ||
The Cole–Cole relation is mathematically represented by eqn (11):
 | (11) |
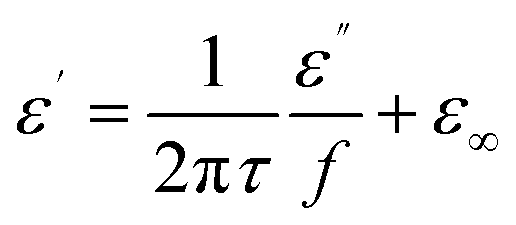 | (12) |
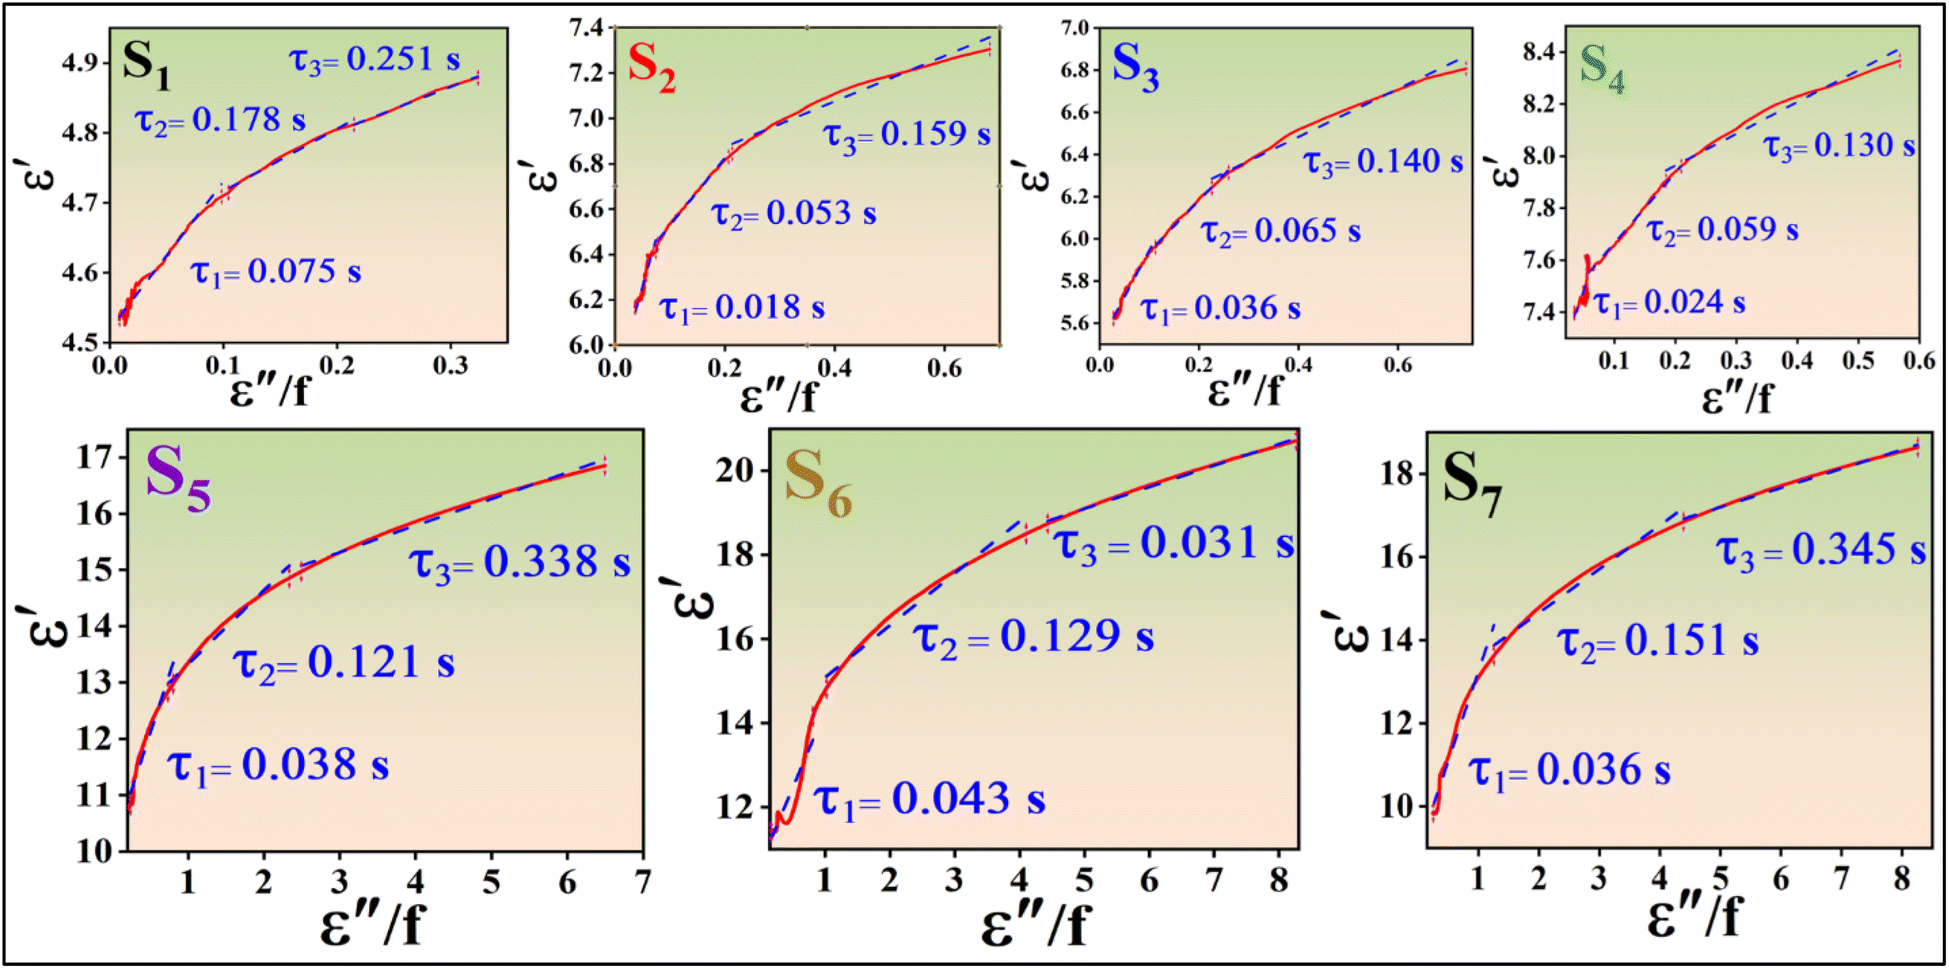 | ||
| Fig. 19 ε′ versus ε′′/f (solid red line) and relaxation times obtained from the slopes of the fitted lines (dashed blue line) of (S1) NiFe2O4, (S2) NiFe2O4/Fe3O4, (S3) NiFe2O4/Fe3O4/PANI, (S4) NiFe2O4/Fe3O4/PANI/RGO, (S5) NiFe2O4/Fe3O4/PANI/MWCNT, (S6) NiFe2O4/Fe3O4/RGO/MWCNT, (S7) NiFe2O4/Fe3O4/PANI/RGO/MWCNT. | ||
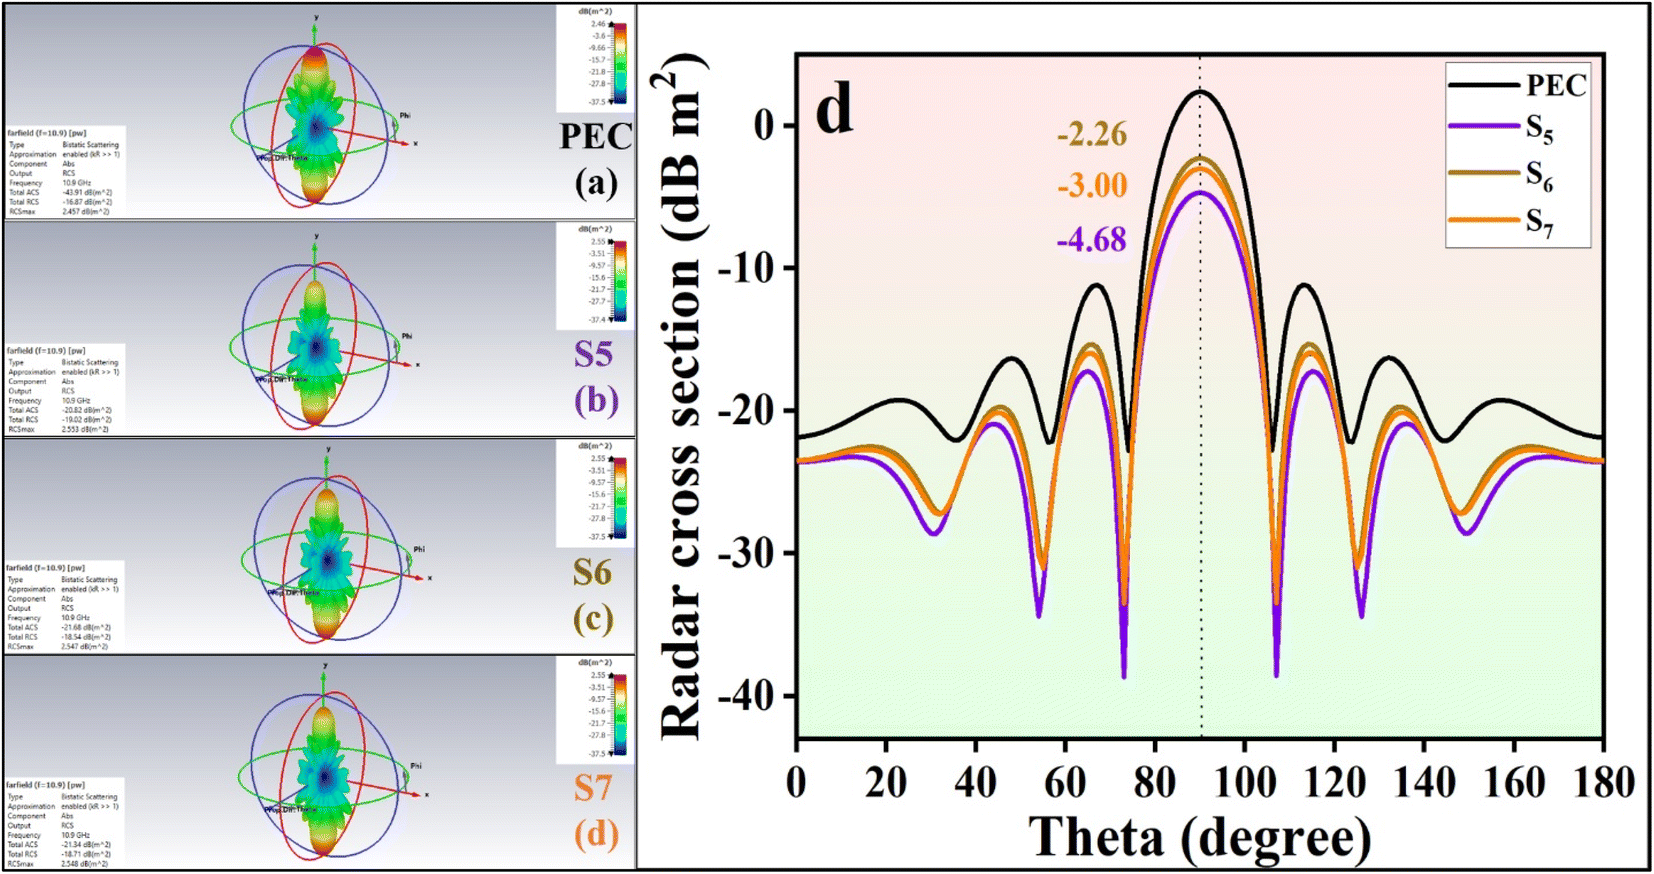 | ||
| Fig. 20 3D intensity images of the reflected signal PEC (a), PEC coated with S5, S6, S7, and RCS simulated curves of the samples at different scanning angles (d). | ||
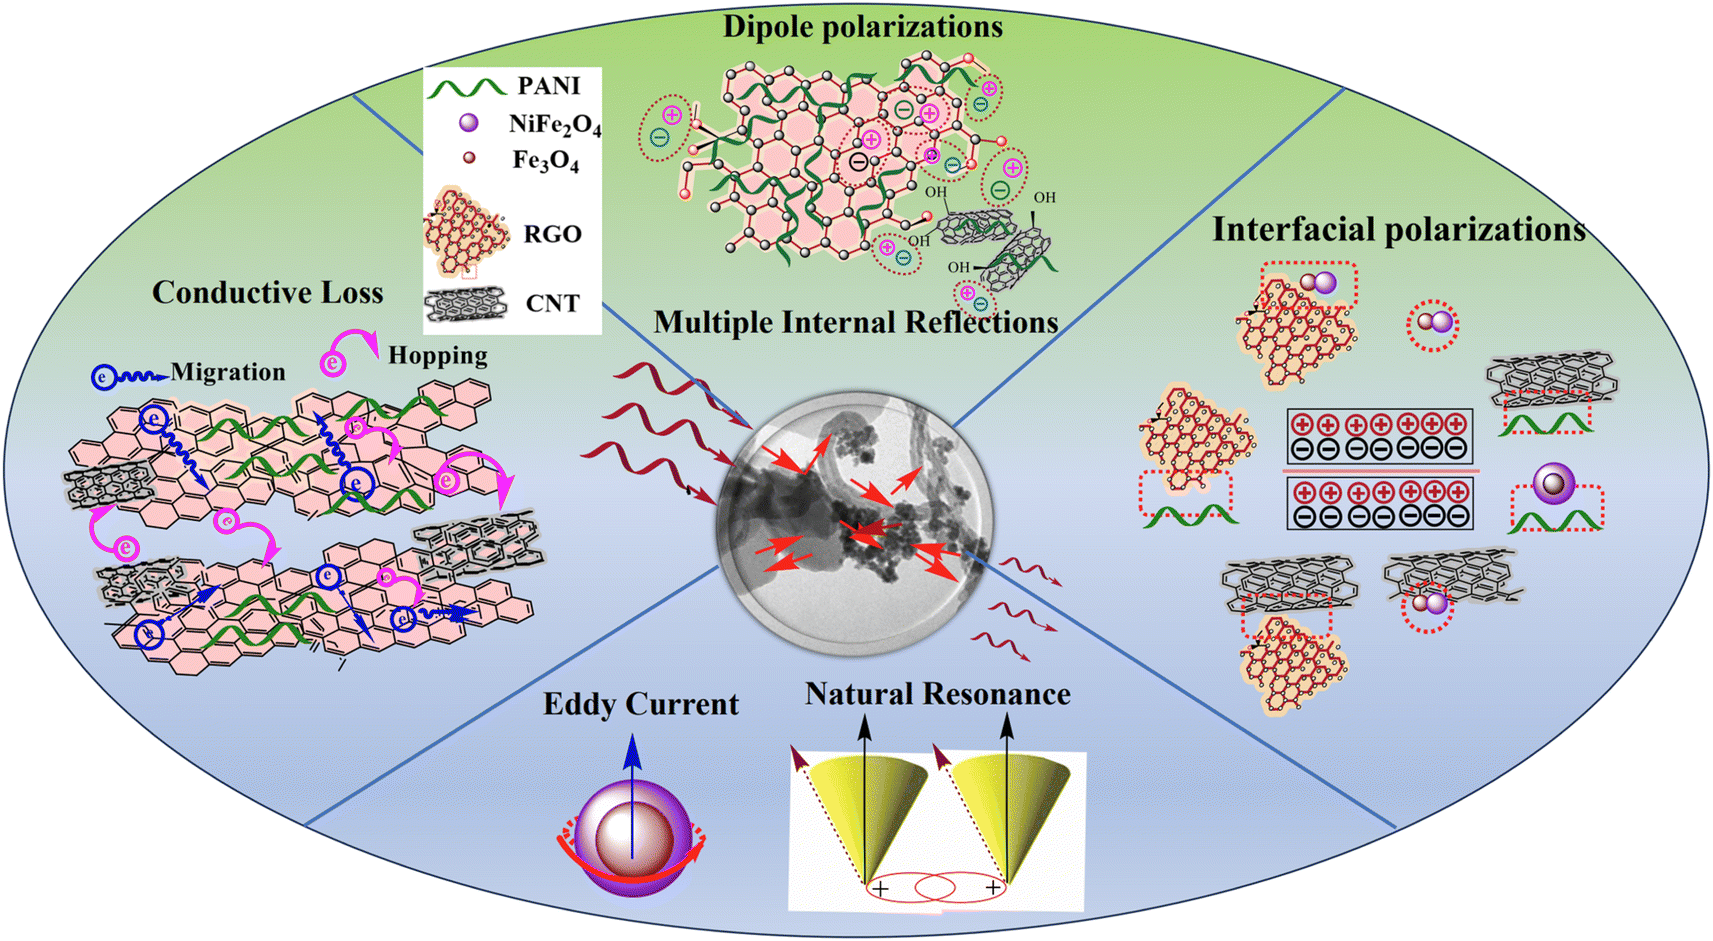 | ||
| Fig. 21 Schematic diagram of MA mechanisms of interfacial polarization, dipole polarization, conduction loss, and magnetic loss for NiFe2O4/Fe3O4/PANI/RGO/MWCNT. | ||
4 Conclusion
In summary, the nanocomposites NiFe2O4 (S1), NiFe2O4/Fe3O4 (S2), NiFe2O4/Fe3O4/PANI (S3), NiFe2O4/Fe3O4/PANI/RGO (S4), NiFe2O4/Fe3O4/PANI/MWCNT (S5), NiFe2O4/Fe3O4/RGO/MWCNT (S6), and NiFe2O4/Fe3O4/PANI/RGO/MWCNT (S7) were successfully synthesized using hydrothermal, coprecipitation, and in situ polymerization methods. The addition of MWCNT to the samples significantly enhanced their microwave absorption performance. Notably, sample S5 exhibited outstanding reflection loss of −47.5 dB at 4.6 GHz with a matching thickness of 4.6 mm and the best effective absorption bandwidth of 4 GHz for d = 1.6 mm. The RLmin of sample S5 remained below −10 dB for various thicknesses and frequencies, indicating its excellent absorption of electromagnetic waves across the C, X, and Ku bands. Sample S6 demonstrated favorable microwave absorption properties with an EAB of 4 GHz at d = 1.4 mm and an RLmin = −38.7 dB at 10.9 GHz for a thickness of 2 mm. The widest EAB of 4.8 GHz was achieved by sample S7 at d = 1.6 mm, covering more than one-fourth of the frequency band independently. Similarly, the CST simulation results confirm that the three synthesized products (S5, S6, and S7) are capable of dissipating microwave energy and have the potential for real-world practical applications. The synergistic effects of RGO, MWCNT, and PANI in creating an extended conductive network are believed to be responsible for this phenomenon. The heterogeneous structure of the prepared nanocomposites acts as a broadband absorber, absorbing over 99% of incident electromagnetic waves. The careful selection of ingredients and the preparation method resulted in a well-designed material rich in interfaces, void spaces, and interconnected conductive networks, leading to the dissipation of microwaves through a combination of dielectric, conductive, and magnetic losses.Abbreviations
| EAB | effective absorption bandwidth |
| EDS | energy-dispersive X-ray spectroscopy |
| EM | electromagnetic |
| FESEM | field emission scanning electron microscopy |
| FTIR | Fourier transform infrared |
| GO | graphene oxide |
| MA | microwave absorption |
| MAMs | microwave-absorbing materials |
| MWCNT | multi-walled carbon nanotube |
| PANI | polyaniline |
| PEC | perfect electric conductor |
| RCS | radar cross-section |
| RGO | reduced graphene oxide |
| RL | reflection loss |
| RT | room temperature |
| TEM | transmission electron microscopy |
| VSM | vibrating-sample magnetometry |
| XRD | X-ray diffraction |
Symbols
| c | speed of the electromagnetic wave |
| f | frequency of the microwave |
| λ | wavelength of the microwave |
| tanδε | dielectric loss tangent |
| tanδμ | magnetic loss tangent |
| t m | matching thickness |
| Z 0 | impedance of free space |
| Z in | input impedance |
| α | attenuation coefficient |
| ε 0 | permittivity of free space |
| ε r | relative permittivity |
| ε′ | real part of relative permittivity |
| ε′′′ | imaginary part of relative permittivity |
| μ 0 | permeability of free space |
| μ r | relative permeability |
| μ′ | real part of relative permeability |
| μ′′ | imaginary part of relative permeability |
| σ | electrical conductivity |
Data availability
All data generated or analyzed during this study are included in this article.Conflicts of interest
The authors declare no competing interests.Acknowledgements
The authors thank Prof. J. Teixeira for his assistance with the manuscript and valuable comments.References
- F. Ebrahimi-Tazangi, M. Maazallahi, P. Livreri and J. Seyed-Yazdi, MnFe2O4/Fe3O4/PANI/rGO heterogeneous nanocomposites: Outstanding dual-broadband nano-coating microwave absorbers, J. Alloys Compd., 2024, 1002, 175149, DOI:10.1016/j.jallcom.2024.175149.
- L. Liang, X. Yang, Ch. Li, R. Yu, B. Zhang, Y. Yang and G. Ji, MXene-Enabled Pneumatic Multiscale Shape Morphing for Adaptive, Programmable and Multimodal Radar-infrared Compatible Camouflage, Adv. Mater., 2024, 36, 2313939, DOI:10.1002/adma.202313939.
- R. Liu, M. Miao, Y. Li, J. Zhang, S. Cao and X. Feng, Ultrathin Biomimetic Polymeric Ti3C2Tx MXene Composite Films for Electromagnetic Interference Shielding, ACS Appl. Mater. Interfaces, 2018, 10, 44787–44795, DOI:10.1021/acsami.8b18347.
- B. Zhan, Y. Qu, X. Qi, J. Ding, J. Shao, X. Gong, J. Yang, Y. Chen, Q. Peng, W. Zhong and H. Lv, Mixed-Dimensional Assembly Strategy to Construct Reduced Graphene Oxide/Carbon Foams Heterostructures for Microwave Absorption, Anti-Corrosion and Thermal Insulation, Nano-Micro Lett., 2024, 16, 221, DOI:10.1007/s40820-024-01447-9.
- S. Golchinvafa, S. M. Masoudpanah and S. Alamolhoda, Ultra-broadband FeNi3/NiZnFe2O4/ZnO composite powders for microwave absorption, J. Mater. Res. Technol., 2022, 21, 1737–1748, DOI:10.1016/j.jmrt.2022.09.123.
- Y. Cao, N. Forouk, N. Mortezaei, A. V. Yumasher and M. N. Akhtar, Arabmarkadeh, Investigation on microwave absorption characteristics of ternary MWCNTs/CoFe2O4/FeCo nanocomposite coated with conductive PEDOT-Polyaniline Co-polymers, Ceram. Int., 2021, 47(9), 12244–12251, DOI:10.1016/j.ceramint.2021.01.073.
- J. Xue, H. Zhang, J. Zhao, X. Ou and Y. Ling, Characterization and microwave absorption of spinel MFe2O4 (M= Mg, Mn, Zn) nanoparticles prepared by a facile oxidation-precipitation process, J. Magn. Magn. Mater., 2020, 514, 167168, DOI:10.1016/j.jmmm.2020.167168.
- D. Mandal and M. Mandal, Electromagnetic wave attenuation properties of MFe2O4 (M= Mn, Fe, Co, Ni, Cu, Zn) nano-hollow spheres in search of an efficient microwave absorber, J. Magn. Magn. Mater., 2021, 536, 168127, DOI:10.1016/j.jmmm.2021.168127.
- A. Toghan, M. Khairy, E. M. Kamar and M. A. Mousa, Effect of particle size and morphological structure on the physical properties of NiFe2O4 for supercapacitor application, J. Mater. Res. Technol., 2022, 19, 3521–3535, DOI:10.1016/j.jmrt.2022.06.095.
- S. Li, J. Luo, J. Wang, Y. Zhu, J. Feng, N. Fu, H. Wang, Y. Guo, D. Tian, Y. Zheng, S. Sun, C. Zhang, K. Chen, S. Mu and Y. Huang, Hybrid supercapacitors using metal-organic framework derived nickel-sulfur compounds, J. Colloid Interface Sci., 2024, 669, 265–274, DOI:10.1016/j.jcis.2024.04.205.
- P. Balasubramanian, S. B. He, A. Jansirani, H. H. Deng, H. P. Peng and X. H. Xia, et al., Engineering of oxygen vacancies regulated core-shell N-doped carbon@ NiFe2O4 nanospheres: A superior bifunctional electrocatalyst for boosting the kinetics of oxygen and hydrogen evaluation reactions, Chem. Eng. J., 2021, 405, 126732, DOI:10.1016/j.cej.2020.126732.
- Y. Zhang, X. Wang and M. Cao, Confinedly implanted NiFe2O4-RGO: Cluster tailoring and highly tunable electromagnetic properties for selective-frequency microwave absorption, Nano Res., 2018, 11(3), 1426–1436, DOI:10.1007/s12274-017-1758-1.
- M. Yuan, M. Zhou and H. Fu, Synergistic microstructure of sandwich-like NiFe@ SiO2@ MXene nanocomposites for enhancement of microwave absorption in the whole Ku-band, Composites, Part B, 2021, 224, 109178, DOI:10.1016/j.compositesb.2021.109178.
- A. Kumar, A. K. Singh, M. Tomar, V. Gupta, P. Kumar and K. Singh, Electromagnetic interference shielding performance of lightweight NiFe2O4/RGO nanocomposite in X-band frequency range, Ceram. Int., 2020, 46(10), 15473–15481, DOI:10.1016/j.ceramint.2020.03.092.
- Q. A. Alsulami, Structural, dielectric, and magnetic studies based on MWCNTs/NiFe2O4/ZnO nanoparticles dispersed in polymer PVA/PEO for electromagnetic applications, J. Mater. Sci.: Mater. Electron., 2021, 32(3), 2906–2924, DOI:10.1007/s10854-020-05043-6.
- F. Ebrahimi-Tazangi, S. H. Hekmatara and J. Seyed-Yazdi, Synthesis and remarkable microwave absorption properties of amine-functionalized magnetite/graphene oxide nanocomposites, J. Alloys Compd., 2019, 809, 151779, DOI:10.1016/j.jallcom.2019.151779.
- H. Cai, C. Feng, H. Xiao and B. Cheng, Synthesis of Fe3O4/RGO@ PANI with three-dimensional flower-like nanostructure and microwave absorption properties, J. Alloys Compd., 2022, 893, 162227, DOI:10.1016/j.jallcom.2021.162227.
- Y. Wang, L. Yao, Q. Zheng and M. S. Cao, Graphene-wrapped multiloculated nickel ferrite: A highly efficient electromagnetic attenuation material for microwave absorbing and green shielding, Nano Res., 2022, 1–10, DOI:10.1007/s12274-022-4428-x.
- P. Heidari and S. Masoudpanah, A facial synthesis of MgFe2O4/RGO nanocomposite powders as a high-performance microwave absorber, J. Alloys Compd., 2020, 834, 155166, DOI:10.1016/j.jallcom.2020.155166.
- Q. Huang, Y. Zhao, Y. Wu, M. Zhou, S. Tan and S. Tang, et al., A dual-band transceiver with excellent heat insulation property for microwave absorption and low infrared emissivity compatibility, Chem. Eng. J., 2022, 137279, DOI:10.1016/j.cej.2022.137279.
- F. Yang, Y. Huang, X. Han, S. Zhang, M. Yu and J. Zhang, et al., Covalent Bonding of MXene/Reduced Graphene Oxide Composites for Efficient Electromagnetic Wave Absorption, ACS Appl. Nano Mater., 2023, 6(5), 3367–3377, DOI:10.1021/acsanm.2c05150.
- G. Salimbeygi, K. Nasouri, A. Mousavi Shashtari, R. Malek and F. Mazaheri, Microwave absorption properties of polyaniline/poly (vinyl alcohol)/multi-walled carbon nanotube composites in thin film and nanofiber layer structures, Macromol. Res., 2015, 23(8), 741–748, DOI:10.1007/s13233-015-3102-5.
- J. Xu, C. Bian, J. Sun, D. Liu, X. Wang and Z. Xue, et al., Heterostructure tailoring of carbon nanotubes grown on prismatic NiCo clusters for high-efficiency electromagnetic absorption, J. Colloid Interface Sci., 2023, 634, 185–194, DOI:10.1016/j.jcis.2022.12.037.
- B. G. Soares, G. M. Barra and T. Indrusiak, Conducting polymeric composites based on intrinsically conducting polymers as electromagnetic interference shielding/microwave absorbing materials—A review, J. Compos. Sci., 2021, 5(7), 173, DOI:10.3390/JCS5070173.
- S. S. Hassan, A. H. Kamel, A. A. Hassan, A. E. E. Amr, H. A. El-Naby and M. A. Al-Omar, et al., CuFe2O4/polyaniline (PANI) nanocomposite for the hazard mercuric ion removal: synthesis, characterization, and adsorption properties study, Molecules, 2020, 25(12), 2721, DOI:10.3390/molecules25122721.
- F. Ebrahimi-Tazangi, J. Seyed-Yazdi and S. H. Hekmatara, α-Fe2O3@ CoFe2O4/GO nanocomposites for broadband microwave absorption by surface/interface effects, J. Alloys Compd., 2022, 900, 163340, DOI:10.1016/j.jallcom.2021.163340.
- M. Zhang, L. Chen, Y. Yu, X. Meng and J. Xiang, Cabon nanofiber supported cobalt ferrite composites with tunable microwave absorption properties, Ceram. Int., 2021, 47(7), 9392–9399, DOI:10.1016/j.ceramint.2020.12.071.
- W. Ma, R. Yang, Z. Yang, C. Duan and T. Wang, Synthesis of reduced graphene oxide/zinc ferrite/nickel nanohybrids: As a lightweight and high-performance microwave absorber in the low frequency, J. Mater. Sci.: Mater. Electron., 2019, 30(20), 18496–18505, DOI:10.1007/s10854-019-02203-1.
- Q. Li, W. Guo, X. Kong, J. Xu, Ch. Xu, Y. Chen, J. Chen, X. Jia and Y. Ding, MnFe2O4/rGO/Diatomite composites with excellent wideband electromagnetic microwave absorption, J. Alloys Compd., 2023, 941, 168851, DOI:10.1016/j.jallcom.2023.168851.
- Y. Zhang, J. Liu, Y. Zhang, J. Liu and Y. Duan, Facile synthesis of hierarchical nanocomposites of aligned polyaniline nanorods on reduced graphene oxide nanosheets for microwave absorbing materials, RSC Adv., 2017, 7(85), 54031–54038, 10.1039/c7ra08794b.
- A. Henaish, B. I. Salem, T. M. Meaz, Y. A. Alibwaini, A. W. Ajlouni and O. M. Hemeda, et al., Synthesize, characterization, dielectric, linear and nonlinear optical properties of Ni–Al Ferrite/PANI nanocomposite film, Opt. Mater., 2021, 119, 111397, DOI:10.1016/j.optmat.2021.111397.
- L. Xie, Z. Ren, P. Zhu, J. Xu, D. Luo and J. Lin, A novel CeO2–TiO2/PANI/NiFe2O4 magnetic photocatalyst: Preparation, characterization and photodegradation of tetracycline hydrochloride under visible light, J. Solid State Chem., 2021, 300, 122208, DOI:10.1016/j.jssc.2021.122208.
- R. Shu, G. Zhang, J. Zhang, X. Wang, M. Wang and Y. Gan, et al., Fabrication of reduced graphene oxide/multi-walled carbon nanotubes/zinc ferrite hybrid composites as high-performance microwave absorbers, J. Alloys Compd., 2018, 736, 1–11, DOI:10.1016/j.jallcom.2017.11.084.
- M. Kooti, A. Naghdi Sadeh, Kh. Gheisari and A. Figuerola, Synthesis, characterization, and performance of nanocomposites containing reduced graphene oxide, polyaniline, and cobalt ferrite, Phys. B, 2021, 612, 412974, DOI:10.1016/j.physb.2021.412974.
- Y. Wu, R. Shu, C. Li, C. Guo, G. Zhang and J. Zhang, et al., Design and electromagnetic wave absorption properties of reduced graphene oxide/multi-walled carbon nanotubes/nickel ferrite ternary nanocomposites, J. Alloys Compd., 2019, 784, 887–896, DOI:10.1016/j.jallcom.2019.01.139.
- J. A. Oyetade, R. Lazaro Machunda and A. Hilonga, Functional impacts of polyaniline in composite matrix of photocatalysts: an instrumental overview, RSC Adv., 2023, 13, 15467–15489, 10.1039/d3ra01243c.
- Q. Ban, Y. Li, Y. Qin, Y. Zheng, X. Xie and Z. Yu, et al., Hierarchical engineering of Large-caliber carbon Nanotube/Mesoporous Carbon/Fe3C nanoparticle hybrid nanocomposite towards Ultra-lightweight electromagnetic microwave absorber, J. Colloid Interface Sci., 2022, 616, 618–630, DOI:10.1016/j.jcis.2022.02.104.
- Y. Ding, Q. Liao, S. Liu, H. Guo, Y. Sun and G. Zhang, et al., Reduced graphene oxide functionalized with cobalt ferrite nanocomposites for enhanced efficient and lightweight electromagnetic wave absorption, Sci. Rep., 2016, 6(1), 1–9, DOI:10.1038/srep32381.
- J. Yan, Y. Huang, X. Chen and C. Wei, Conducting polymers-NiFe2O4 coated on reduced graphene oxide sheets as electromagnetic (EM) wave absorption materials, Synth. Met., 2016, 221, 291–298, DOI:10.1016/j.synthmet.2016.09.018.
- Y. Piao, V. N. Tondare, C. S. Davis, J. M. Gorham, E. J. Petersen and J. W. Gilman, et al., Comparative study of multiwall carbon nanotube nanocomposites by Raman, SEM, and XPS measurement techniques, Compos. Sci. Technol., 2021, 208, 108753, DOI:10.1016/j.compscitech.2021.108753.
- B. Nandan, M. Bhatnagar and S. C. Kashyap, Cation distribution in nanocrystalline cobalt substituted nickel ferrites: X-ray diffraction and Raman spectroscopic investigations, J. Phys. Chem. Solids, 2019, 129, 298–306, DOI:10.1016/j.jpcs.2019.01.017.
- K. Cao, X. Yang, R. Zhao and W. Xue, Fabrication of an ultralight Ni-MOF-RGO aerogel with both dielectric and magnetic performances for enhanced microwave absorption: microspheres with hollow structure grow onto the GO nanosheets, ACS Appl. Mater. Interfaces, 2023, 15(7), 9685–9696, DOI:10.1021/acsami.2c22935.
- X. Di, Y. Wang, Z. Lu, R. Cheng and X. Wu, Design of biomass-derived magnetic carbon/polyaniline with hierarchical network for superior microwave absorption, J. Mater. Sci.: Mater. Electron., 2021, 32(14), 18790–18807, DOI:10.1007/s10854-021-06397.
- K. Peng, Y. Wu, G. Fang, G. Xu and C. Liu, Self-assembly hollow magnetoelectric composites emerging tunable property between microwave absorption and shielding with light-weight and broad bandwidth, J. Alloys Compd., 2023, 947, 169368, DOI:10.1016/j.jallcom.2023.169368.
- A. Katheria, P. Das, A. Bhagat, J. Nayak, S. Paul and N. Das, Fe3O4@g-C3N4 and MWCNT embedded highly flexible polymeric hybrid composite for simultaneous thermal control and suppressing microwave radiation, J. Alloys Compd., 2024, 988, 174287, DOI:10.1016/j.jallcom.2024.174287.
- F. Fan, Z. Hu, Y. Ye and X. Liu, Preparation and Microwave Absorption Properties of Annular Fe3O4/RGO@ PANI, JOM, 2023, 1–11, DOI:10.1007/s11837-023-05808-4.
- J. Li, Y. Xie, W. Lu and T. W. Chou, Flexible electromagnetic wave absorbing composite based on 3D RGO-CNT-Fe3O4 ternary films, Carbon, 2018, 129, 76–84, DOI:10.1016/j.carbon.2017.11.094.
- Z. Wu, et al., Honeycomb-like bamboo powders-derived porous carbon with low filler loading, high-performance microwave absorption, Carbon, 2023, 215, 118415, DOI:10.1016/j.carbon.2023.118415.
- Y. Cao, A. M. Mohamed, M. Mousavi and Y. Akinay, Poly (pyrrole-co-styrene sulfonate)-encapsulated MWCNT/Fe–Ni alloy/NiFe2O4 nanocomposites for microwave absorption, Mater. Chem. Phys., 2021, 259, 124169, DOI:10.1016/j.matchemphys.2020.124169.
- Z. Cai, Y. Ma, K. Zhao, M. Yun, X. Wang and Z. Tong, et al., Ti3C2Tx MXene/graphene oxide/Co3O4 nanorods aerogels with tunable and broadband electromagnetic wave absorption, Chem. Eng. J., 2023, 462, 142042, DOI:10.1016/j.cej.2023.142042.
- X. Zhou, Z. Jia, X. Zhang, B. Wang, X. Liu and B. Xu, et al., Electromagnetic wave absorption performance of NiCo2X4 (X= O, S, Se, Te) spinel structures, Chem. Eng. J., 2021, 420, 129907, DOI:10.1016/j.cej.2021.129907.
- F. Ebrahimi-Tazangi, S. H. Hekmatara and J. Seyed-Yazdi, Remarkable microwave absorption of GO-SiO2/Fe3O4 via an effective design and optimized composition, J. Alloys Compd., 2021, 854, 157213, DOI:10.1016/j.jallcom.2020.157213.
- Q. Ren, T. Feng, Z. Song, P. Zhou, M. Wang and Q. Zhang, et al., Autogenous and tunable CNTs for enhanced polarization and conduction loss enabling sea urchin-like Co3ZnC/Co/C composites with excellent microwave absorption performance, ACS Appl. Mater. Interfaces, 2022, 14(36), 41246–41256, DOI:10.1021/acsami.2c13064.
- B. Dai, Y. Ma, S. Feng, H. Wang, M. Ma, J. Ding and X. Yin, et al., Fabrication of one-dimensional M (Co, Ni)@ polyaniline nanochains with adjustable thickness for excellent microwave absorption properties, J. Colloid Interface Sci., 2022, 627, 113–125, DOI:10.1016/j.jcis.2022.06.137.
- Z. Fu, C. Lin and X. Meng, Three dimension Ni0.5Zn0.5Fe2O4/BaFe12O19@carbon composite for light weight, strong absorption and broadband microwave absorbents, Ceram. Int., 2021, 47(11), 16070–16078, DOI:10.1016/j.ceramint.2021.02.181.
- Y. Zhang, F. Dai, A. Hassan, M. R. A. Refaee, S. Salman and K. Nag, et al., Investigations of microwave absorption performance of bi-layer absorber composed of FeWO4 & BiVO4 nanocomposite powder in 2–18 GHz, J. Colloid Interface Sci., 2023, 641, 1–14, DOI:10.1016/j.jcis.2023.03.029.
- J. Zhao, H. Wang, M. Chen, Y. Li, Z. Wang and C. Fang, et al., Construct of CoZnO/CSP biomass-derived carbon composites with broad effective absorption bandwidth of 7.2 GHz and excellent microwave absorption performance, J. Colloid Interface Sci., 2023, 639, 160–170, DOI:10.1016/j.jcis.2023.02.050.
- S. Zhu, Y. Gau, H. Zhou, C. Zheng, X. Li and Q. Man, et al., Expanded graphite/Co@ C composites with dual functions of corrosion resistance and microwave absorption, J. Mater. Res. Technol., 2023, 23, 3557–3569, DOI:10.1016/j.jmrt.2023.02.005.
- R. Zhang, D. Guo, Q. Liu, P. Yu, F. Wen and B. Wang, et al., Engineering core–shell heterocomposites of integrated 0D ZIF-8 (Zn) attached on 1D MIL-68 (In) nanorods for high performance electromagnetic wave absorption, Appl. Surf. Sci., 2023, 621, 156898, DOI:10.1016/j.apsusc.2023.156898.
- X. Gao, X. Wang, J. Cai, Y. Zhang, J. Zhang and S. Bi, et al., CNT cluster arrays grown on carbon fiber for excellent green EMI shielding and microwave absorbing, Carbon, 2023, 211, 118083, DOI:10.1016/j.carbon.2023.118083.
- Q. Jiang, Y. Qiao, A. Uddin, X. Wu, F. Qin and H. Yi, et al., Influence of impact on electromagnetic response of three-dimensional angle-interlock metacomposites, Compos. Commun., 2022, 30, 101076, DOI:10.1016/j.coco.2022.101076.
- Q. Jiang, Y. Qiao, A. Uddin, F. Qin, L. Chen and L. Wu, Tailoring electromagnetic response of three-dimensional waffle-like metacomposite based on arrangement angle of ferromagnetic microwires, Composites, Part B, 2022, 247, 110298, DOI:10.1016/j.compositesb.2022.110298.
- Y. Shen, Y. Wei, J. Ma, Y. Zhang, B. Ji and J. Tang, et al., Self-cleaning functionalized FeNi/NiFe2O4/NiO/C nanofibers with enhanced microwave absorption performance, Ceram. Int., 2020, 46(9), 13397–13406, DOI:10.1016/j.ceramint.2020.02.121.
- B. Dai, F. Dong, H. Wang, Y. Qu, J. Ding and Y. Ma, et al., Fabrication of CuS/Fe3O4@ polypyrrole flower-like composites for excellent electromagnetic wave absorption, J. Colloid Interface Sci., 2023, 634, 481–494, DOI:10.1016/j.jcis.2022.12.029.
- Y. Bai, L. He, P. Lv, C. Ge, H. Xu and X. Zhang, Impedance-matched (hydroxylated nano-BN/reduced graphene oxide)@ Fe3O4/polyaniline composite for efficient microwave absorption and thermal management, Mater. Chem. Phys., 2023, 295, 127193, DOI:10.1016/j.matchemphys.2022.127193.
- J. Xiao, B. Zhan, X. Qi, J. Ding, Y. Qu, X. Gong, J. Yang, L. Wang, W. Zhong and R. Che, Metal Valence State Modulation Strategy to Design Core@shell Hollow Carbon Microspheres@MoSe2/MoOx Multicomponent Composites for Anti-Corrosion and Microwave Absorption, Small, 2024, 2311312, DOI:10.1002/smll.202311312.
- G. Fang, Ch. Liu, M. Xu, X. Zhang, Y. Wu, D. H. Kim and G. Ji, The Elaborate Design of Multi-Polarization Effect by Non-Edge Defect Strategy for Ultra-Broad Microwave Absorption, Adv. Funct. Mater., 2024, 2404532, DOI:10.1002/adfm.202404532.
- H. Zheng, K. Nan, Z. Lu, N. Nian Wang and Y. Wang, Core-shell FeCo@carbon nanocages encapsulated in biomass-derived carbon aerogel: Architecture design and interface engineering of lightweight, anti-corrosion and superior microwave absorption, J. Colloid Interface Sci., 2023, 646, 555–566, DOI:10.1016/j.jcis.2023.05.076.
| This journal is © The Royal Society of Chemistry 2024 |