DOI:
10.1039/D4DT03253E
(Paper)
Dalton Trans., 2025,
54, 4120-4134
Bis(formazanate) iron(II) complexes as cathode materials for one-compartment H2O2 fuel cells†
Received
20th November 2024
, Accepted 15th January 2025
First published on 28th January 2025
Abstract
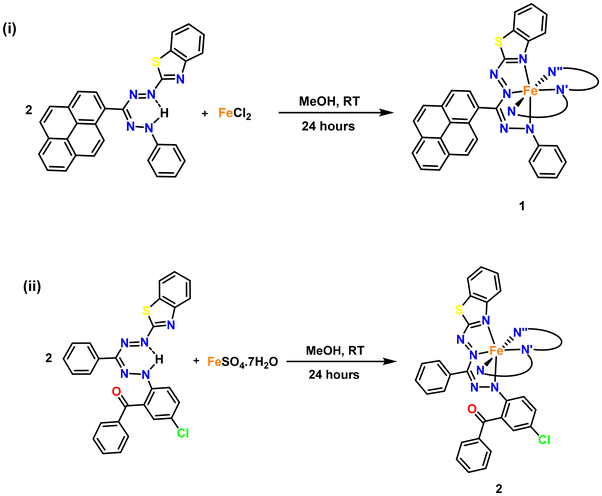
In this paper, we describe the synthesis of two six-coordinate, pseudo(octahedral) bis(formazanate) Fe(II) complexes based on newly developed redox-active benzothiazole-substituted formazanate ligands. Complexes [FeII(L1)2], 1, and [FeII(L2)2], 2, were synthesized by reacting 1-(benzothiazol-2-yl)-5-phenyl-3-(pyren-1-yl)formazan (L1H) and 1-(benzothiazol-2-yl)-5-(2-benzoyl-4-chlorophenyl)-3-phenylformazan (L2H), respectively, with appropriate Fe(II) precursors at room temperature. The molecular structures of both bis(formazanate) iron complexes were established using single-crystal XRD, and other characterization methods were utilized to further characterize these complexes, as well as the newly synthesized ligands. Furthermore, the cyclic voltammetry studies of these compounds are documented, revealing that both complexes can undergo electrochemical reductions to create anionic and dianionic species. These complexes were further employed as cathodes in one-compartment membrane-less H2O2 fuel cells, operating in 0.5 M H2O2, with nickel foam serving as the anode. The maximum power densities achieved by the designed H2O2 fuel cells for complexes 1 and 2 were 1.88 mW cm−2 and 3.08 mW cm−2, respectively. This study demonstrates the significant potential of formazanate-based compounds in the development of cathode materials for H2O2 fuel cells.
Introduction
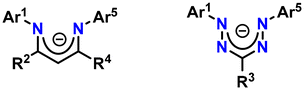
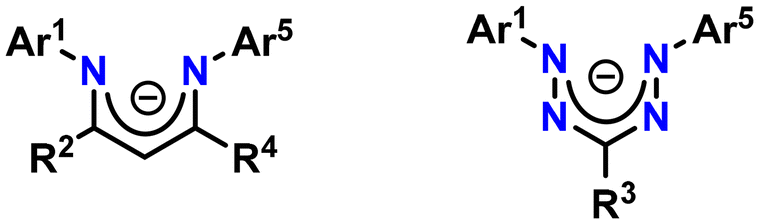
Despite being initially reported in the 1890s, formazans have only been widely investigated since the early 1940s.1 In recent years, formazanates with tetraazapentadienyl cores (NNCNN) structurally related to β-diketiminate ligands have gained popularity as N-chelating ligands.2,3 The backbone of formazanates contains two additional nitrogen atoms compared to that of β-diketiminates, providing more accessible redox properties and stronger visible absorption since their LUMOs are more stabilized (Chart 1). Furthermore, the four nitrogen atoms in the backbone confer coordinative flexibility, enabling the formation of 4-, 5-, and 6-membered chelates.
 |
| | Chart 1 β-Diketiminate ligand (left) and formazanate ligand (right). | |
The presence of high-lying filled and low-lying empty orbitals of π-symmetry makes formazanates suitable for both oxidative and reductive redox reactions. Since their LUMOs have lower energy compared to those of β-diketiminates and other related ligand families, formazanate metal complexes are likely to undergo ligand-based reduction reactions easily. As redox-active ligands can accept and donate electrons in a reversible manner, they offer a convenient method for generating more accessible reduced states, and by lowering their orbital energy, they can moderate the redox potential.4,5 The low-energy vacant ligand orbital adjacent to the metal facilitates the reduction of the complex. As demonstrated in the literature, formazanates easily undergo ligand-centered reduction when attached to zinc, iron, and boron.6–8 Numerous elegant studies have corroborated the non-innocent redox nature of formazanates. Exploring the redox-active characteristics of formazan ligands has led to the discovery of new potential applications in coordination chemistry. Formazanate metal complexes are being extensively researched for their potential use in designing molecular magnets, as well as using their redox-active behavior in the field of catalysis.9–11 Formazanate ligand complexes with boron difluoride (BF2) exhibit distinctive optoelectronic properties and have been found to be effective building blocks for multifunctional polymers, electrochemiluminescence emitters, and fluorescent cell imaging agents.12–14
The formazanate ligand has also exhibited non-innocent behavior in complexes with aluminum, copper, iron, ruthenium, and Group 14 elements (Si, Ge, Sn).15,16 A number of rare-earth complexes with various formazanate ligands have also been investigated for their redox properties.17 Various studies have demonstrated catalytic reactivity arising from the redox non-innocence of the formazanate ligand, where a decisive redox step is governed by the ability of the ligand to reversibly store and release electrons. Otten et al. developed a zinc formazanate complex that displays the redox activity of the formazanate ligand employed in catalysis.11 Adhikari et al. reported an iron-formazanate molecule proficient in preparing α-keto amides, where the redox non-innocence of the formazanate ligand governs the catalytic efficiency.18 Over the past two decades, the coordination chemistry of formazans and formazanates has been revitalized due to their facile synthesis and unique properties.19 Our group recently utilized an ionic organotin complex based on formazan to construct a WORM-type memory device.20 In addition, we utilized bis(formazanate) zinc complexes as the active material for constructing memory devices that exhibited non-volatile resistive random access memory (RRAM) characteristics.21,22 As part of our efforts to discover novel and unique properties associated with redox-active formazanate complexes, we present herein the synthesis of formazanate-based iron complexes and the use of their redox-active moiety for the development of electroactive materials for one-compartment hydrogen peroxide fuel cells.
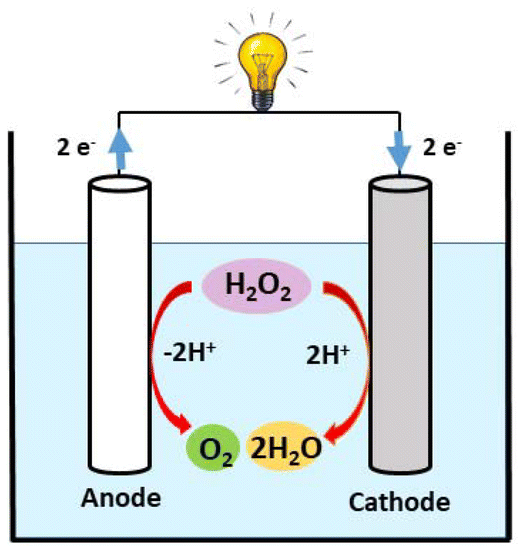
Since hydrogen peroxide (H2O2) is a high-energy-density liquid with dual functionality as both a fuel and an oxidant, single-compartment hydrogen peroxide fuel cells have recently gained prominence as a platform for energy conversion.23–26 These cells generate energy through the exergonic reactions that involve oxidizing hydrogen peroxide to oxygen and reducing hydrogen peroxide to water. The electrochemical conversion of energy contained in hydrogen peroxide into electrical energy can be achieved by performing the following two half-reactions on an anode and a cathode, respectively. Eqn (a) and (b) describe the reactions occurring at the cathode and anode of the H2O2 fuel cell, with eqn (c) representing the total reaction.
Cathode:
| | | H2O2 + 2H+ + 2e− → 2H2O (1.78 V vs. NHE) | (a) |
Anode:
| | | H2O2 → O2 + 2H+ + 2e− (0.682 V vs. NHE) | (b) |
Total:
| | | H2O2 → 2H2O + O2 (1.09 V) | (c) |
In the case where H2O2 is used as both a fuel and an oxidant, the net reaction (eqn (c)) that produces water and oxygen from peroxide has a net potential gain of 1.09 V, which is slightly lower but closer to those of methanol and H2 fuel cells. Compared to methanol and H2 fuel cells, the H2O2 fuel cell has a simpler cell structure that does not necessitate the use of membranes to separate the cathode and anode since H2O2 can be selectively reduced and oxidized using electrodes in a one-compartment H2O2 fuel cell without membranes (Chart 2).27–29 In H2O2 fuel cell chemistry, iron metal ions play a vital role in the electrocatalytic activity of cathode materials.30 For instance, recently, our group reported PLY-based dinuclear Fe3+ complexes, which have been successfully utilized as cathode materials in H2O2 fuel cells.31,32 Yamada et al. reported pyrazine-bridged 2D polynuclear cyanide complexes containing Fe2+ ions as the cathode in one-compartment H2O2 fuel cells, demonstrating the importance of Fe2+ ions for high power density.33 In addition, there is a report of an H2O2 fuel cell that uses an Fe2+-containing [FeII(H2O)2]3[CoIII(CN)6]2 complex as a cathode and whose OCP and power density have been improved by adding Sc3+ ions.34 Yamada et al. also reviewed the significant role of N-bound Fe2+ ions in improving cathodic activity in a single-compartment H2O2 fuel cell.35
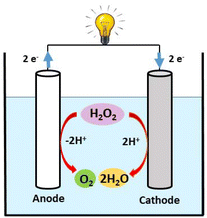 |
| | Chart 2 Schematic representation of a one-compartment fuel cell. | |
In our endeavor to find novel properties attributed to formazanate-based metal complexes, herein, we describe the synthesis and comprehensive (solution and solid-state) characterization of two novel formazan derivatives containing benzothiazole substituents. These derivatives were further used to synthesize two new electroactive iron(II) formazanate complexes [FeII(L1)2] (1) and [FeII(L2)2] (2). Complexes 1 and 2 were additionally employed as the cathode materials in one-compartment H2O2 fuel cells, leading to peak power densities (PPD) of 1.88 mW cm−2 and 3.01 mW cm−2, respectively. The low cost, tuneability, and ready availability of formazanate ligands make them an attractive platform for developing redox-active systems, without being restricted to metal ions as sites of oxidation and reduction, and, as a result, they may be more widely applicable to other electrocatalytic applications as well.
Results and discussion
Synthesis and characterization of hetarylformazans
Formazan ligand L1H was synthesized by condensing 2-hydrazinobenzothiazole with 1-pyrene carboxaldehyde, resulting in the formation of the desired hydrazone. Coupling of in situ generated hydrazone with an appropriate aryl diazonium chloride salt of aniline in the presence of NaOH produced an intensely colored reaction mixture, from which the desired formazan was isolated in moderate yield (Scheme 1). Formazan ligand L2H was synthesized by following the reported procedure and was fully characterized.22 This modular synthetic procedure allows the synthesis of several different substitution patterns comprising various asymmetric derivatives. Formazan derivative L1H exhibits clear 1H and 13C NMR spectroscopic features, revealing diagnostic formazan NH shifts in the 1H NMR spectra at 10.81 ppm, consistent with equivalent aromatic groups in both 1H and 13C NMR spectra (Fig. S9 and S10†). Further characterization studies of the ligand were carried out using UV-Vis, FT-IR spectroscopy, and mass spectrometry (see the ESI†). The identification of N–H weak bands in the FTIR spectrum at a wavelength of 3452 cm−1 for L1H suggests the presence of intramolecular hydrogen bonding within the formazan molecules (Fig. S1†). The presence of strong bands at 1446 cm−1 for L1H indicates the presence of the –N![[double bond, length as m-dash]](https://www.rsc.org/images/entities/char_e001.gif) N– group. Additionally, distinct CN stretching bands in formazans are observed at 1596 cm−1 for L1H, which aligns well with the earlier reported FTIR values.36 HRMS studies of L1H showed the presence of a molecular ion peak at m/z 482.1441 (Fig. S2†).
N– group. Additionally, distinct CN stretching bands in formazans are observed at 1596 cm−1 for L1H, which aligns well with the earlier reported FTIR values.36 HRMS studies of L1H showed the presence of a molecular ion peak at m/z 482.1441 (Fig. S2†).
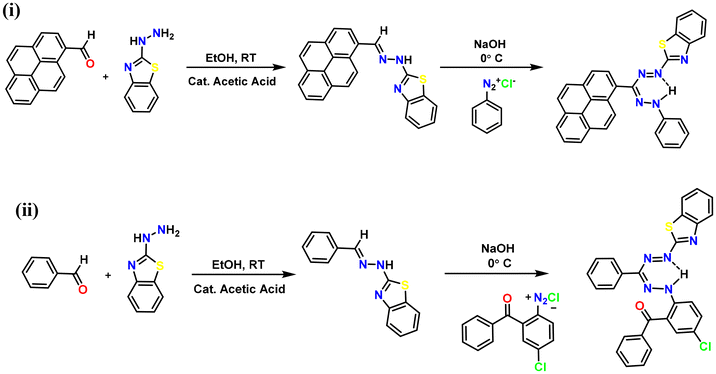 |
| | Scheme 1 Synthesis of benzothiazole-substituted formazans: (i) L1H and (ii) L2H. | |
Synthesis and characterization of bis(formazanate) iron complexes 1 and 2
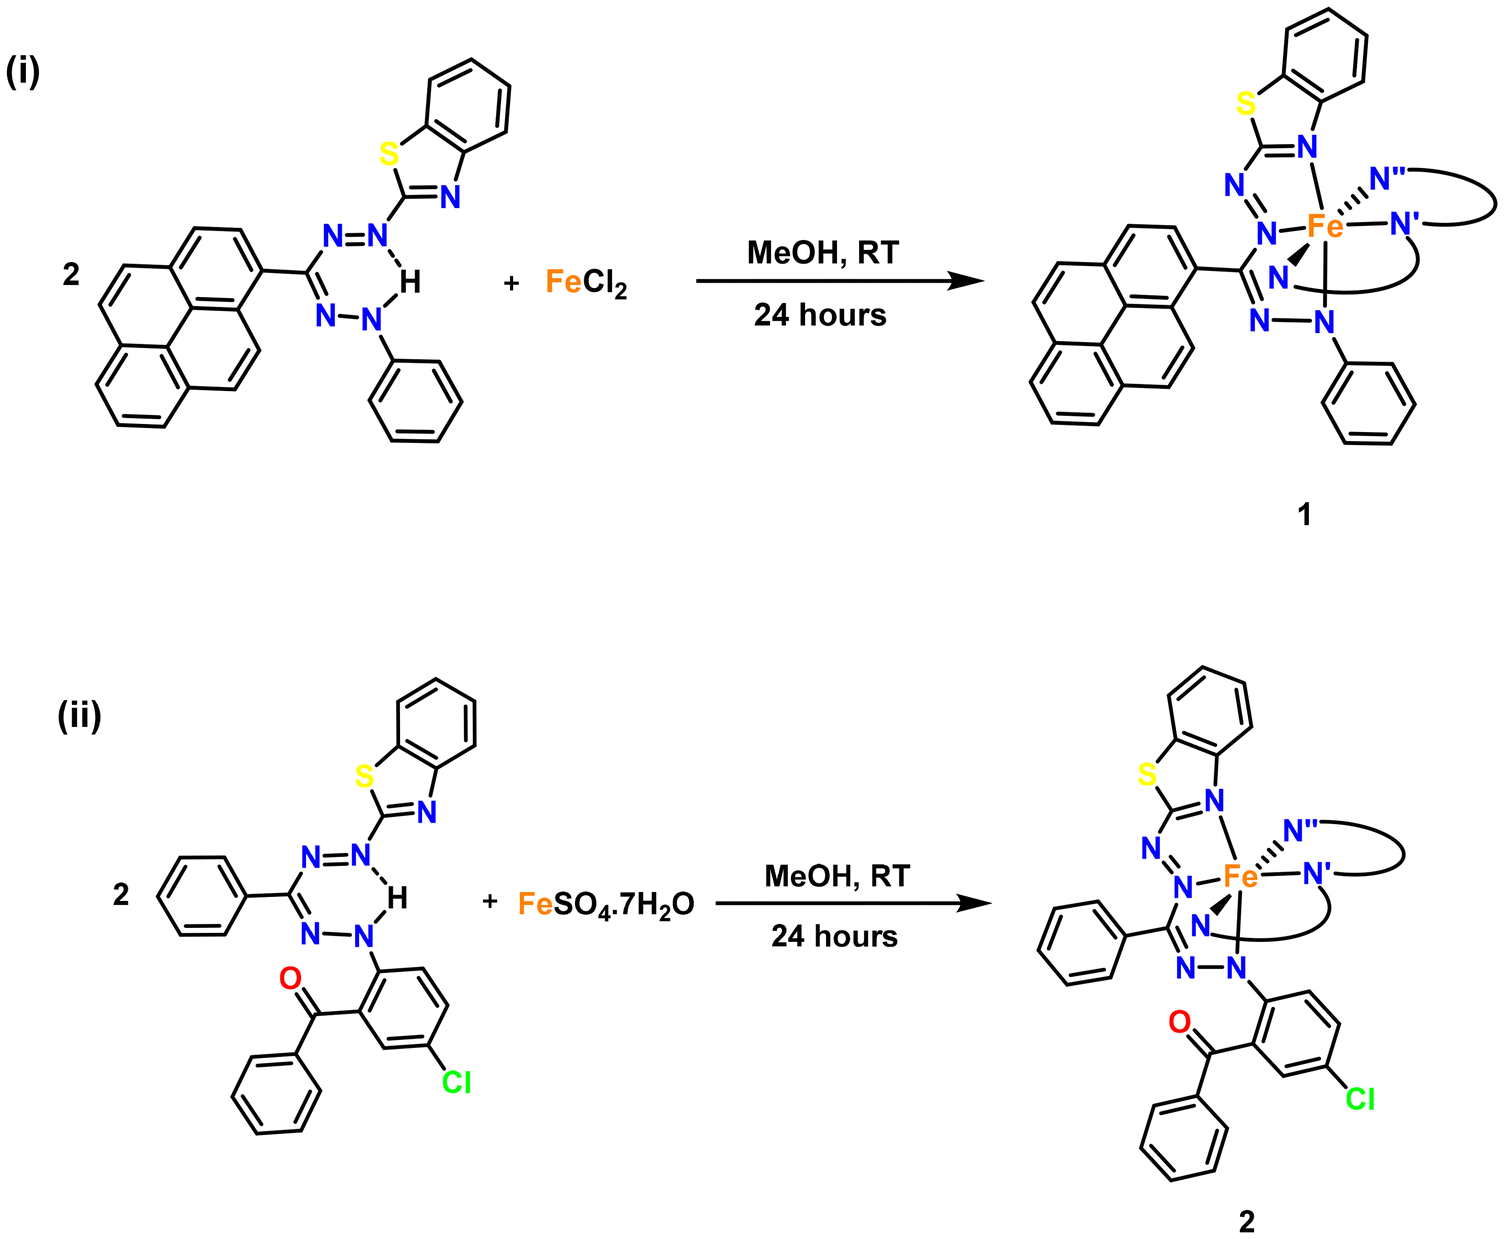
The reactions of the corresponding hetarylformazans L1H and L2H with iron(II) chloride and iron(II) sulfate heptahydrate in methanol at room temperature for 24 h produce discrete bis(formazanate) iron complexes 1 and 2, respectively (Scheme 2). The molecular structure of both the iron(II) complexes was confirmed using the single-crystal XRD technique. Complexes 1 and 2 were isolated with purified yields of 74% and 67%, respectively, and characterized using 1H, 13C{1H}, UV–vis absorption and FT-IR spectroscopy, cyclic voltammetry, thermogravimetric analysis, elemental analysis, XPS and mass spectrometry (see the ESI†). The formation of the iron(II) formazanates, 1 and 2, was observed by an immediate color change from red to dark brown and dark purple, respectively. The reaction in both cases involves the loss of NH protons from the ligand and the subsequent coordination of the Fe(II) center with two deprotonated ligand molecules. This coordination is indicated by the absence of NH peaks in the 1H NMR spectra of both complexes, in contrast to the presence of NH peaks in the 1H NMR spectra of the ligands (Fig. S9–S14†).22 The absence of N–H weak bands in the FTIR spectra at the wavelengths of 3452 cm−1 for 1 and 3444 cm−1 for 2 also indicates that the ligands coordinate to the metal in their anionic form (Fig. S1†). HRMS studies of 1 and 2 showed the presence of the respective molecular ion peaks at m/z 1017.2043 and 1045.2566 (Fig. S3 and S4†). Thermogravimetric analysis (TGA) has shown that complex 1 is stable up to 294 °C, while complex 2 remains stable up to 260 °C (Fig. S8†). XPS analysis demonstrates that the Fe-centers in both complexes 1 and 2 are in the +2 oxidation state. The binding energies (BEs) for the Fe 2p3/2 and Fe 2p1/2 spin components are found to be 719.6 and 706.8 eV, respectively, from the Fe 2p XPS spectrum of complex 1 (Fig. S7†). Meanwhile, for complex 2, the binding energies for Fe 2p3/2 and Fe 2p1/2 are found to be 719.85 and 707.1 eV, respectively (Fig. S7†). These values are characteristic of Fe(II) centres present in both complexes.
 |
| | Scheme 2 Synthesis of bis(formazanate) iron complexes: (i) 1 and (ii) 2 (only one ligand shown in full, the others are abbreviated (N, N′, N′′) for clarity). | |
X-ray crystallography
The dark brown single crystals of 1 were prepared using a slow evaporation method, whereas the dark purple single crystals of 2 were grown using the vapor diffusion method. Single-crystal X-ray diffraction (SCXRD) analyses revealed that both of these compounds possess the same coordination structure, where the FeII metal center is chelated by six N atoms from the benzothiazole-substituted formazan ligands to form a pseudo-octahedral structure, with the FeN6 coordination sphere involving the N1 and N3 nitrogen atoms of the formazanate scaffold and the N5 heterocyclic nitrogen of each of the two formazan molecules, resulting in four fused CN3Fe five-membered rings (Fig. 1). The crystal of 1 belongs to a triclinic P![[1 with combining macron]](https://www.rsc.org/images/entities/char_0031_0304.gif) space group with two CH2Cl2 solvent molecules per unit cell, whereas no solvent molecules were found in the crystal of compound 2, which crystallized in the monoclinic P21/n space group with four molecules per unit cell. The crystal structure refinement parameters of both complexes 1 and 2 are listed in Table S1 (ESI).† The single-crystal structural analyses revealed that the Fe–N bond lengths within the coordination octahedron differ, even though all its vertices are occupied by nitrogen atoms; they can be divided into three groups, each with two bonds. The two shortest Fe–N bond lengths are 1.884 Å each for 1 and 1.887 and 1.895 Å for 2, formed by the N3 and N8 atoms, which occupy the opposite positions, suggesting that the octahedron is compressed along the N3⋯N8 axis. The intermediate Fe–N bond lengths for 1 are 1.933 and 1.942 Å, formed with the N6 and N1 atoms, whereas for 2, these are 1.963 and 1.977 Å, formed with the N1 and N6 atoms, respectively. The Fe atoms are most distant from the N5 and N10 atoms, having bond distances of 1.996 and 1.991 Å, respectively, in 1, while the bond distances are 2.002 and 2.007 Å in 2. The Fe–N bond lengths in these complexes are comparable to those in the reported octahedral Fe(II) complexes.37–39 The selected bond distances and bond angles of these complexes are summarized in Table 1. Equivalent intraligand C–N and N–N bond lengths indicate full charge delocalization on the NNCNN ligand backbone in both complexes. In both cases, the formazan ligands occupy planes that are almost perpendicular to each other. For example, in 1, the N1–Fe01–N5 angle is 156.24°, showing a deviation of 23.78° from 180°, whilst in 2, the N1–Fe1–N5 angle is 157.11°, indicating a deviation of 22.89° from 180°. Because of the bulky substituents, these distortions arise from the ideal octahedral coordination geometry. The angle between the formazanate coordination planes for 1 is 83.271°, whereas for 2, it is increased to 86.661°.
space group with two CH2Cl2 solvent molecules per unit cell, whereas no solvent molecules were found in the crystal of compound 2, which crystallized in the monoclinic P21/n space group with four molecules per unit cell. The crystal structure refinement parameters of both complexes 1 and 2 are listed in Table S1 (ESI).† The single-crystal structural analyses revealed that the Fe–N bond lengths within the coordination octahedron differ, even though all its vertices are occupied by nitrogen atoms; they can be divided into three groups, each with two bonds. The two shortest Fe–N bond lengths are 1.884 Å each for 1 and 1.887 and 1.895 Å for 2, formed by the N3 and N8 atoms, which occupy the opposite positions, suggesting that the octahedron is compressed along the N3⋯N8 axis. The intermediate Fe–N bond lengths for 1 are 1.933 and 1.942 Å, formed with the N6 and N1 atoms, whereas for 2, these are 1.963 and 1.977 Å, formed with the N1 and N6 atoms, respectively. The Fe atoms are most distant from the N5 and N10 atoms, having bond distances of 1.996 and 1.991 Å, respectively, in 1, while the bond distances are 2.002 and 2.007 Å in 2. The Fe–N bond lengths in these complexes are comparable to those in the reported octahedral Fe(II) complexes.37–39 The selected bond distances and bond angles of these complexes are summarized in Table 1. Equivalent intraligand C–N and N–N bond lengths indicate full charge delocalization on the NNCNN ligand backbone in both complexes. In both cases, the formazan ligands occupy planes that are almost perpendicular to each other. For example, in 1, the N1–Fe01–N5 angle is 156.24°, showing a deviation of 23.78° from 180°, whilst in 2, the N1–Fe1–N5 angle is 157.11°, indicating a deviation of 22.89° from 180°. Because of the bulky substituents, these distortions arise from the ideal octahedral coordination geometry. The angle between the formazanate coordination planes for 1 is 83.271°, whereas for 2, it is increased to 86.661°.
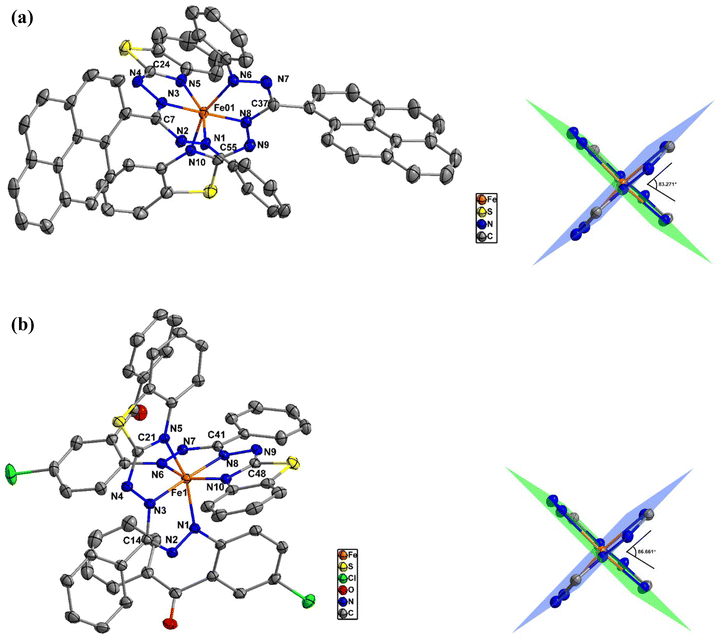 |
| | Fig. 1 (a) (Left) Molecular structure of 1 showing 50% probability ellipsoids. The solvent molecules and hydrogen atoms are omitted for clarity. (Right) The Fe(NNCNNCN)2 core of the structure with the N–Fe–N planes and the dihedral angle. (b) (Left) Molecular structure of 2 showing 50% probability ellipsoids. The solvent molecules and hydrogen atoms are omitted for clarity. (Right) The Fe(NNCNNCN)2 core of the structure with the N–Fe–N planes and the dihedral angle. | |
Table 1 Selected bond distances (Å) and selected bond angles (°) for 1 and 2
| |
1
|
|
2
|
| N1–N2 |
1.303(48) |
N1–N2 |
1.304(23) |
| N2–C7 |
1.360(36) |
N2–C14 |
1.356(23) |
| C7–N3 |
1.334(50) |
C14–N3 |
1.347(22) |
| N3–N4 |
1.351(37) |
N3–N4 |
1.348(20) |
| N4–C24 |
1.346(57) |
N4–C21 |
1.346(23) |
| C24–N5 |
1.340(53) |
C21–N5 |
1.331(25) |
| Fe01–N1 |
1.942(31) |
Fe1–N1 |
1.963(14) |
| Fe01–N3 |
1.884(32) |
Fe1–N3 |
1.895(17) |
| Fe01–N5 |
1.996(29) |
Fe1–N5 |
2.002(14) |
| N1–Fe01–N3 |
78.26(124) |
N1–Fe1–N3 |
78.31(71) |
| N3–Fe01–N5 |
78.72(120) |
N3–Fe1–N5 |
78.97(67) |
| N6–Fe01–N8 |
78.64(118) |
N6–Fe1–N8 |
78.11(69) |
| N8–Fe01–N10 |
78.38(124) |
N8–Fe1–N10 |
78.98(66) |
| N1–Fe01–N5 |
156.24(116) |
N1–Fe1–N5 |
157.11(69) |
| N3–Fe01–N8 |
177.73(134) |
N3–Fe1–N8 |
177.55(74) |
| N6–Fe01–N10 |
157.01(112) |
N6–Fe1–N10 |
156.23(67) |
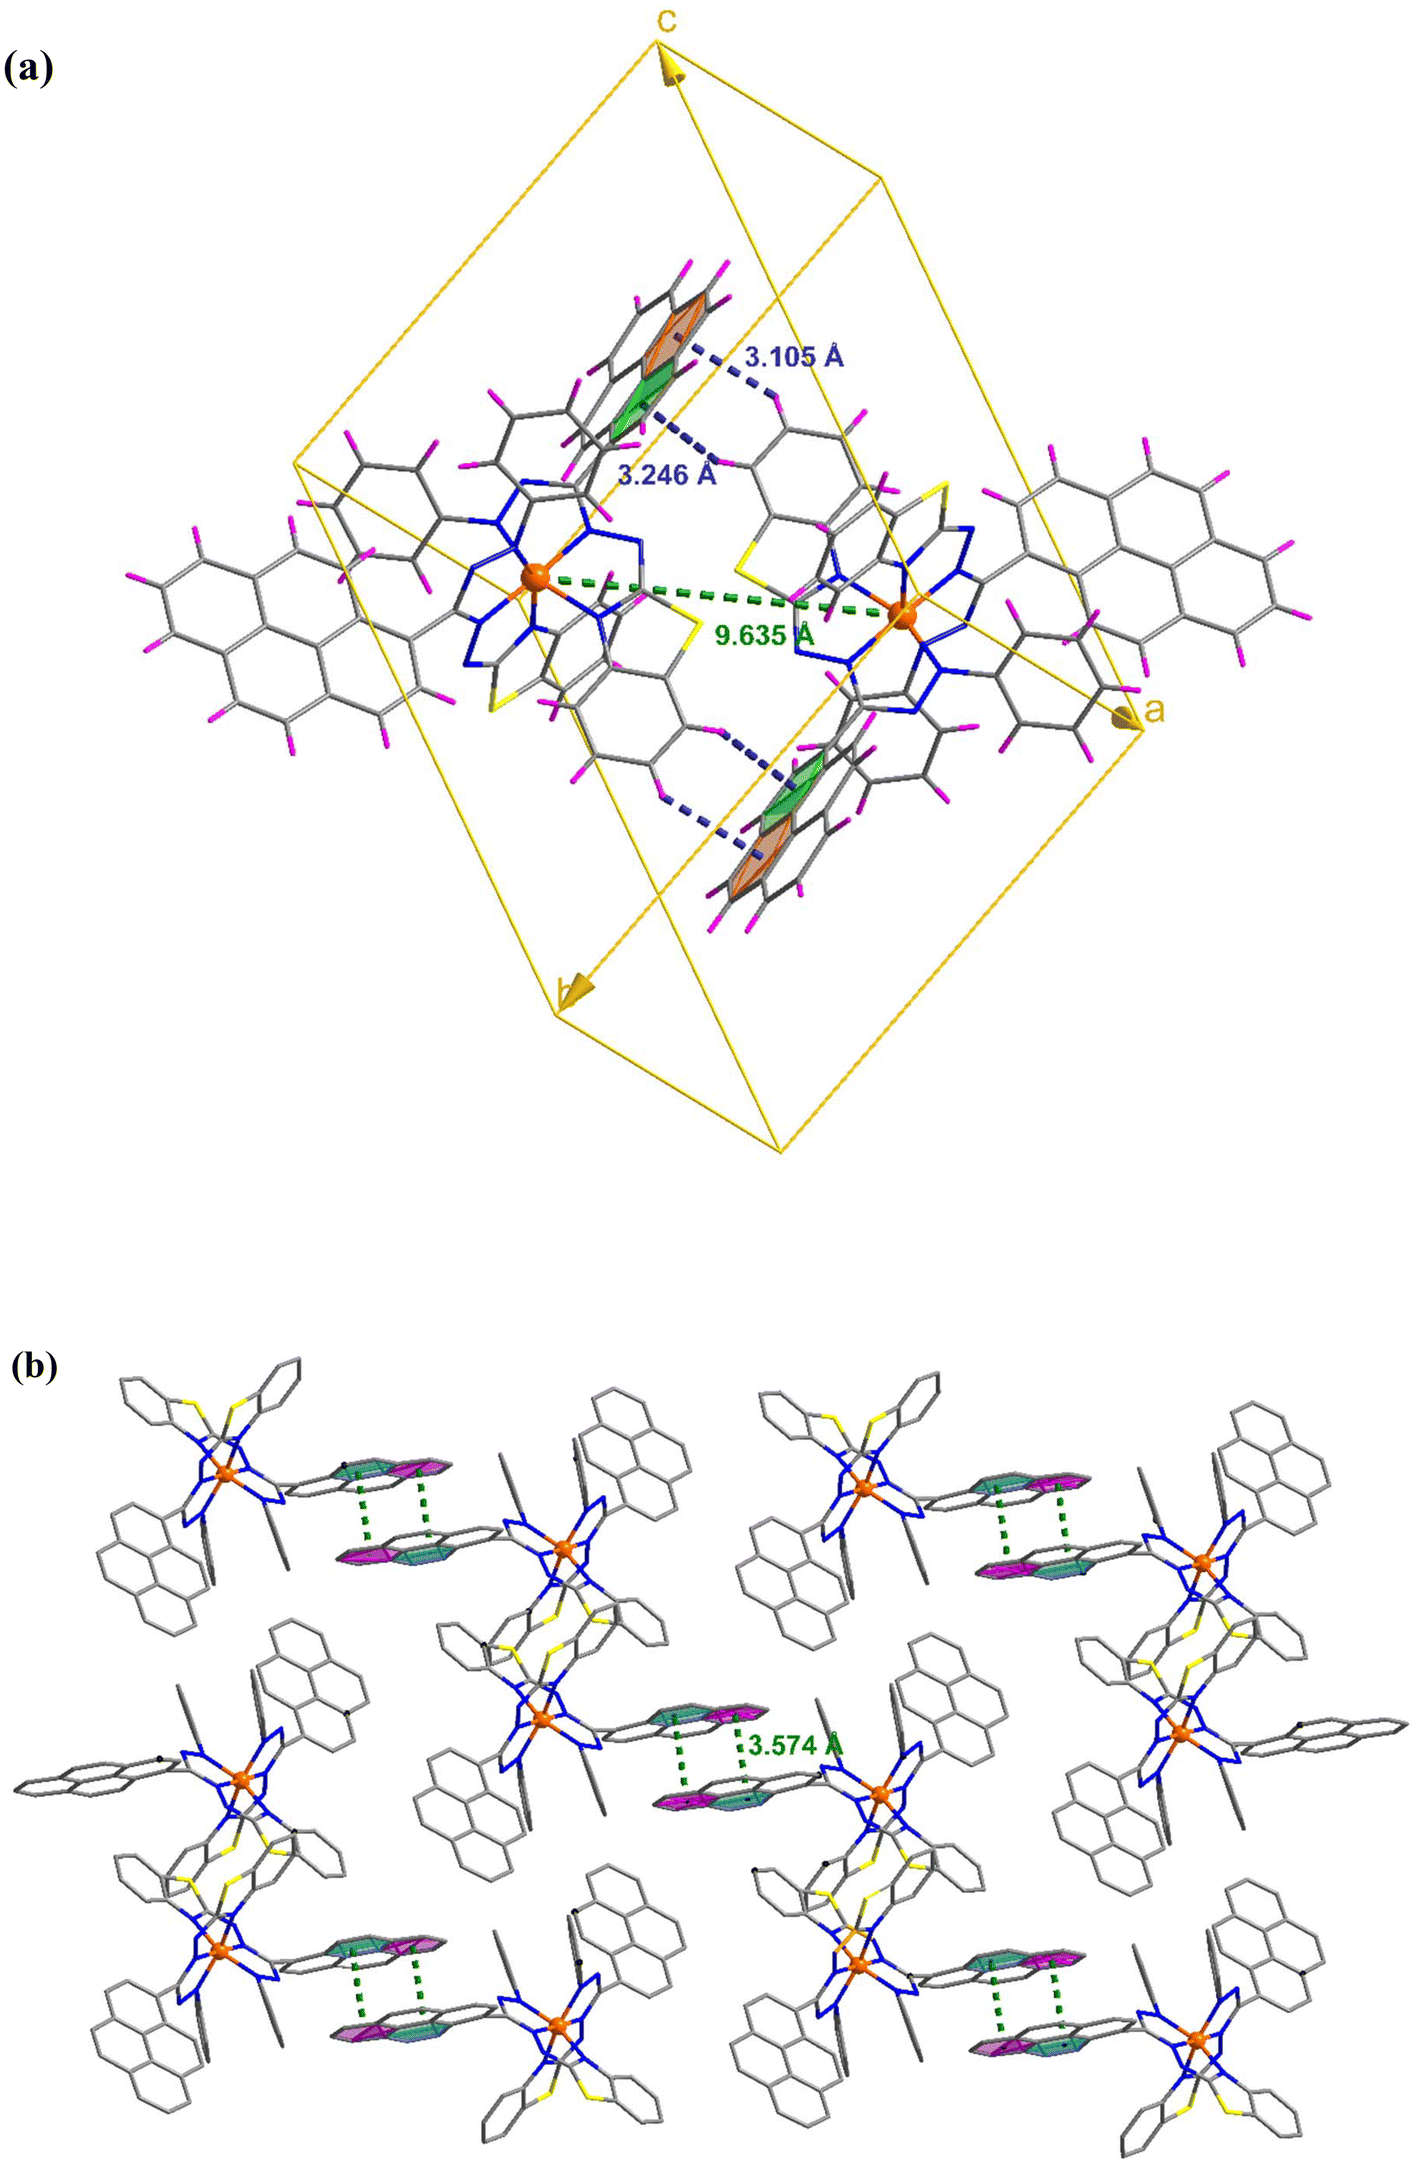
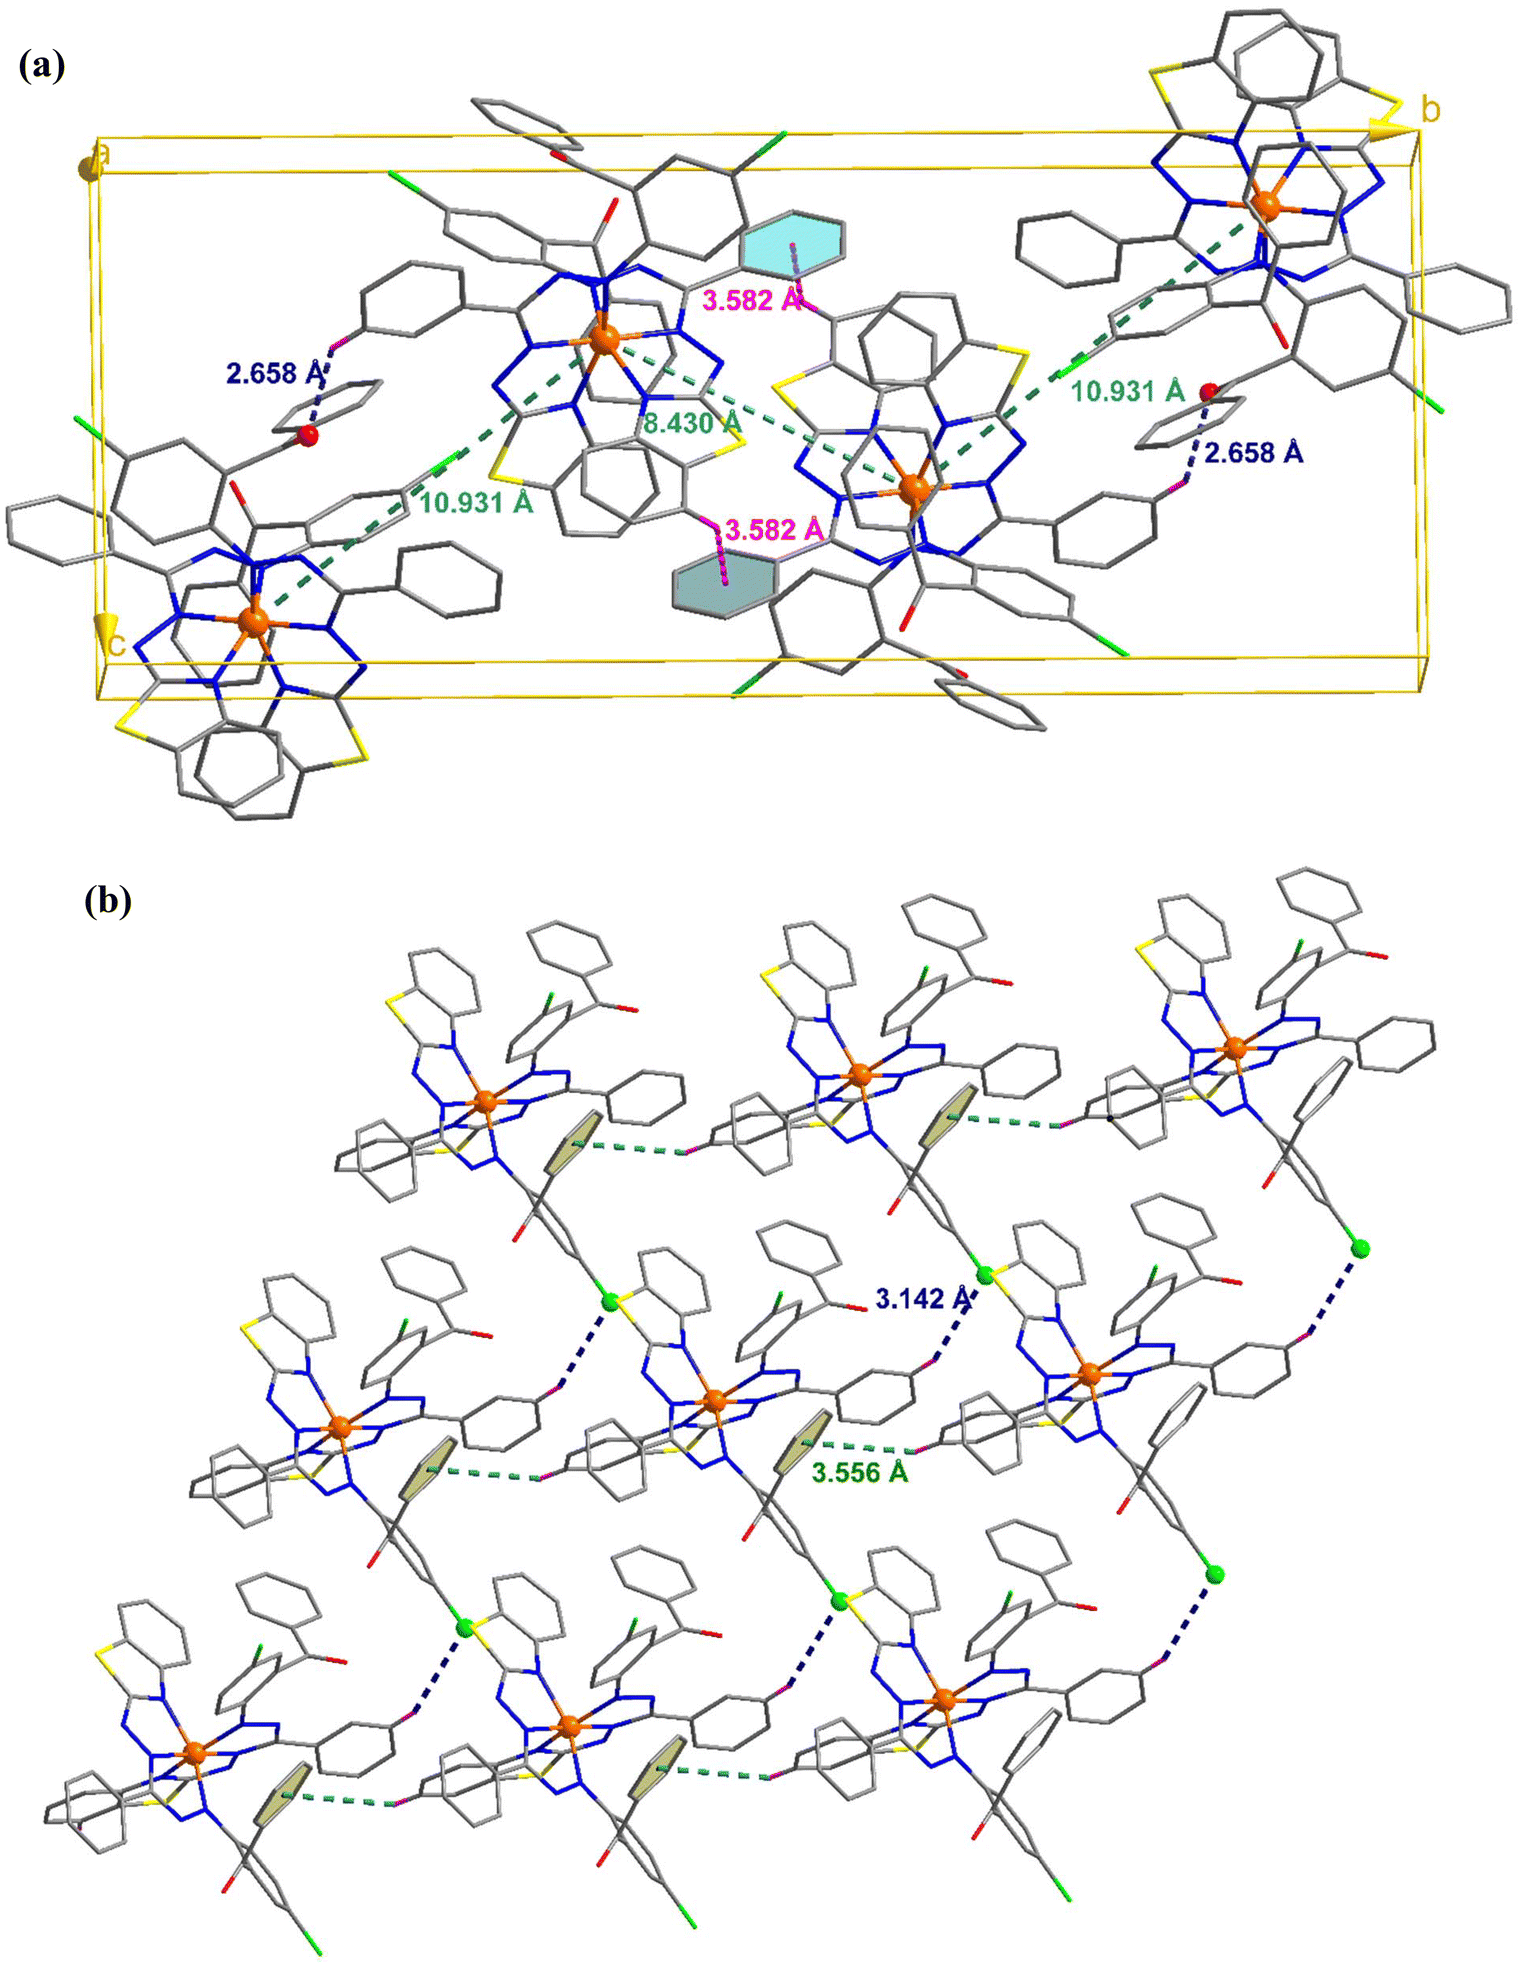
C–H⋯π and π⋯π interactions coalesce to form a three-dimensional network in the molecular packing of complex 1 (Fig. 2). Complex 1 contains two molecules per unit cell, as depicted in Fig. 2(a), where the adjacent Fe⋯Fe distance is 9.635 Å, and C–H⋯π interactions exist between them. In addition, the molecule interacts with its neighbors via interactions between two pyrene groups separated by centroid distances of 3.574 Å [Fig. 2(b)]. Four molecules constitute the unit cell in complex 2, where the separations between the iron atoms are 8.430 and 10.931 Å, and they interact with each other via C–H⋯π and C–H⋯O interactions [Fig. 3(a)]. Additionally, CH⋯π and CH⋯Cl interactions result in the formation of a supramolecular assembly in complex 2 [Fig. 3(b)].
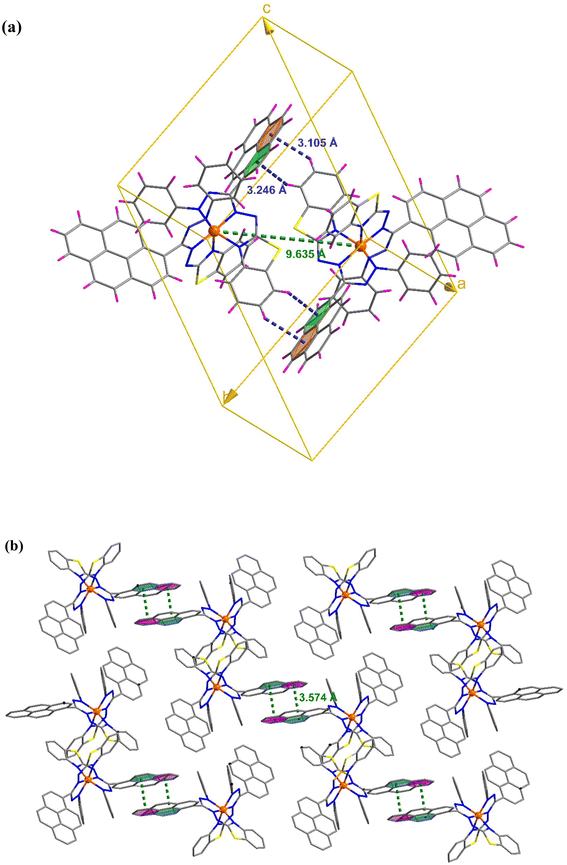 |
| | Fig. 2 (a) Unit cell of complex 1 showing the C–H⋯π interactions. (b) Crystal packing mode for complex 1 displaying π⋯π interactions. | |
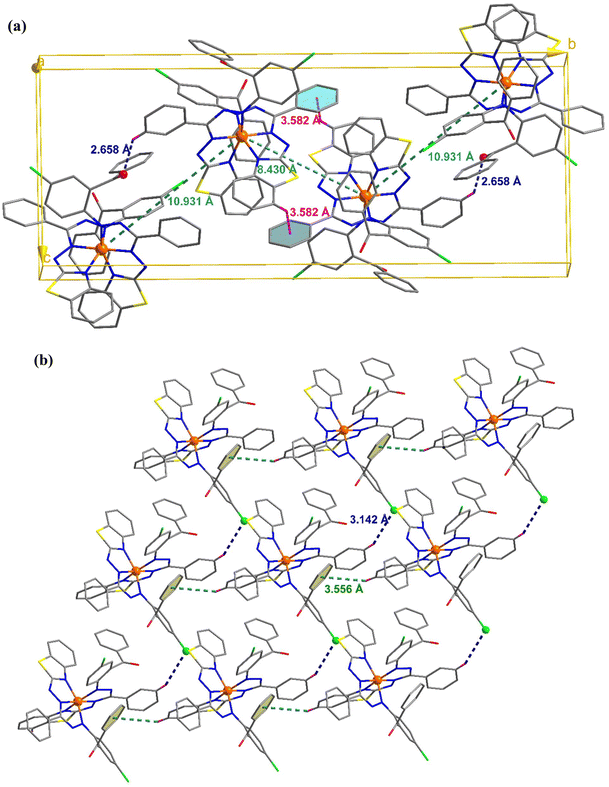 |
| | Fig. 3 (a) Unit cell of complex 2 showing the C–H⋯O and C–H⋯π interactions. (b) Crystal packing mode for complex 2 displaying C–H⋯Cl and C–H⋯π interactions. | |
Electronic spectra
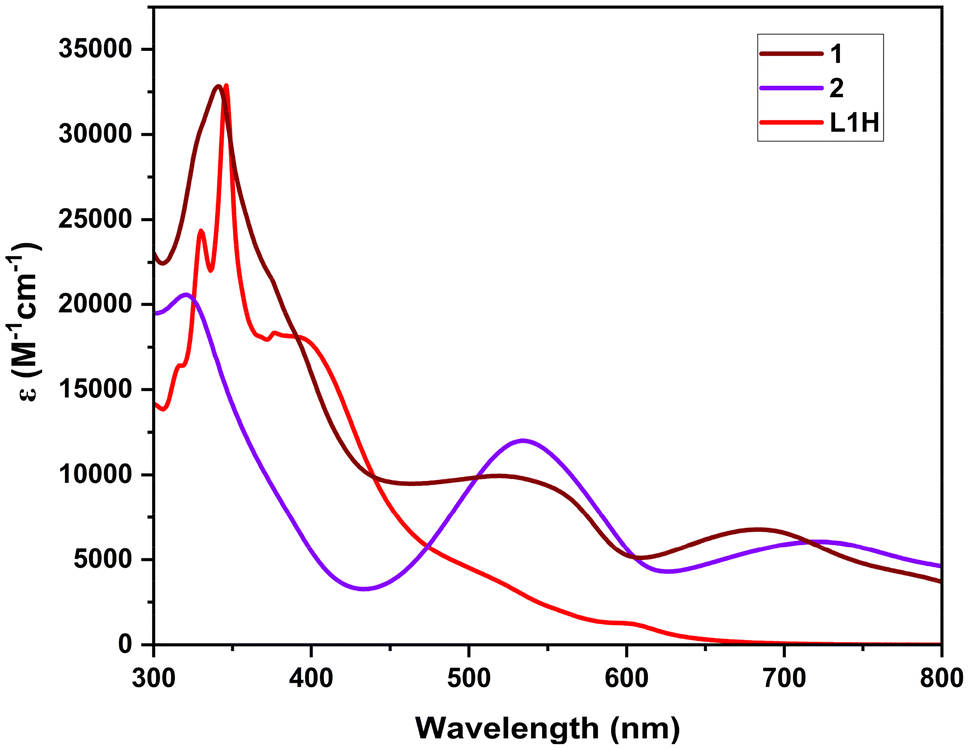
The optical properties of the free ligands and the Fe(II) complexes were measured by UV–vis absorption spectroscopy of the compounds in chloroform solution in the range of 200–800 nm (Fig. 4). It is found that the free ligands exhibit a broad, intense band in the 400–550 nm region corresponding to a π–π* transition of the conjugated system in the formazan NNCNN backbone. For ligand L1H, this absorption band is observed at 402 nm (ε = 17![[thin space (1/6-em)]](https://www.rsc.org/images/entities/char_2009.gif) 667 M−1 cm−1). For complex 1, complexation with Fe(II) results in the appearance of a band at 546 nm (ε = 9528 M−1 cm−1), while for complex 2, the band is observed at 543 nm (ε = 11500 M−1 cm−1), which is typical of electronic transitions localized within the formazanate ligand framework.22,40,41 A second intense band, centered at 692 nm (ε = 6791 M−1 cm−1) and 729 nm (ε = 6100 M−1 cm−1) for complex 1 and complex 2, respectively, is tentatively assigned to a metal-to-ligand charge transfer (MLCT) transition. These bands are observed in the corresponding reported Fe(II) bis-formazanate octahedral complexes.37,39 In particular, it is interesting that the Fe center electronically combines the two perpendicular π electron systems of the rings. The DFT computed absorption spectra of complex 1 and the respective electronic transitions involved are shown in Fig. S26 and S27.†
667 M−1 cm−1). For complex 1, complexation with Fe(II) results in the appearance of a band at 546 nm (ε = 9528 M−1 cm−1), while for complex 2, the band is observed at 543 nm (ε = 11500 M−1 cm−1), which is typical of electronic transitions localized within the formazanate ligand framework.22,40,41 A second intense band, centered at 692 nm (ε = 6791 M−1 cm−1) and 729 nm (ε = 6100 M−1 cm−1) for complex 1 and complex 2, respectively, is tentatively assigned to a metal-to-ligand charge transfer (MLCT) transition. These bands are observed in the corresponding reported Fe(II) bis-formazanate octahedral complexes.37,39 In particular, it is interesting that the Fe center electronically combines the two perpendicular π electron systems of the rings. The DFT computed absorption spectra of complex 1 and the respective electronic transitions involved are shown in Fig. S26 and S27.†
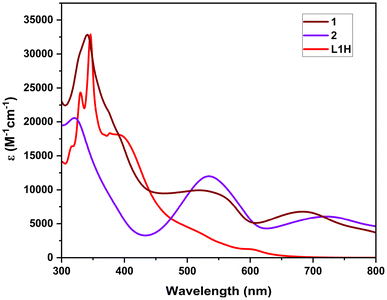 |
| | Fig. 4 Absorption spectra of L1H, 1, and 2 in CHCl3. | |
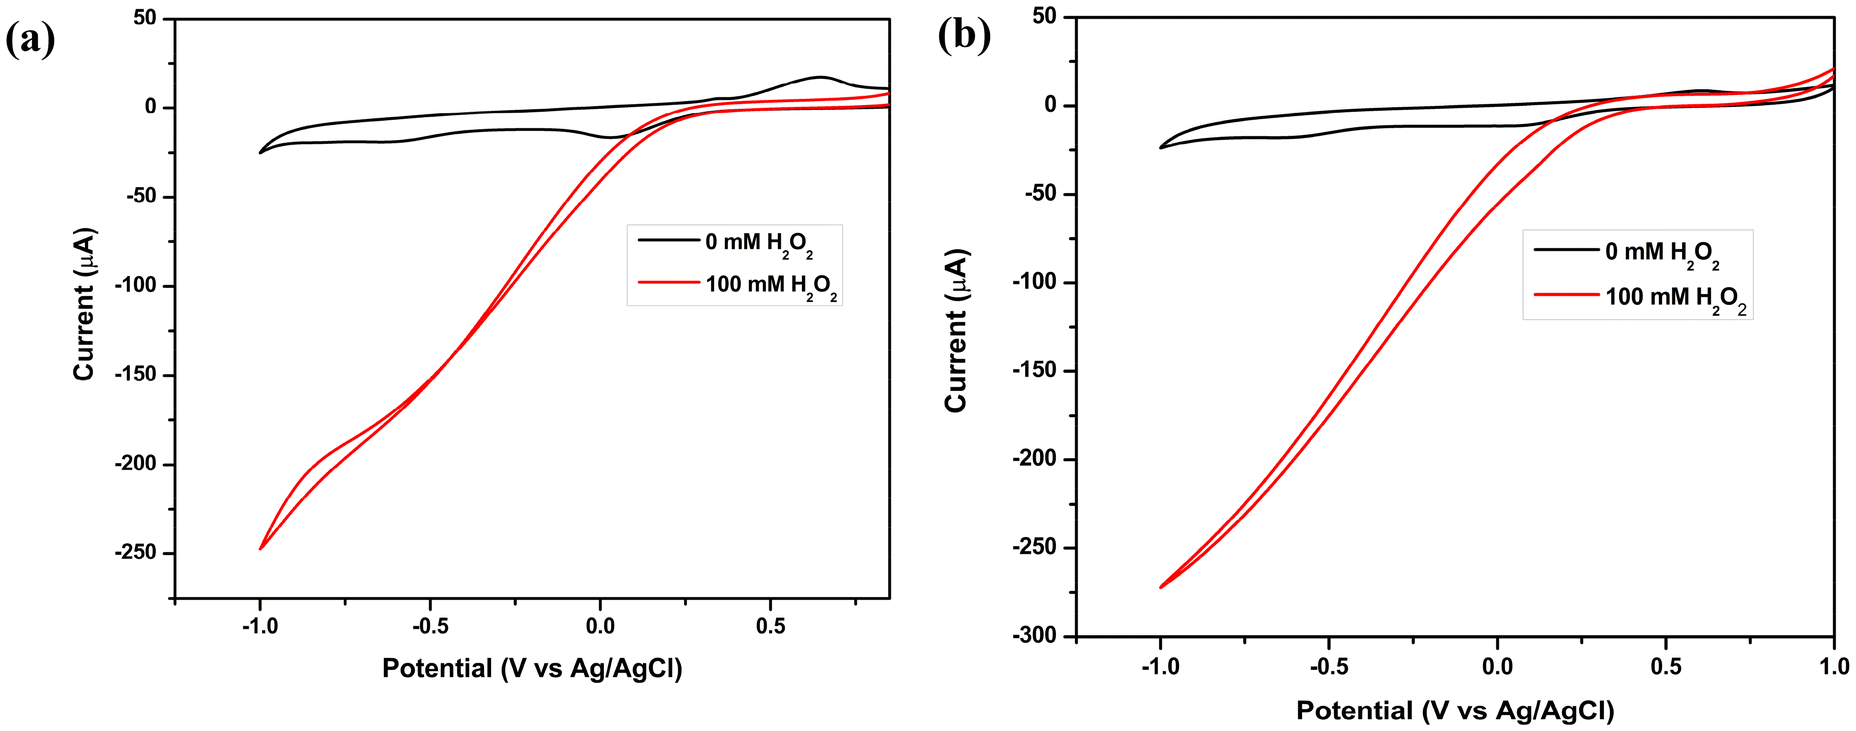
Electrocatalytic reduction of H2O2
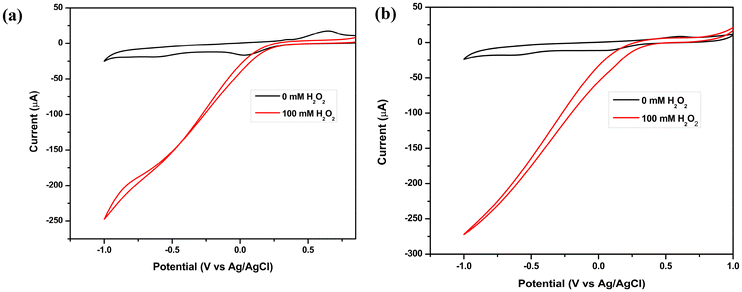
Cyclic voltammograms of 0.1 M H2O2 in an acetate buffer (pH 3) solution were recorded to determine if electrocatalytic reduction of H2O2 with a glassy carbon (GC) electrode modified with iron(II) complexes 1 and 2 was feasible. The Experimental section contains a description of the electrode preparation. In addition, a CV (black) of iron complexes 1 and 2 in an acetate buffer solution without H2O2 is included as a reference, as shown in Fig. 5. A quasi-reversible redox couple was observed for both 1 and 2 when H2O2 was absent, which is assigned to Fe2+/Fe3+. Catalytic currents for H2O2 reduction are absent in the cathodic sweep when H2O2 is not present, whereas, in the presence of H2O2, complexes 1 and 2 showed significant catalytic currents of 250 μA and 275 μA, respectively, for H2O2 reduction in acetate buffer (pH = 3) at onset potentials of 0.35 V and 0.45 V (vs. Ag/AgCl, 3.0 M KCl), respectively, indicating that complexes 1 and 2 exhibit electrocatalytic properties. At the same time, the cyclic voltammograms of 0.1 M H2O2 in acidic electrolytes, namely 0.1 M HCl, 0.1 M H2SO4, and 0.1 M HClO4, under identical conditions, were recorded, as the reduction of H2O2 is contingent upon the active concentration of H+ ions, and these showed a significant increase in the current for 1 and 2, respectively (Fig. S19 and S20†). For both complexes, it can be observed that the value of cathodic current increases to more negative values in the case of the 0.1 M HCl electrolyte than in 0.1 M H2SO4 and 0.1 M HClO4, signifying an improvement in electrochemical H2O2 reduction in HCl. A parallel set of experiments was conducted on a bare GC electrode under identical conditions. However, no catalytic performance was observed in relation to H2O2 reduction.
 |
| | Fig. 5 Cyclic voltammograms of H2O2 in acetate buffer (pH = 3) using a GC electrode modified with (a) 1 and (b) 2 as the working electrode, with an Ag/AgCl electrode as a reference and Pt-wire as a counter electrode at a scan rate of 10 mV s−1. | |
Performance of the one-compartment H2O2 fuel cell
An aqueous solution (0.1 M HCl) containing 0.50 M H2O2 was used to evaluate a one-compartment H2O2 fuel cell performance, using a nickel foam anode and a glassy carbon cathode modified with complexes 1 and 2via a drop-casting method. An electrode of interest should have a lower onset potential for H2O2 oxidation than the onset potential for H2O2 reduction over GC modified with 1 and 2. As a case study, H2O2 oxidation on a nickel electrode (Ni) varies from −0.09 V to 0.05 V at various pH values,24,42 which is much lower than the onset potential for H2O2 reduction with an electrode modified with iron(II) complexes 1 and 2. Thus, in order to implement the fuel cell, Ni foam was selected as the anode. This suggests that Ni foam as an anode and GC modified with iron(II) complexes 1 and 2 as a cathode are suitable for H2O2 fuel cells. An aqueous solution of 0.1 M HCl is the most frequently used electrolyte for this form of one-compartment fuel cell. Preliminary tests indicate that our complexes exhibit improved catalytic current in the presence of 0.1 M HCl. For complex 1, the H2O2 fuel cell operating in a 0.1 M HCl electrolyte exhibited an open-circuit potential of 0.626 V and produced a maximum power density of 0.325 mW cm−2, as shown in Fig. 6a.
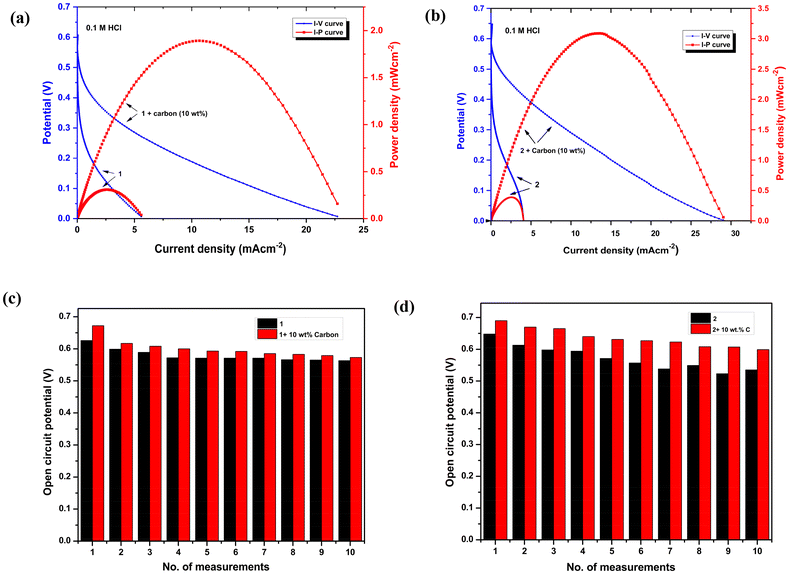 |
| | Fig. 6 Performance test of a single-compartment H2O2 fuel cell showing I–V (blue) and I−P (red) curves using a GC electrode modified with (a) 1 as the cathode and (b) 2 as the cathode and Ni foam as the anode in 0.1 M HCl containing 0.5 M H2O2 at a scan rate 10 mV s−1. The current density is normalized to the exposed geometrical surface area of the GC electrode (0.07 cm−2). The change in open-circuit potential on repetitive measurements for (c) 1 and (d) 2. | |
Furthermore, the conductivity was increased by mixing 10 wt% of carbon in 1 to achieve better results. As a consequence, the OCP increased to 0.67 V, and the power density reached 1.88 mW cm−2 for 1, almost four-fold higher than before (Fig. 6a). The power output did not increase further when the percentage of carbon loading was increased. However, in the case of complex 2, with 0.1 M HCl as the electrolyte, the addition of 0.5 M H2O2 resulted in an OCP of 0.648 V, and the power density achieved was 0.387 mW cm−2. These values were further improved to 0.69 V and 3.08 mW cm−2, respectively, by mixing 10 wt% of carbon in 2 (Fig. 6b). Similarly, in this case of 2, the increase in carbon % did not lead to any additional improvement in power density. Additionally, the fuel cell performance of these complexes was evaluated in 0.1 M H2SO4 and 0.1 M HClO4 electrolytes (see the ESI†). The fuel cells of both the complexes exhibited low OCP values, which in turn led to a very low PPD. Fuel cell performance tests were conducted on both bare GC and GC coated with pristine ligands, both of which demonstrated very poor fuel cell performance (Fig. S16 and S17†). This result highlights the importance of Fe-coordinated ligands in achieving enhanced power density. The fuel cell experiments were also performed with phosphate addition in the 0.1 M HCl electrolyte, as the presence of phosphate ions has been reported to suppress the corrosion of Ni during electrocatalytic reactions by forming Ni phosphate.43 However, no significant changes were observed before and after the addition of phosphate. In the case of complex 1, the power density decreased slightly from 1.88 mW cm−2 to 1.80 mW cm−2, while for complex 2, it decreased slightly from 3.08 mW cm−2 to 2.94 mW cm−2 (Fig. S25†).
The OCP values for 1 and 2 were steadier than those observed in studies without carbon, after an examination of 10 consecutive experiments with 10% carbon (Fig. 6c and d). UV-vis spectroscopy was employed to verify the stability of complexes 1 and 2 following H2O2 fuel cell experiments conducted under optimized conditions (Fig. S18†). Our results have shown improved power density compared to compounds containing N-bound Fe ions, such as Prussian blue, where iron has a valence between +2 and +3, which attained a power density of 1.55 mW cm−2, and Fe3 [{CoIII(CN)6}2] that contains N-bound Fe2+ ions, which achieved a power density of 1.2 mW cm−2.35,42 It is evident from these reports that Fe2+ ions bound to N in the cathode contribute significantly to the high performance of one-compartment H2O2 fuel cells. Table 2 illustrates the significance of Fe(II)- and Fe(III)-based cathode materials reported in the literature for H2O2 reduction.
Table 2 Comparison of the present work with the earlier reported iron-based cathode material for the one-compartment H2O2 fuel cell in acidic medium
| Sr. no. |
Anode |
Cathode |
OCP (V) |
PPD (mW cm−2) |
Ref. |
| 1 |
Ni |
FeII[CoIII(CN)6] |
0.80 |
1 |
35
|
| 2 |
Ni |
Prussian blue |
0.60 |
1.55 |
42
|
| 3 |
Ni |
[FeIII(PLY)3] |
0.74 |
1.53 |
30
|
| 4 |
Ni |
[FeIII2(hmbh-PLY)3] |
0.65 |
2.41 |
31
|
| 5 |
Ni |
[FeIII2(hnmh-PLY)3] |
0.65 |
2.84 |
32
|
| 6 |
Ni |
[FeIIL12] |
0.67 |
1.88 |
This work |
| 7 |
Ni |
[FeIIL22] |
0.69 |
3.08 |
This work |
Cyclic voltammetry (CV), DFT studies and the proposed mechanism
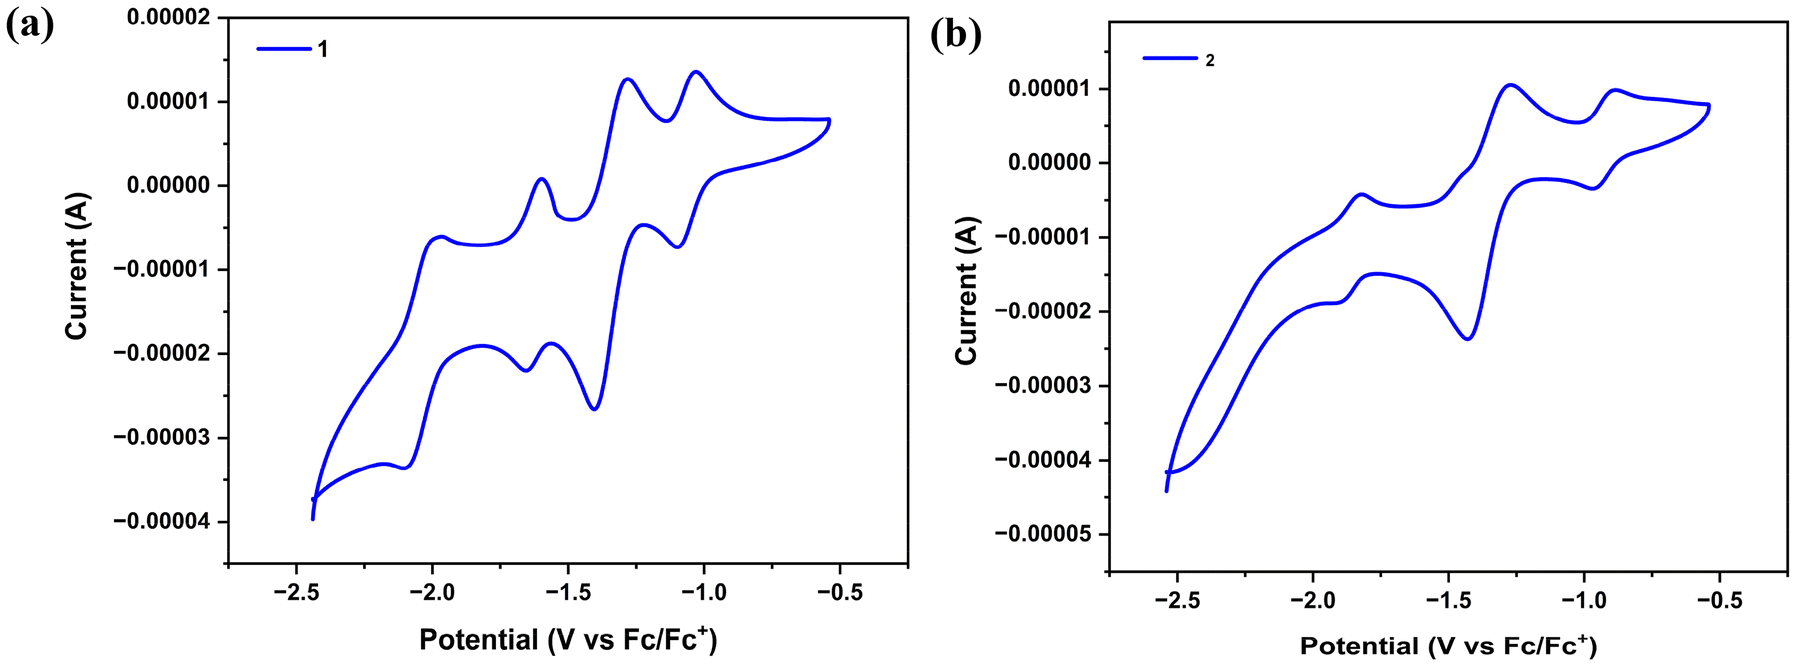
In order to understand the electron transfer process operating within 1 and 2, we conducted cyclic voltammetric experiments. Formazanate ligands have been shown to be reversibly reduced to their radical anion and diradical dianion in previous studies. As shown in Fig. S15,† in cyclic voltammograms of L1H, three ligand-based quasi-reversible reduction peaks were observed during the cathodic sweep at E1/21 = −1.42 V (ΔE = 70 mV), E1/22 = −1.93 V (ΔE = 80 mV), and E1/23 = −2.16 V (ΔE = 90 mV) (versus Fc/Fc+), whereas for L2H, two ligand-based quasi-reversible reduction peaks were observed during the cathodic sweep at E1/21 = −1.43 V (ΔE = 70 mV) and E1/22 = −1.93 V (ΔE = 120 mV). Recent reports suggest that a single formazanate ligand in (formazanate)BF2 and (formazanate)2Zn compounds undergoes two electron reductions to give L3− type structures.7,44 In the cyclic voltammograms of 1, a quasi-reversible reduction was observed during the cathodic sweep at E1/21 = −1.10 V (ΔEp = 70 mV), which can be assigned to the FeI/II redox couple,45–49 as it is absent in the cyclic voltammogram of L1H, followed by three ligand-based quasi-reversible reductions at E1/22 = −1.41 V (ΔEp = 131 mV), E1/23 = −1.66 V (ΔEp = 60 mV), and E1/24 = −2.10 V (ΔEp = 113 mV) (versus Fc/Fc+) (Fig. 7a). However, in the case of 2, a quasi-reversible reduction was observed during the cathodic sweep at E1/21 = −0.96 V (ΔEp = 69 mV), assigned to the FeI/II redox couple,45 followed by two ligand-based quasi-reversible reductions at E1/22 = −1.42 V (ΔEp = 144 mV) and E1/23 = −1.91 V (ΔEp = 90 mV) (versus Fc/Fc+) (Fig. 7b). Also, it can be seen that the first reduction peak E1/21 = −0.96 V (ΔEp = 69 mV) observed in the case of complex 2 is not observed in the cyclic voltammogram of L2H.
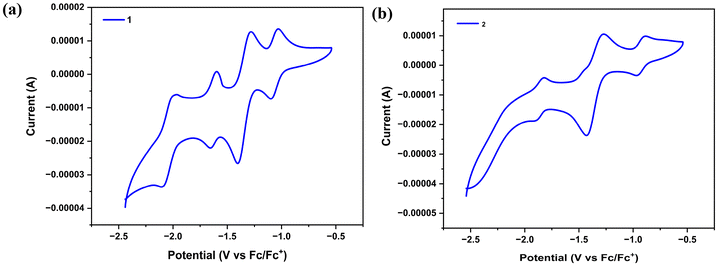 |
| | Fig. 7 Cyclic voltammograms of complexes 1 and 2 (1.5 mM solution of iron complexes in DMF; 0.1 M [Bu4N][PF6] electrolyte; scan rate = 10 mV s−1) acquired using a Pt working electrode, a Pt-wire counter electrode, and an Ag/AgCl (3.0 M KCl) reference electrode. | |
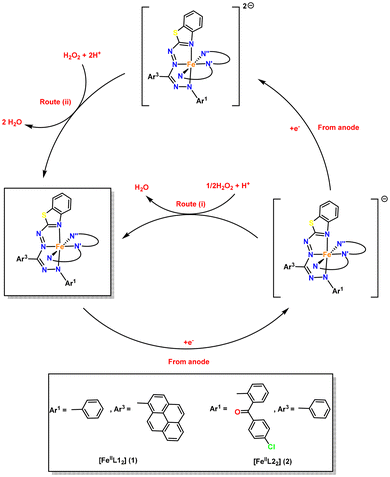
Some groups have documented the direct involvement of redox-active ligands in the reduction of H2O2 for a molecular cathode constructed from iron-based complexes.30,32 The mechanism of the H2O2 fuel cell, which utilizes complexes 1 and 2 as the cathode and Ni foam as the anode, can be understood by referring to Fig. 8. As previously stated, the anode facilitates the oxidation of H2O2, resulting in the generation of electrons and H+ ions that migrate towards the cathode. The electrons generated are carried by the high potential (open-circuit potential) between the electrodes, and they then traverse the circuit to reach bis(formazanate) iron(II) complexes, [FeIIL2] (L = L1, 1; L2, 2), and undergo reduction to become 1− or 2−. The complexes 1−1 or 2−1 facilitate the transfer of electrons to H2O2, and this reaction, in the presence of H+ ions, leads to the production of H2O (by route i) and also allows for the regeneration of the catalyst 1 or 2. The route (i) can thus be seen as a broad approach operating through the Fe(II)/Fe(I) oxidation–reduction process. The reduction described in route (i) involves two separate one-electron reduction events, requiring two molecules of 1− or 2−. Alternatively, we can consider the one-step two-electron reduction of H2O2, as demonstrated in route (ii). This approach involves the formation of a two-electron reduced species 12− or 22−, which is supported by our CV results. This pathway for the reaction is effective only if the ligands coordinated to the metal have the capacity to store electrons, which is feasible in the case of complexes 1 and 2.
 |
| | Fig. 8 Plausible mechanism for the electrocatalytic reduction of H2O2 with complexes 1 and 2 employed as the cathode. | |
Thus, in the catalytic cycle, complexes 1 and 2, consisting of formazanate ligands, have the ability to receive two electrons and transform into dianionic species. Furthermore, complex 12− or 22− can participate in the reduction process of H2O2 by transferring two electrons and regenerating 1 or 2 by route (ii). Therefore, complexes 1 and 2 have the ability to function through both routes (i) and (ii) in a cooperative manner, which can significantly impact the performance of the H2O2 fuel cell.
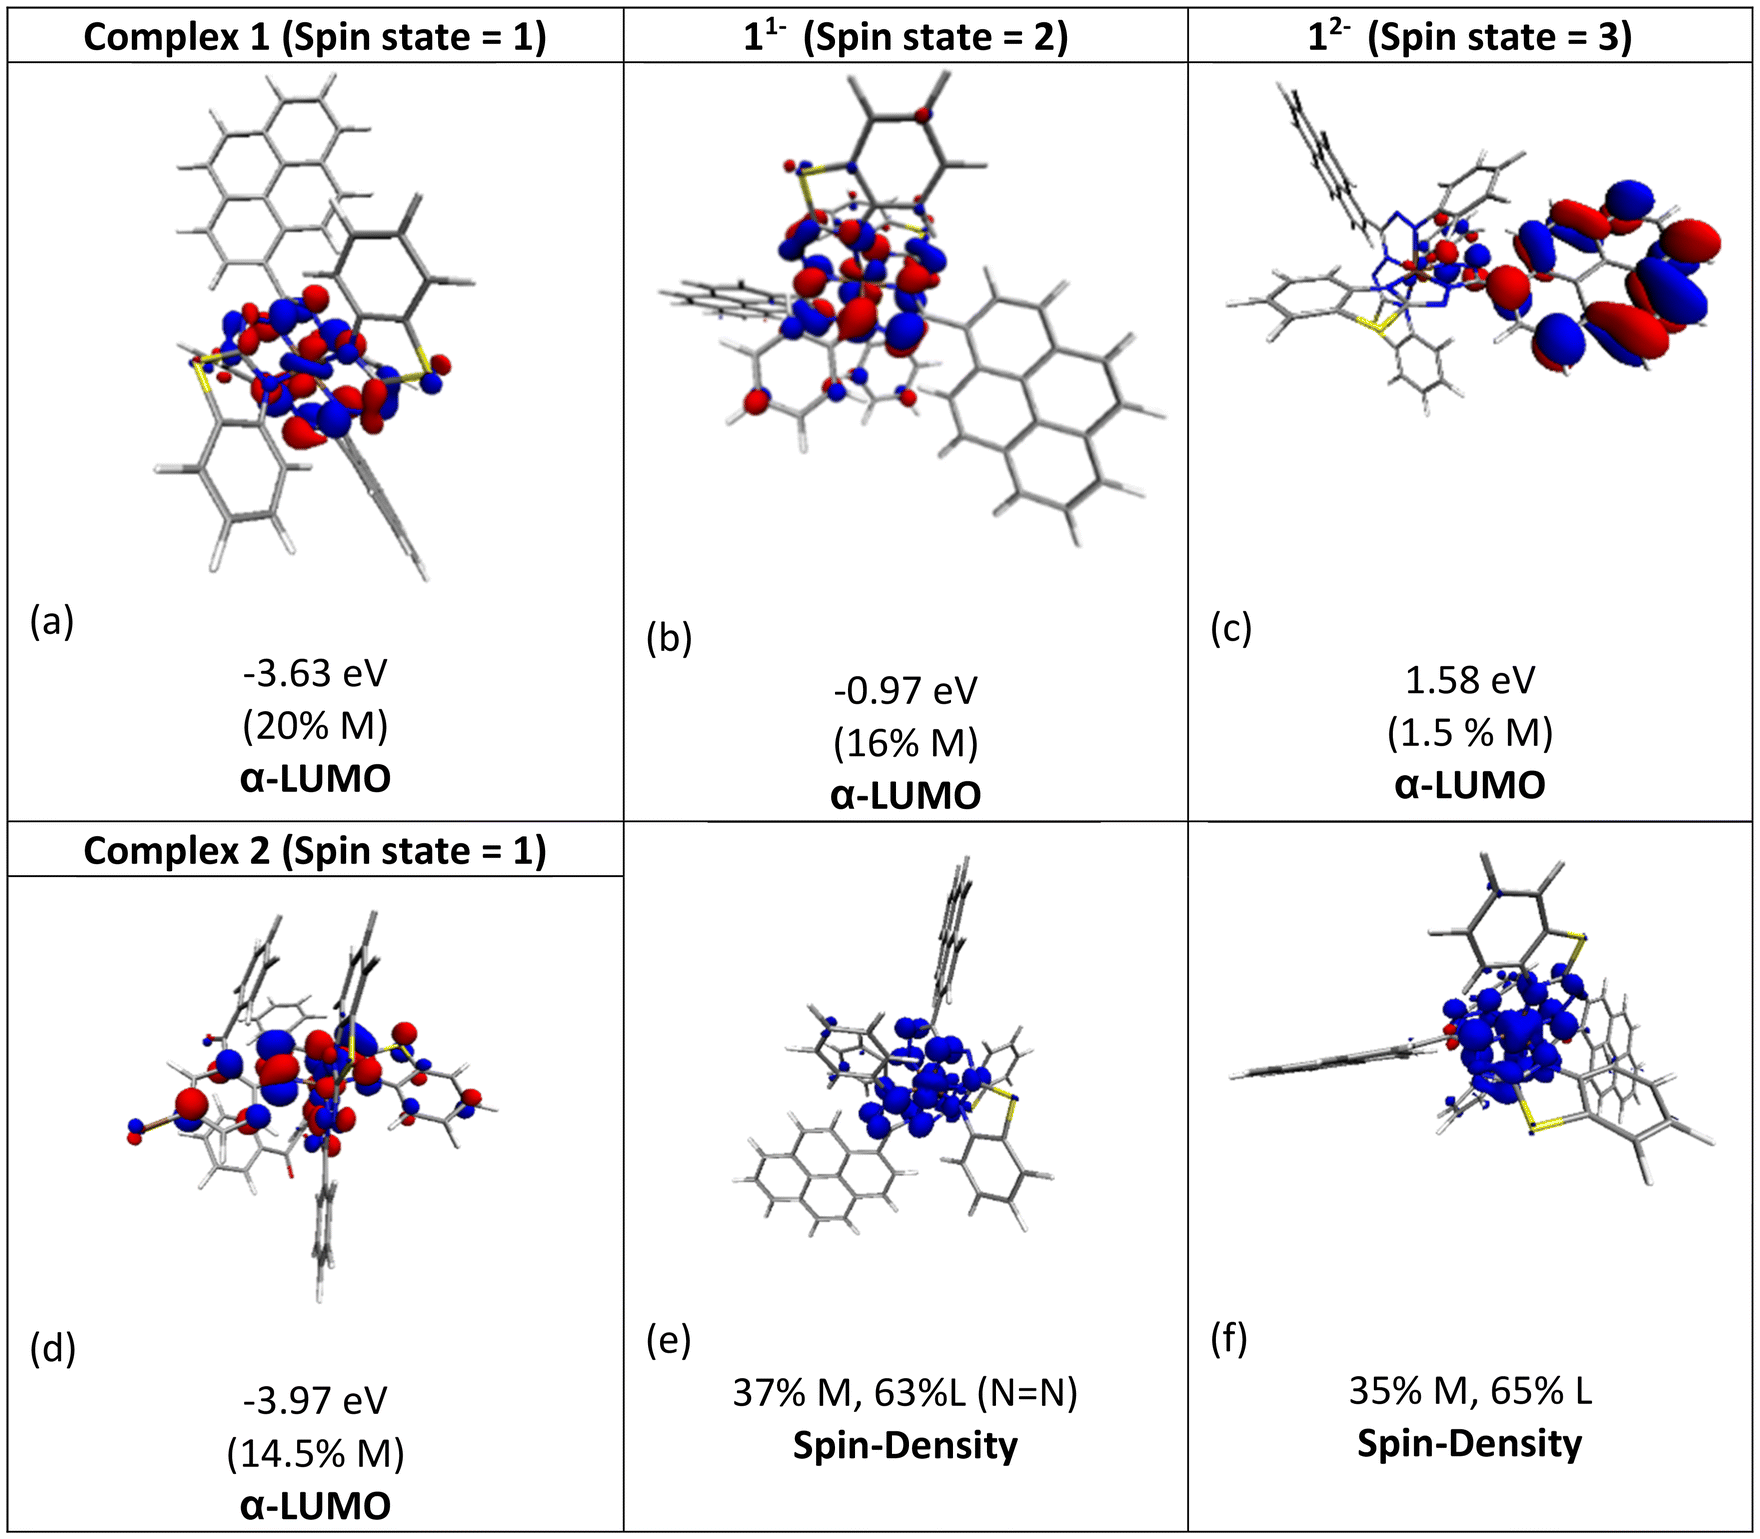
The molecular orbital analysis of complex 1 in its low-spin singlet state indicates that the electron density of the LUMO is primarily localized on the Fe metal center and the formazan core, with only 20% metal contribution (Fig. 9a). The high-spin quintet state of complex 1 lies nearly 34.5 kcal mol−1 above the low-spin singlet state; thus, the singlet state is considered the ground state for complex 1. The electron density distribution of the LUMO in the one-electron-reduced complex 1−1 follows a similar pattern to complex 1, with nearly 16% metal contribution, and the rest resides on the formazan core group (Fig. 9b), suggesting that the first two reduction peaks are mere combinations of metal- and ligand-based reductions. However, the electron density of the LUMO in complex 1−2 (Fig. 9c) clearly resides on the pyrene group of the formazan ligand, clearly implying that the third electron reduction is purely ligand-based, where the electron enters into the substitute group of the ligand. Interestingly, by comparing the position of the third reduction peak observed in the CV spectra of complexes 1 and 2, we observed a difference of ∼0.25 V, implying that the third electron reduction occurs at the substituent group of the formazan ligand. The one-electron relative reduction potentials are calculated for the first three successive reductions of complex 1 in an aprotic DMF solvent using the UBP86 + D3BJ method in combination with def2-TZVPP basis functions. The computed one-electron redox potentials referenced to Fc+/Fc are  ,
,  , and
, and  for the one-, two-, and three-electron reductions, respectively. We also calculated the two-electron simultaneous redox potential referenced to Fc+/Fc, and its value appears to be
  , which is in accord with the second reduction peak observed in the CV spectra of complex 1. The spin densities of the one- and two-electron-reduced species exhibit 35–37% metal contribution and 63–65% ligand contribution; see Fig. 9e and f.
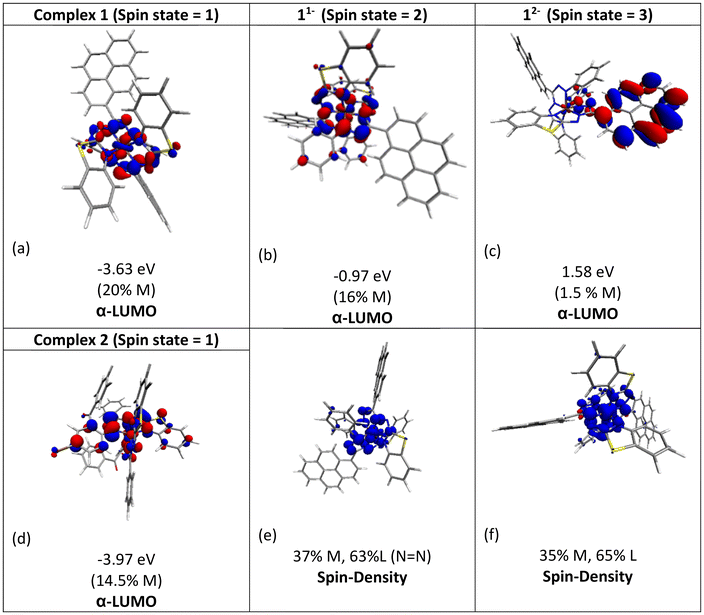 |
| | Fig. 9 Molecular orbital plots of α-LUMOs (isosurface value of 0.03 au) for the (a) unreduced Fe-complex 1 (1), (b) one-electron reduced species (11−), (c) two-electron reduced species (12−) and (d) unreduced Fe-complex 2 (2). (e & f) Spin density plots generated at the 0.003 au (e2 bohr−4) isosurface value (blue, α spin density; red, β spin density) for 11− and 12−. | |
After conducting preliminary tests to assess the catalytic activity of complexes 1 and 2, it was observed that the onset potentials for the reduction of H2O2 under the same conditions were 0.35 V and 0.45 V, respectively. The enhanced power output in the fuel cell while using complex 2 compared to complex 1 can be attributed to the greater ease of H2O2 reduction by complex 2. Furthermore, the solution-state CV of complex 1 displayed the first reduction event at E1/21 = −1.10 V vs. Fc/Fc+ (ΔE = 70 mV, quasi-reversible), whereas for complex 2, under identical conditions, the respective reduction events were observed at E1/21 = −0.96 V vs. Fc/Fc+ (ΔE = 69 mV, quasi-reversible). The electrochemical properties of formazan-based complexes can be tuned by introducing different substituents on the formazan backbone.50,51 Therefore, the incorporation of a strong electron-withdrawing carbonyl group into the formazan backbone, as in the case of complex 2, resulted in a positive shift of the first reduction potential by 140 mV, facilitating the easier reduction of H2O2 and leading to higher power density. It was also revealed from the DFT study that the electron density of the LUMO of complex 2 has a significant contribution from the substituted chloride, which lowers the LUMO energy of complex 2 by 0.33 eV as compared to that of complex 1, as shown in Fig. 9d. Furthermore, DFT studies indicate that the first two reduction peaks represent a combination of metal- and ligand-based reductions. Some studies have shown that the redox potential of the iron center shifts more positively in the presence of electron-withdrawing groups, and the catalytic activity of metal complexes is closely linked to their redox potential; a more positive redox potential typically corresponds to higher catalytic activity.52–54 This indicates the facile reduction of the iron center in the case of complex 2, resulting in an increased power density in the fuel cell based on complex 2. In general, these results indicate that the synergic cooperation between the formazan ligand and Fe(II) resulted in efficient H2O2 reduction in the fuel cell and suggest that formazanate-based complexes hold potential for further exploration in the design of cathode materials for H2O2 fuel cells.
Conclusion
In conclusion, we describe the synthesis of a set of electronically diverse novel formazans L1 and L2, allowing the preparation of two bis(formazanate) iron complexes. The synthesized bisformazanate iron(II) complexes, [FeIIL2] (L = L1, 1; L2, 2), were characterized using various analytical techniques, and their molecular structures were confirmed using SC-XRD. Upon structural analysis of the complexes, peculiar five-membered chelate forms were observed, indicating “open form” binding possibilities for formazanate. Complexes based on formazanate ligands exhibit unique optoelectronic characteristics and diverse electrochemistry, providing a strong foundation for many novel applications. One-compartment H2O2 fuel cells working under acidic conditions were constructed by using [FeIIL2] (L = L1, 1; L2, 2) as cathode materials and Ni foam as an anode. Complex 1 displayed a peak power density of 1.88 mW cm−2, whereas, for complex 2, the observed power density was 3.08 mW cm−2. These results demonstrate that formazanate-based complexes hold significant potential for further exploration in the design of cathode materials for H2O2 fuel cells.
Experimental section
Methods
All of the chemicals and reagents used in the synthesis of formazan ligands L1H and L2H and bis(formazanate) iron complexes 1 and 2 were obtained from commercial sources and used without further purification. The synthesis of complexes 1 and 2 was performed under a nitrogen atmosphere. 2-Hydrazinobenzothiazole, 97%, 1-pyrenecarboxaldehyde, 99%, and 2-amino-5-chlorobenzophenone, 98%, were purchased from Sigma-Aldrich. Ferrous chloride and ferrous sulfate heptahydrate were received from Fisher Scientific Company. Hydrochloric acid, 37%, and all the solvents used were purchased from Fisher Scientific Company. The X-ray diffraction data were collected at 100 K using a Bruker Smart Apex Single Crystal-XRD. All the structures were solved by direct methods using SHELXS-97 and refined by full-matrix least-squares on F2 using SHELXL-97. Using a Bruker 500 MHz spectrometer, 1H and 13C NMR spectra were recorded in CDCl3 solvent. FT-IR measurements of 1 and 2 were taken using KBr pellets with BrukerVertex 70 V PMA50 equipment in the range of 400–4000 cm−1. A Cary 4000 UV-Vis spectrophotometer was used to acquire UV-Vis absorption spectra in CHCl3 solution. A 6545 LC/Q-TOF HRMS was used to collect the HRMS data. Elemental analysis of 1 and 2 was performed using a Thermo Finnigan FLASH EA 112 series. The PerkinElmer STA6000 instrument was used to perform thermogravimetric analysis (TGA) in the temperature range of 30–700 °C. CV experiments were performed on a CHI-6154E electrochemical analyzer using a glassy carbon working electrode, a platinum wire counter electrode, and an Ag/AgCl reference electrode. Cyclic voltammograms were referenced against an internal standard (1 mM ferrocene) and corrected for internal cell resistance.
Synthesis of 1-(benzothiazol-2-yl)-5-phenyl-3-(pyren-1-yl)formazan, L1H
A suspension of 2-hydrazinobenzothiazole (0.330 g, 2.0 mmol, 1.0 eq.) in MeOH (25 mL) was treated with glacial acetic acid (0.2 mL), resulting in partial dissolution. After adding 1-pyrenecarboxaldehyde (0.461 g, 2 mmol, 1.0 eq.) in one portion, yellow precipitates were formed after 5–10 min. In a separate flask, aniline (0.2 ml, 2.2 mmol, 1.1 eq.) was added in a solution of 12 M HCl (0.33 mL, 4 mmol) in H2O (20 mL) at 0 °C, to which a solution of NaNO2 (0.50 g, 7.3 mmol) in H2O (5 mL) at 0 °C was added, resulting in the formation of the corresponding diazonium salt. The mixture was allowed to stir for another 30 minutes, after which it was added dropwise to the initial reaction mixture, resulting in the formation of a dark red solid. Furthermore, the coupling reaction mixture was allowed to stir for another 5 h. The red precipitate was collected by filtration and dried overnight. The crude solid was further purified by column chromatography (dichloromethane, neutral alumina) to afford the red solid. Yield: 528 mg (45%). 1H NMR (500 MHz, CDCl3) δ 8.26 (d, J = 7.7 Hz, 2H), 8.22–8.15 (m, 3H), 8.08 (dd, J = 19.8, 10.2 Hz, 4H), 7.87 (d, J = 7.6 Hz, 2H), 7.80 (s, 1H), 7.73 (d, J = 8.9 Hz, 2H), 7.45 (s, 2H), 7.24 (d, J = 6.5 Hz, 1H), 7.16 (s, 1H). ppm. 13C{1H} NMR (126 MHz, CDCl3): δ 159.04, 152.71, 132.93, 132.72, 131.82, 131.07, 130.81, 129.98, 129.50, 129.40, 129.00, 128.82, 128.02, 127.35, 127.13, 126.81, 126.51, 126.31, 126.13, 126.02, 125.18, 124.92, 123.87, 123.55, 123.39, 123.12, 121.34, 120.14 ppm. FT-IR (KBr): 3452 (m), 3041 (m), 2921 (w), 1591(m), 1542 (s), 1446 (m), 1323 (w), 1245 (m), 1137 (m), 1024 (w), 846 (m), 756 (m), 680 (m), 611 (m) cm−1. UV–vis (CHCl3): λmax 340 nm (ε = 32735 M−1 cm−1), 402 nm (ε = 17667 M−1 cm−1). MS (HRMS, positive-ion mode). Exact mass calcd for [C30H19N5S + H]+: 482.1361. The exact mass found: 482.1441.
Synthesis of [FeII(L1)2], 1
The formazan, L1H (96.30 mg, 0.20 mmol), was dissolved in methanol (15 mL) and allowed to stir for 10 min. Then, ferrous chloride (12.7 mg, 0.1 mmol) was added to the above solution, followed by stirring for 24 hours at room temperature under a nitrogen atmosphere, leading to the formation of a dark brown precipitate. After washing with methanol and hexane, the precipitate was dried in the air. Furthermore, the crude solid was dissolved in an acetonitrile/dichloromethane solution and allowed to evaporate slowly, yielding single crystals suitable for single-crystal XRD. Yield: 75 mg (74%). 1H NMR (400 MHz, CDCl3) δ 8.92 (d, J = 8.1 Hz, 2H), 8.54 (d, J = 8.0 Hz, 2H), 8.33–8.15 (m, 8H), 8.01 (dt, J = 30.0, 8.3 Hz, 6H), 7.59 (d, J = 8.4 Hz, 3H), 7.42–7.28 (m, 7H), 7.02 (dd, J = 26.8, 19.6 Hz, 7H) ppm. 13C NMR (126 MHz, CDCl3) δ 176.51, 161.38, 153.75, 147.27, 132.74, 132.48, 131.30, 130.95, 130.60, 129.25, 128.91, 128.80, 128.67, 128.54, 127.97, 127.51, 127.47, 126.10, 125.68, 125.62, 125.56, 125.51, 124.72, 122.95, 122.78, 122.23, 121.84, 116.59. FT-IR (KBr): 3051 (w), 2401(w), 1714 (m), 1593 (w), 1415 (s), 1215 (s), 1189 (s), 1130 (m), 950 (w), 846 (m), 752 (m), 696 (m) cm−1. UV–vis (CHCl3): λmax 344 nm (ε = 32852 M−1 cm−1), 546 nm (ε = 9528 M−1 cm−1), 692 nm (ε = 6800 M−1 cm−1). MS (HRMS, positive-ion mode). Exact mass calcd for [C60H36FeN10S2 + H]+: 1017.1915. Exact mass found: 1017.2043. Anal. calcd (%) for C60H36FeN10S2: C, 70.86; H, 3.57; N, 13.77. Found: C, 70.62; H, 3.84; N, 13.26.
Synthesis of [FeII(L2)2], 2
The formazan, L2H (99.20 mg, 0.20 mmol), was dissolved in methanol (15 mL) and allowed to stir for 10 min. Then, ferrous sulfate heptahydrate (27.8 mg, 0.1 mmol) was added to the above solution. followed by stirring for 24 hours at room temperature under a nitrogen atmosphere, leading to the formation of a dark purple precipitate. After washing with methanol and hexane, the precipitate was dried in the air. Furthermore, the crude solid was recrystallized by vapor diffusion of hexane into a saturated dichloromethane/methanol solution, yielding single crystals suitable for single-crystal XRD. Yield: 70 mg (67%). 1H NMR (400 MHz, CDCl3) δ 8.21 (dd, J = 6.4, 2.9 Hz, 4H), 7.51–7.42 (m, 6H), 7.41–7.29 (m, 8H), 7.10 (t, J = 7.6 Hz, 6H), 7.02–6.87 (m, 8H), 6.77 (d, J = 8.7 Hz, 2H) ppm. 13C NMR (126 MHz, CDCl3) δ 192.93, 175.75, 160.27, 150.45, 146.77, 136.30, 135.88, 133.24, 132.90, 132.83, 130.93, 129.66, 129.61, 129.08, 128.73, 128.42, 128.08, 127.49, 125.73, 122.40, 121.71, 116.66. FT-IR (KBr): 3062 (w), 2403 (m), 2289 (w), 1708 (m), 1662 (m), 1544 (w), 1407 (m), 1249 (m), 1218 (s), 1168 (s), 1114 (m), 945 (m), 723 (m), 690 (m), 507 (w) cm−1. UV–vis (CHCl3): λmax 321 nm (ε = 20522 M−1 cm−1), 543 nm (ε = 11500 M−1 cm−1), 729 nm (ε = 6100 M−1 cm−1). Exact mass calcd for [C54H34Cl2FeN10O2S2 + H]+: 1045.1034. Exact mass found: 1045.2566. Anal. calcd (%) for C54H34Cl2FeN10O2S2: C, 62.02; H, 3.28; N, 13.39. Found: C, 62.169; H, 3.049; N, 13.330.
Electrochemical reduction of hydrogen peroxide
A glassy carbon electrode was modified with a small amount (10.0 μL) of a solution prepared by dissolving 5 mg of iron complexes 1 and 2 in 1 mL DMF. In order to protect the film on the glassy carbon, 5 μL of Nafion solution was added, and then the film was dried at 70 °C. These modified glassy carbon electrodes were used as the working electrodes. An Ag/AgCl electrode was used as the reference electrode, whereas a Pt electrode was used as the counter electrode. At ambient temperature, measurements were conducted in 0.1 M HCl containing 100 mM H2O2 at a scan rate of 10 mV s−1. The electrochemical behavior of H2O2 at an iron(II)-modified electrode was investigated using a CHI-6154E electrochemical analyzer.
Evaluation of the performance of a H2O2 fuel cell
A drop-casting technique was used to mount iron complexes 1 and 2 onto a glassy carbon electrode. A 5 μL Nafion solution was used to protect the film of the iron complexes on the glassy carbon electrode. An aqueous solution of 0.1 M HCl containing H2O2 (0.50 M) was placed in a one-compartment electrochemical cell. The carbon-mixed sample was prepared by pulverizing 10% (wt/wt) carbon black with iron complexes using NMP (N-methyl pyrrolidone) in a mortar and pestle. The finely ground sample (10.0 μL) was then mounted on a glassy carbon electrode, followed by the addition of a 5 μL Nafion solution. Ni foam and the modified glassy carbon electrodes were immersed in the 0.1 M HCl solution containing H2O2 (0.50 M). Cell performance was evaluated by using a CHI-6154E electrochemical analyzer at 25 °C.
Computational details
The geometry optimizations were performed without any geometry restriction using the unrestricted BP86 density functional implemented in the ORCA 5.0.2 program.55 A def2-TZVP basis set was applied for C, H, O, N, S, and Cl atoms, and a def2-TZVPP56 basis set for the Fe atom. To increase the computational speed, the RI approximation57 in conjunction with an auxiliary basis set (def2/J)58 was employed in all DFT calculations. The energetics of the optimized structure was computed at the BP86/def2-TZVPP level of theory, along with Grimme's dispersion correction, D3BJ.59,60 The Natural Population Analysis (NPA) implemented in the ORCA program was used for the present study. The solvent effect for redox calculations was considered by using the CPCM method61 with DMF solvent. The details of computations are given in ref. 31. To obtain the redox potential referenced to Fc+/Fc, a value of 4.90 V (ESHE value of 4.28 V in conjugation with a conversion constant of 0.624) was subtracted from the absolute redox potential.
Data availability
The data supporting this article have been included as part of the ESI.†
Conflicts of interest
There are no conflicts to declare.
Acknowledgements
R. K. M. acknowledges the SERB EMEQ (EEQ/2020/000588), SERB-ECR (ECR/2016/001262), and IIT Jodhpur SEED Grant (I/ SEED/RKM/20170008) projects for financial support. S. B. is grateful to the UGC for the Senior Research Fellowship (SRF) and the CASE facility, IIT Jodhpur. The authors are grateful to the SAIF, IIT Bombay, for the C, H, and N elemental analysis, and to the HRMS facility – FIST project (SR/FST/CS-II/2019/119(C)), IIT Jodhpur, and the High-Performance Computing Centre, IIT Jodhpur, for their support.
References
- A. W. Nineham, Chem. Rev., 1955, 55, 355–483 CrossRef CAS
 .
.
- J. B. Gilroy and E. Otten, Chem. Soc. Rev., 2020, 49, 85–113 RSC .
- L. Bourget-merle, M. F. Lappert and J. R. Severn, Chem. Rev., 2002, 102(9), 3031–3066 CrossRef CAS PubMed .
- O. R. Luca and R. H. Crabtree, Chem. Soc. Rev., 2013, 42, 1440–1459 RSC .
- V. Lyaskovskyy and B. De Bruin, ACS Catal., 2012, 2, 270–279 CrossRef CAS .
- J. B. Gilroy, M. J. Ferguson, R. McDonald, B. O. Patrick and R. G. Hicks, Chem. Commun., 2007, 412, 126–128 RSC .
- M. C. Chang, P. Roewen, R. Travieso-Puente, M. Lutz and E. Otten, Inorg. Chem., 2015, 54, 379–388 CrossRef CAS PubMed .
- D. L. J. Broere, B. Q. Mercado, J. T. Lukens, A. C. Vilbert, G. Banerjee, H. M. C. Lant, S. H. Lee, E. Bill, S. Sproules, K. M. Lancaster and P. L. Holland, Chem. – Eur. J., 2018, 24, 9417–9425 CrossRef CAS PubMed .
- F. Milocco, F. De Vries, I. M. A. Bartels, R. W. A. Havenith, J. Cirera, S. Demeshko, F. Meyer and E. Otten, J. Am. Chem. Soc., 2020, 142(47), 20170–20181 CrossRef CAS PubMed .
- R. Travieso-Puente, J. O. P. Broekman, M. C. Chang, S. Demeshko, F. Meyer and E. Otten, J. Am. Chem. Soc., 2016, 138, 5503–5506 CrossRef CAS PubMed .
- F. De Vries and E. Otten, ACS Catal., 2022, 12, 4125–4130 CrossRef CAS PubMed .
- J. S. Dhindsa, R. R. Maar, S. M. Barbon, M. Olivia Avilés, Z. K. Powell, F. Lagugné-Labarthet and J. B. Gilroy, Chem. Commun., 2018, 54, 6899–6902 RSC .
- S. M. Barbon, S. Novoa, D. Bender, H. Groom, L. G. Luyt and J. B. Gilroy, Org. Chem. Front., 2017, 4, 178–190 RSC .
- M. Hesari, S. M. Barbon, R. B. Mendes, V. N. Staroverov, Z. Ding and J. B. Gilroy, J. Phys. Chem. C, 2018, 122, 1258–1266 CrossRef CAS .
- R. R. Maar, S. D. Catingan, V. N. Staroverov and J. B. Gilroy, Angew. Chem.,– Int. Ed., 2018, 57, 9870–9874 CrossRef CAS PubMed .
- S. Ito, Y. Ito, T. Kazuo and Y. Chujo, Polymer, 2022, 239, 124463 CrossRef CAS .
- D. Jin, X. Sun, A. Hinz and P. W. Roesky, Dalton Trans., 2022, 51, 5218–5226 RSC .
- V. Singh, A. Kundu, K. Singh and D. Adhikari, Chem. Commun., 2022, 58, 6630–6633 RSC .
- S. Birara, V. Kumar Yadav, A. Kumar Jena, S. Bhattacharyya and R. K. Metre, ChemPlusChem, 2024, e202400696 Search PubMed .
- S. Birara, A. Betal, P. Lama, S. Sahu and R. K. Metre, J. Mol. Struct., 2023, 1287, 135708 CrossRef CAS .
- S. Birara, S. Saini, M. Majumder, P. Lama, S. P. Tiwari and R. K. Metre, Dalton Trans., 2023, 52, 18429–18441 RSC .
- S. Birara, S. Saini, M. Majumder, S. P. Tiwari and R. K. Metre, Dalton Trans., 2024, 53, 15338–15349 RSC .
- S. A. Mousavi Shaegh, N. T. Nguyen, S. M. Mousavi Ehteshami and S. H. Chan, Energy Environ. Sci., 2012, 5, 8225–8228 RSC .
- S. Yamazaki, Z. Siroma, H. Senoh, T. Ioroi, N. Fujiwara and K. Yasuda, J. Power Sources, 2008, 178, 20–25 CrossRef CAS .
- F. Yang, K. Cheng, T. Wu, Y. Zhang, J. Yin, G. Wang and D. Cao, RSC Adv., 2013, 3, 5483–5490 RSC .
- A. E. Sanli and A. Aytaç, Int. J. Hydrogen Energy, 2011, 36, 869–875 CrossRef CAS .
- Y. Yamada, Y. Fukunishi, S. I. Yamazaki and S. Fukuzumi, Chem. Commun., 2010, 46, 7334–7336 RSC .
- S. Fukuzumi, Y. Yamada and K. D. Karlin, Electrochim. Acta, 2012, 82, 493–511 CrossRef CAS PubMed .
- S. Fukuzumi and Y. Yamada, Aust. J. Chem., 2014, 67, 354–364 CrossRef CAS .
- A. Pariyar, G. Vijaykumar, M. Bhunia, S. K. Dey, S. K. Singh, S. Kurungot and S. K. Mandal, J. Am. Chem. Soc., 2015, 137, 5955–5960 CrossRef CAS PubMed .
- N. Kamboj, A. Dey, P. Lama, M. Majumder, S. Sengupta and R. K. Metre, Dalton Trans., 2023, 52, 17163–17175 RSC .
- N. Kamboj, A. Dey, S. Birara, M. Majumder, S. Sengupta and R. K. Metre, Dalton Trans., 2024, 53, 7152–7162 RSC .
- Y. Yamada, M. Yoneda and S. Fukuzumi, Inorg. Chem., 2014, 53(3), 1272–1274 Search PubMed .
- Y. Yamada, M. Yoneda and S. Fukuzumi, Energy Environ. Sci., 2015, 8, 1698–1701 Search PubMed .
- Y. Yamada, M. Yoneda and S. Fukuzumi, Chem. – Eur. J., 2013, 19, 11733–11741 CrossRef CAS PubMed .
- G. Turkoglu and H. Berber, RSC Adv., 2016, 6, 96065–96078 RSC .
- A. Müller, H. Bögge, E. Diemann, D. Brown, S. O'Shea and G. Lipunova, Naturwissenschaften, 1994, 81, 136–137 Search PubMed .
- Y. A. Gorbatenko, Z. G. Rezinskikh, G. N. Lipunova, I. G. Pervova, T. I. Maslakova, P. A. Slepukhin and I. N. Lipunov, Russ. J. Appl. Chem., 2008, 81, 2127–2131 CrossRef CAS .
- D. A. Brown, H. Bögge, G. N. Lipunova, A. Müller, W. Plass and K. G. Walsh, Inorg. Chim. Acta, 1998, 280, 30–38 CrossRef CAS .
- R. Travieso-Puente, J. O. P. Broekman, M. C. Chang, S. Demeshko, F. Meyer and E. Otten, J. Am. Chem. Soc., 2016, 138, 5503–5506 CrossRef CAS PubMed .
- F. De Vries, R. Travieso-Puente, P. Roewen and E. Otten, Organometallics, 2021, 40, 63–71 Search PubMed .
- S. A. Mousavi Shaegh, N. T. Nguyen, S. M. Mousavi Ehteshami and S. H. Chan, Energy Environ. Sci., 2012, 5, 8225–8228 Search PubMed .
- H. Komiya, K. Obata, T. Honma and K. Takanabe, J. Mater. Chem. A, 2024, 12, 3513–3522 RSC .
- R. R. Maar, S. M. Barbon, N. Sharma, H. Groom, L. G. Luyt and J. B. Gilroy, Chem. – Eur. J., 2015, 21, 15589–15599 CrossRef CAS PubMed .
- R. Travieso-Puente, J. O. P. Broekman, M. C. Chang, S. Demeshko, F. Meyer and E. Otten, J. Am. Chem. Soc., 2016, 138, 5503–5506 CrossRef CAS PubMed .
- V. K. Vashistha, A. Kumar, P. Tevatia and D. K. Das, Russ. J. Electrochem., 2021, 57, 348–356 CrossRef .
- Y. Z. Voloshin, N. V. Chornenka, O. A. Varzatskii, A. S. Belov, S. A. Grigoriev, A. S. Pushkarev, P. Millet, V. N. Kalinichenko, I. G. Belaya, M. G. Bugaenko and A. G. Dedov, Electrochim. Acta, 2018, 269, 590–609 CrossRef CAS .
- M. D. A. Masood, R. Jagannathan and P. S. Zacharias, Dalton Trans., 1991, 10, 2553–2557 RSC .
-
J. M. Rao, M. C. Hughes and D. J. Macero, Voltammetry of Terpyridine and Terosine Complexes of Cobalt(I1) and Iron(I1), Elsevier Sequoia S. A, 1976, vol. 16, pp. 231–236 Search PubMed .
- F. L. Buguis, P. D. Boyle and J. B. Gilroy, Dyes Pigm., 2022, 198, 110002 CrossRef CAS .
- G. Turkoglu and H. Berber, RSC Adv., 2016, 6, 96065–96078 RSC .
- M. P. Oyarzún, N. Silva, D. Cortés-Arriagada, J. F. Silva, I. O. Ponce, M. Flores, K. Tammeveski, D. Bélanger, A. Zitolo, F. Jaouen and J. H. Zagal, Electrochim. Acta, 2021, 398, 139263 CrossRef .
- M. Li, L. Liang, C. Ni, X. Liang and W. Zhu, J. Electroanal. Chem., 2016, 766, 135–140 CrossRef CAS .
- J. Masa, K. Ozoemena, W. Schuhmann and J. H. Zagal, J. Porphyrins Phthalocyanines, 2012, 16, 761–784 CrossRef CAS .
- F. Neese, F. Wennmohs, U. Becker and C. Riplinger, The ORCA Quantum Chemistry Program Package, J. Chem. Phys., 2020, 152(22), 224108 CrossRef CAS PubMed .
- F. Weigend and R. Ahlrichs, Balanced Basis Sets of Split Valence, Triple Zeta Valence and Quadruple Zeta Valence Quality for H to Rn: Design and Assessment of Accuracy, Phys. Chem. Chem. Phys., 2005, 7(18), 3297–3305 RSC .
- C. Kollmar, K. Sivalingam, B. Helmich-Paris, C. Angeli and F. Neese, A Perturbation-Based Super-CI Approach for the Orbital Optimization of a CASSCF Wave Function, J. Comput. Chem., 2019, 40(14), 1463–1470 CrossRef CAS PubMed .
- F. Weigend, Accurate Coulomb-Fitting Basis Sets for H to Rn, Phys. Chem. Chem. Phys., 2006, 8(9), 1057–1065 RSC .
- S. Grimme, J. Antony, S. Ehrlich and H. Krieg, A Consistent and Accurate Ab Initio Parametrization of Density Functional Dispersion Correction (DFT-D) for the 94 Elements H-Pu, J. Chem. Phys., 2010, 132(15), 154104 CrossRef PubMed .
- S. Grimme, S. Ehrlich and L. Goerigk, Effect of the Damping Function in Dispersion Corrected Density Functional Theory, J. Comput. Chem., 2011, 32(7), 1456–1465 CrossRef CAS PubMed .
- V. Barone and M. Cossi, J. Phys. Chem. A, 1998, 102, 1995–2001 CrossRef CAS .
|
| This journal is © The Royal Society of Chemistry 2025 |
Click here to see how this site uses Cookies. View our privacy policy here. 
 a,
Moumita
Majumder
b and
Ramesh K.
Metre
a,
Moumita
Majumder
b and
Ramesh K.
Metre


 ,
,  , and
, and 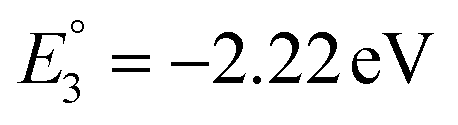 for the one-, two-, and three-electron reductions, respectively. We also calculated the two-electron simultaneous redox potential referenced to Fc+/Fc, and its value appears to be
 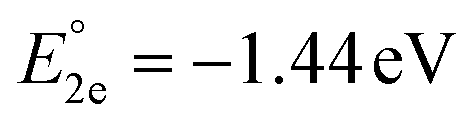 , which is in accord with the second reduction peak observed in the CV spectra of complex 1. The spin densities of the one- and two-electron-reduced species exhibit 35–37% metal contribution and 63–65% ligand contribution; see Fig. 9e and f.