 Open Access Article
 This Open Access Article is licensed under a
 Creative Commons Attribution 3.0 Unported Licence
The many faces of membrane tension for biomembranes and vesicles†
Reinhard Lipowsky *
*
Max Planck Institute of Colloids and Interfaces, 14424 Potsdam, Germany. E-mail: lipowsky@mpikg.mpg.de; Tel: +49 331 5679600
First published on 16th December 2024
Abstract
Membrane tension is generated by external forces and constraints that affect the membrane's surface area. Many studies have been pursued to elucidate this intuitive concept. Here, we focus on biomimetic model systems, for which the notion of membrane tension can be elaborated in a quantitative manner. Bottom-up, these membrane systems are planar bilayers, unilamellar nanovesicles, and giant unilamellar vesicles (GUVs). For planar bilayers and nanovesicles, we need to distinguish the mechanical bilayer tension within the whole bilayer from the mechanical leaflet tensions within the individual bilayer leaflets. In addition, the fluctuation spectrum of the bilayer defines the bilayer's fluctuation tension. These different tensions can be determined by molecular dynamics simulations. On the micron-scale, GUV membranes as observed by light microscopy, experience both a mechanical and a curvature-elastic tension, as follows from the theory of curvature elasticity. The curvature-elastic tension represents a material parameter, whereas the mechanical tension is a kind of hidden variable that depends on the size and shape of the membrane as demonstrated for multispherical shapes of GUVs. Furthermore, the excess membrane area stored in the shape fluctuations is again governed by a fluctuation tension. Many membrane systems exhibit characteristic tension thresholds. Examples include, the shapes of tubular membranes and the morphological responses of vesicle membranes to condensate droplets.
1 Introduction
Experimental procedures that generate membrane tension include osmotic inflation, adhesion, and micropipette aspiration of vesicles. Membrane tension is intimately related to membrane area but difficult to study because the membrane ruptures when its area is increased by a few percent. In order to elucidate the concept of membrane tension, it is very useful to consider biomimetic model membranes. Here, we will study three such systems: planar lipid bilayers, unilamellar nanovesicles, and giant unilamellar vesicles (GUVs).On the nanometer scale, the mechanical tension of the membrane is provided by the bilayer tension as determined by molecular dynamics simulations. This bilayer tension can be decomposed into two leaflet tensions, which control the spatio-temporal remodelling of lipid bilayers and nanovesicles.1 On the micrometer scale, the total membrane tension of a biomembrane with transbilayer asymmetry is equal to the sum of its mechanical and its spontaneous or curvature-elastic tension.2,3
This paper is organized as follows. The next Section 2 emphasizes three fundamental aspects of biomembranes as provided by their molecular bilayer structure, their fluidity, and their shape fluctuations. In Section 2.3, we remind the reader about the important differences between membrane tension and interfacial tension. The subsequent Sections 3–5 elucidate the different notions of membrane tension for planar bilayers, unilamellar nanovesicles, and giant unilamellar vesicles (GUVs), respectively. In Section 6, we show that the remodelling of GUVs by condensate droplets is governed by the competition between the curvature-elastic tensions of the membrane segments and the interfacial tension of the liquid–liquid interface. The last Section 7 describes the most important conclusions.
2 Fundamental aspects of biomembranes
2.1 Symmetric and asymmetric bilayer membranes
All biomembranes are based on lipid bilayers, consisting of two leaflets (or monolayers) of lipid molecules. In general, the two leaflets may differ in their lipid composition, in the packing densities of these lipids – as described by area per lipid or volume per lipid – and in the molecular composition of the two aqueous solutions adjacent to the two leaflets. All of these differences contribute to the transbilayer asymmetry and the associated spontaneous curvature.For the closed membrane of a vesicle, the inner leaflet is in contact with the interior aqueous solution, the outer leaflet with the exterior aqueous solution. Furthermore, biomembranes typically contain membrane proteins which often exhibit an average orientation towards the interior or towards the exterior solution. Therefore, a symmetric bilayer membrane is obtained if both leaflets have the same lipid composition and exhibit the same packing densities for all lipid components. Furthermore, a symmetric bilayer also requires that the exterior solution has the same molecular composition as the interior solution. Such a symmetric membrane represents a highly idealized bilayer state but also provides a reference state that is useful from a conceptual point of view. Furthermore, such a symmetric bilayer is easy to prepare in molecular dynamics simulations, provided one uses a planar bilayer with periodic boundary conditions. Experimentally, a planar membrane geometry is obtained for hole-spanning or black lipid membranes4 and for pore-spanning membranes.5
2.2 Fluidity of membranes
The most fundamental property of a biomembrane is its fluidity. On the molecular scale, the lipid molecules undergo fast lateral diffusion with a diffusion constant of the order of a few μm2 per second. Thus, if we consider two lipids that are in contact with each other, it takes in the order of one or a few nanoseconds for them to swap their spatial positions. On the nanoscale, fluid membranes can exhibit two types of elastic deformations. First, they can be stretched and compressed, which leads to different areas per lipid and different volumes per lipid. Second, they can attain bent or curved states, which deviate from the essentially planar states in Fig. 1. These two elastic deformations follow from classical elasticity theory6 for a liquid material with vanishing shear modulus.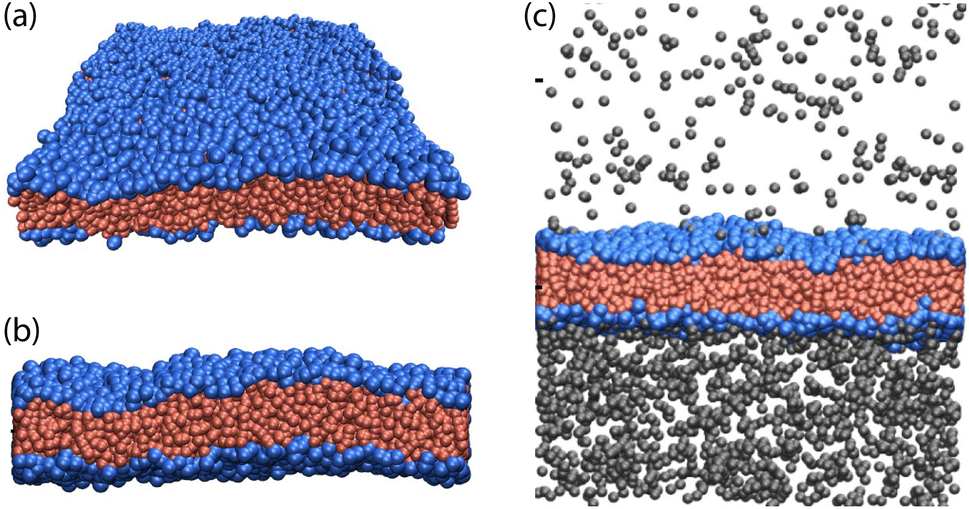 | ||
| Fig. 1 Two examples for one-component lipid bilayers with transbilayer asymmetry: (a and b) planar bilayer consisting of 920 lipids in its upper and 738 lipids in its lower leaflet. The lipids have blue headgroups and red chains; and (c) planar bilayer with 832 lipids in the upper and 832 lipids in the lower leaflet but exposed to two different concentrations of solutes (grey beads) in the upper and lower solution. The solutes adsorb onto the bilayer and form different adsorption layers at the two leaflets. The bilayers have a thickness of about 4 nm.7 | ||
If the membrane is tensionless, it attains a certain optimal area A = A0. In general, the membrane area A differs from this optimal value and is then subject to the mechanical membrane tension
| Σ = KA(A − A0)/A0 ≡ KAΔa, | (1) |
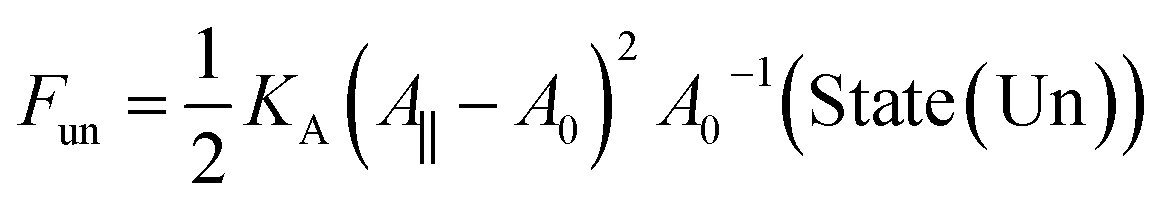
The corresponding elastic energy is obtained from eqn (1) by integration over the membrane area A, which leads to the elastic stretching energy
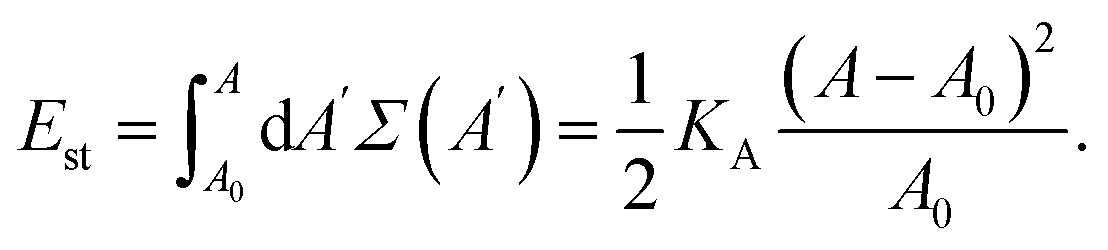 | (2) |
This energy represents the reversible work that we have to perform in order to stretch or compress the membrane from its optimal value A0 at zero tension to its actual value A. Note that the elastic energy Est is always positive, both for stretching with A > A0 and for compression with A < A0.
 and G ≡ C1 C2. As explained in Section S1,† the shape of a vesicle with volume V and membrane area A is computed by minimizing the elastic shape functional
| Fel = −ΔPV + Σ′A + 2κ∫dA(M − m)2 | (3) |
The Lagrange multiplier Σ′ represents a tension. It can be shown9 that the Lagrange multiplier tension Σ′ is equal to the mechanical tension Σ in eqn (1), that is,
| Σ′ = Σ = KAΔa. | (4) |
This equality applies to all (meta)stable states of the vesicle membrane as obtained by the constrained minimization of the elastic shape functional Fel in eqn (3). This minimization of Fel leads to the local shape equation, which has the general form2
| ΔP ≈ 2ΣtotM with Σtot ≡ Σ + 2κm2 | (5) |
![[thin space (1/6-em)]](https://www.rsc.org/images/entities/char_2009.gif) 10
10
2.3 Shape fluctuations of fluid membranes
In the low tension regime, GUVs exhibit shape fluctuations in the form of bending undulations that are clearly visible with an optical microscope. Likewise, these undulations can be observed in molecular dynamics simulations, see Fig. 2. The influence of membrane tension on the membrane's shape fluctuations led to a long and controversial debate. This debate started in the early 1980s with several studies,11–13 which considered both liquid–liquid interfaces with low interfacial tension11,13 and fluid membranes with low membrane tension.12,13 These two tensions must be distinguished, however, because they have fundamentally different properties. | ||
| Fig. 2 Simulation snapshot of a symmetric and tensionless bilayer. The lipid bilayer has a thickness of about 4 nm. The smallest curvature radius of its midsurface (red) is about 6 nm, the radius of the dashed circles. Reused with permission from ref. 14, American Physical Society, 1999. | ||
The persistence length ξp of a fluid membrane grows exponentially with the ratio of the bending rigidity κ to the thermal energy kBT according to12,13,17
 | (6) |
From a conceptual point of view, the persistence length as given by eqn (6) provides an important cross-over length between two different regimes of shape fluctuations. In practise, this length scale is not relevant for lipid bilayers. Indeed, using the bending rigidity κ ≃ 20 kBT for lipid bilayers at room temperature and the molecular length scale  , corresponding to the smallest curvature radius in Fig. 2, we obtain the estimate that ξp is of the order of 1023 km, which is astronomical compared to the size of the largest biomembranes. In fact, a fluid membrane is likely to form a pore across the bilayer when the lateral size of the membrane is still much smaller than the persistence length. Indeed, as shown in Section 3.3 below, any small but finite mechanical tension Σ > 0 leads to poration for a sufficiently large membrane.
3 Membrane tensions of planar bilayers
We now model the membranes as molecular bilayers assembled from one or several lipid components. These bilayers can be studied by molecular dynamics simulations. Using such simulations, one can determine several types of tension: the mechanical bilayer tension, the mechanical leaflet tensions, and the fluctuation tension. The mechanical tensions are computed via the stress profile across the bilayer. The fluctuation tension is deduced from the spectrum of bending undulations on length scales that are small compared to the persistence length.In order to reduce boundary effects, all simulation results for planar bilayers as described here have been obtained for periodic boundary conditions. Thus, we will not consider any “frame tension” as sometimes discussed in the literature. In fact, if we fixed the edge of the membrane by a frame, we would also have to prescribe the normal vectors of the membrane along this frame.
3.1 Mechanical tensions of planar bilayers and leaflets
Each planar bilayer consists of two leaflets, the lower and the upper leaflet labelled ll and ul, respectively. Both leaflets represent two-dimensional liquids, which are subject to the leaflet tensions Σll and Σul. In mechanical equilibrium, each of these leaflet tensions must be laterally uniform. As a consequence, the bilayer tension Σ can be decomposed according to| Σ = Σll + Σul. | (7) |
The computation of these tensions from the stress profile across the bilayer is described in Section S3.†
3.2 Leaflet tension space for planar bilayers
Planar bilayers with a fixed total number of lipids, Nll + Nul, define a two-dimensional leaflet tension space, as depicted in Fig. 3 for Nll + Nul = 1682. The origin of this leaflet tension space as given by Σil = Σul = 0, defines the relaxed reference state with two tensionless leaflets. This reference state of the planar bilayers can be obtained by focusing on symmetric bilayers with Nll = Nul = 841 and identifying the unique bilayer with vanishing bilayer tension Σ = 0. To characterize the elastic response of the reference state, it is useful to distinguish two types of elastic deformation, corresponding to the red and black data in Fig. 3.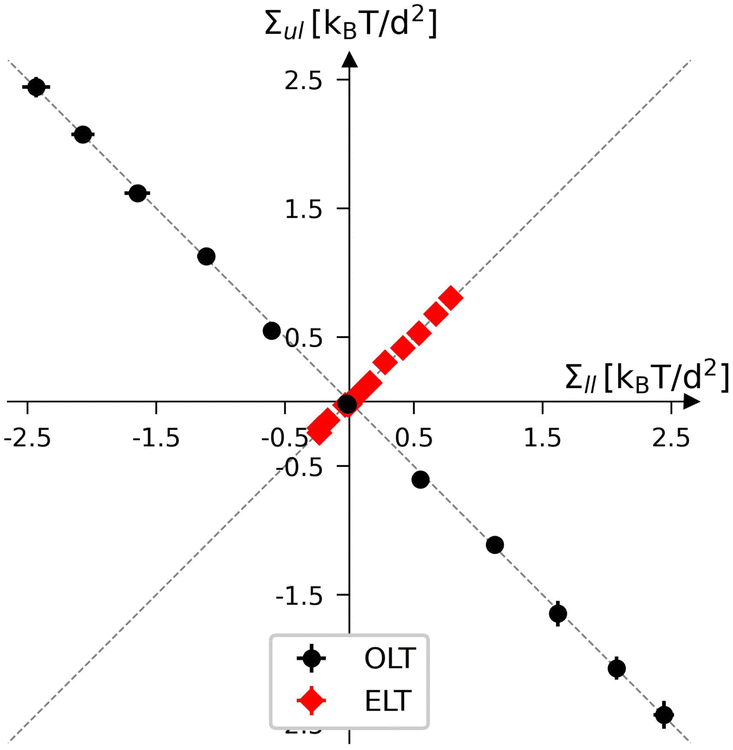 | ||
| Fig. 3 Leaflet tension space for planar bilayers that contain a total number of Nll + Nul = 1682 lipids.18 The two coordinates are the leaflet tensions Σll and Σul in the lower and upper leaflets. Negative and positive leaflet tensions describe compressed and stretched leaflets. The reference state with tensionless leaflets, corresponding to Σll = Σul = 0, is obtained for the symmetric bilayer with Nll = Nul = 841 lipids. The red data points describe elastic deformations with equal leaflet tensions (ELTs), Σll = Σul. The black data represent bilayers with opposite leaflet tensions (OLTs), Σll = −Σul and Σ = 0. All OLT states can be obtained from the reference state by reshuffling lipids from one leaflet to the other and adjusting the base area of the simulation box to obtain tensionless bilayers. | ||
The red data represent elastic deformations of the reference state with equal leaflet tensions (ELTs), that is, with
| Σll = Σul (equal leaflet tensions). | (8) |
The ELT states are located along the main diagonal of the leaflet tension space in Fig. 3. These ELT states are described in more detail in Section S4 and Fig. S5–S7.† On the other hand, the black data in Fig. 3 correspond to elastic deformations of the reference state with opposite leaflet tensions (OLTs), that is, with
| Σll = −Σul (opposite leaflet tensions). | (9) |
The OLT states are located on the diagonal which is orthogonal to the main diagonal in Fig. 3. All OLT states can be obtained from the reference state by reshuffling lipids from one leaflet to the other, keeping the total lipid number Nll + Nul constant and imposing the constraint of vanishing bilayer tension Σ = Σll + Σul = 0. As a consequence, one leaflet becomes compressed by a negative leaflet tension whereas the other leaflet becomes stretched by a positive leaflet tension.
The different OLT states of the planar bilayer can be distinguished by their stress asymmetry7,19
| ΔΣ≡Σul − Σll. | (10) |
The stress asymmetry ΔΣ vanishes for all ELT states of the planar bilayer, for which both leaflets contain the same number of lipids, i.e., for which Nul = Nll. In contrast, all OLT states of the planar bilayer exhibit a nonzero stress asymmetry, which increases in magnitude as we move away from the reference state with Σil = Σul = 0. Furthermore, all bilayer states with the same nonzero value of the stress asymmetry, ΔΣ = constant, are located on a line parallel to the main diagonal. Stress asymmetry in planar bilayers has also been studied by Deserno and coworkers,20,21 who used the term “differential stress” instead of “stress asymmetry”. The elastic response of the planar bilayer leaflets to the leaflet tensions can be described both in terms of area per lipid and volume per lipid (Section S4, Fig. S5 and S6†), where volume per lipid is obtained via Voronoi tessellation (Fig. S7†).
3.3 Formation of stable bilayer pores
For a sufficiently large and positive bilayer tension Σ, the bilayer will rupture and form a pore. To illustrate this poration process, we now consider a planar and symmetric bilayer, which contains N/2 identical lipid molecules in each leaflet. We assume that the membrane area stored in the shape fluctuations of the bilayer can be ignored. As a consequence, the surface area A of the bilayer membrane is close to its projected area A‖, which can be directly controlled in molecular dynamics simulations by the geometry of the simulation box. Indeed, for a planar bilayer that spans a cubic simulation box, the projected area of the bilayer is equal to the base area of this box. Furthermore, the bilayer has an optimal projected area A‖ = A0 for which the mechanical tension Σ = (A‖ – A0)/A0 as given by eqn (1), vanishes. When A‖ is larger than A0, the bilayer is stretched by a positive mechanical tension Σ > 0.Now, let us compare, for a given projected area A‖ > A0, two different bilayer states: State (Un) corresponds to the unporated state with constant area per lipid, a = 2A‖/N, state (Po) to a porated bilayer with a single circular pore of radius R. The stretching free energy of state (Un) is equal to
 | (11) |
 | (12) |
The free energy difference ΔF between (Po) and (Un) is
 | (13) |
When the bilayer is compressed by a negative value of Σ, all terms on the right hand side of eqn (13) are positive and ΔF(R) is a monotonically increasing function of R, which implies that the unporated bilayer state (Un) is always the state of lower free energy. On the other hand, when the bilayer is stretched by a positive value of Σ, the free energy difference ΔF(R) in eqn (13) develops an inflection point for mechanical tension
| Σ1 = c1K1/3Aλ2/3/A1/30 | (14) |
| Σ2 = c2K1/3Aλ2/3/A1/30 | (15) |
Therefore, as we vary the mechanical bilayer tension Σ within a symmetric bilayer, the stretched bilayer has no pore for Σ ≤ Σ1, forms a metastable pore for Σ1 < Σ < Σ2, and a globally stable pore for Σ > Σ2. The threshold values Σ1 and Σ2 as given by eqn (14) and (15) are in good agreement with the results of molecular dynamics simulations.23 It is important to note that both tension thresholds Σ1 and Σ2 are proportional to 1/A1/30 and thus go to zero for large bilayer area A0. As a consequence, sufficiently large bilayers can always lower their free energy by forming a stable pore.
3.4 Leaflet tensions of tensionless planar bilayers
In order to avoid pore formation and bilayer rupture, we will now focus on tensionless bilayers with Σ = Σll + Σul = 0 or Σll = −Σul, corresponding to OLT states of the bilayer. For bilayers with a total lipid number Nll + Nul = 1682 as in Fig. 3, the tensionless bilayers or OLT states are given by the black data points in this figure. The corresponding leaflet tensions are displayed in Fig. 4 as a function of the lipid number Nul assembled in the upper leaflet. As shown in this figure, tensionless leaflets are obtained for the symmetric bilayer with Nll = Nul = 841.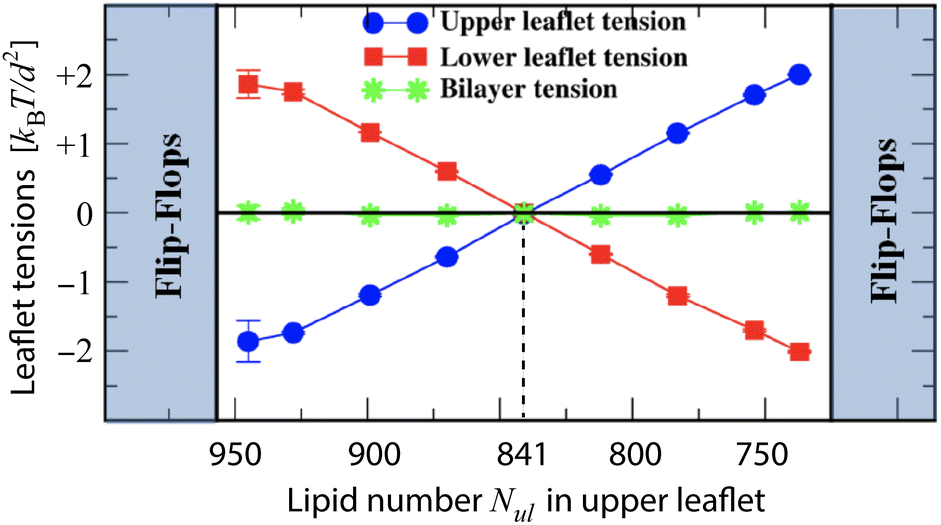 | ||
| Fig. 4 Leaflet tensions of tensionless planar bilayers: upper leaflet tension Σul (blue) and lower leaflet tension Σll (red) versus lipid number Nul for constant total lipid number Nul + Nll = 1682.19 The lipid number Nul is reduced by moving lipids from the upper to the lower leaflet, thereby increasing the upper leaflet tension and decreasing the lower one. Both leaflet tensions vanish for Nul = 841 (vertical dashed line) which defines the relaxed reference state of the planar bilayers. The green data display the bilayer tension Σ = Σul + Σll, which is close to zero. For 945 ≥ Nul ≥ 737, the bilayer remains stable but becomes unstable (i) for Nul ≥ 957 via flip-flops from the compressed upper to the stretched lower leaflet and (ii) for Nul ≤ 725 via flip-flops from the compressed lower to the stretched upper leaflet. | ||
The stability regime for planar tensionless bilayers as displayed in Fig. 4, is bounded by two instability lines: the left instability line at Nul = 957 and Nll = 725, as well as the right instability line at Nul = 725 and Nll = 957. For Nul > 957, the lipids in the compressed upper leaflet start to undergo flip-flops into the stretched lower leaflet. For Nul < 725, the lipids in the compressed lower leaflet start to flip-flop into the stretched upper leaflet. In addition to flip-flops of lipid molecules, tensionless planar bilayers undergo structural instabilities outside of the stability regime in Fig. 4. Data for lipid flip-flops and structural instabilities are displayed in Fig. S8 and S9.† On the other hand, if a multicomponent and tensionless lipid bilayer contains a lipid species such as cholesterol that undergoes frequent flip-flops, these flip-flops act to decrease the stress asymmetry between the bilayer leaflets (Section S5 and Fig. S10†).24
3.5 Fluctuation tension of planar bilayers
In this last subsection on planar bilayers, we briefly look at the effect of the membrane's shape fluctuations. These fluctuations can be decomposed into Fourier modes, which leads to the fluctuation spectrum
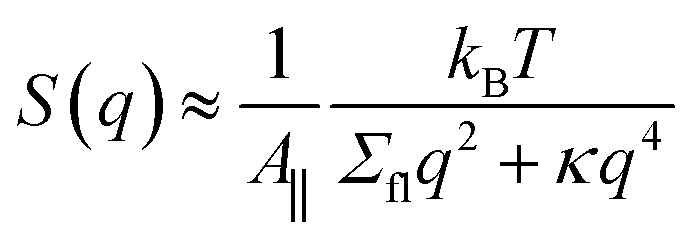 | (16) |
One interesting and open question is the relation between the fluctuation tension Σfl in eqn (16) and the mechanical bilayer tension Σ. In our original molecular dynamics study of the fluctuation spectrum,14 we assumed that vanishing mechanical tension, Σ = 0, implies vanishing fluctuation tension, Σfl = 0. This assumption has been confirmed by the fluctuation spectra of planar bilayers with two lipid components, see simulation data in Fig. S11.†
On the other hand, several molecular dynamics simulations found small differences between the numerical values of the two tensions Σ and Σfl,25–27 in agreement with the theory described in ref. 28. However, the most recent study,29 which addressed this issue using Monte Carlo simulations, came to the conclusion that the two tensions are, in fact, identical, that is, that Σfl = Σ, in agreement with our original assumption.14
4 Membrane tensions of nanovesicles
For a closed vesicle, we distinguish the inner from the outer leaflet by the subscripts il and ol and denote the corresponding leaflet tensions by Σil and Σol. The bilayer tension Σ is again equal to the sum of the two leaflet tensions, that is, Σ = Σil + Σol.4.1 Mechanical tensions of spherical bilayers and leaflets
For a spherical bilayer, the stress profile depends on the radial coordinate r, which measures the distance from the center of the sphere. The corresponding mechanical tension Σ can be obtained from the stress profile s = s(r) via
 | (17) |
The inner leaflet occupies a certain range of r-values, which lie below the r-values for the outer leaflet. The molecular interface between these two leaflets defines the midsurface of the spherical bilayer at r = rmid.1 The leaflet tensions are then obtained from
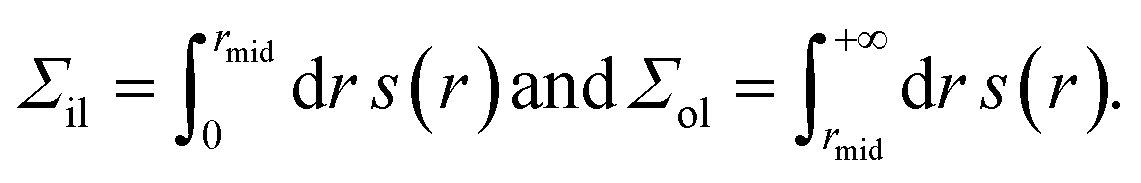 | (18) |
4.2 Leaflet tension space for spherical bilayers
Now, consider an ensemble of spherical vesicles, which all have the same total lipid number Nil + Nol. The corresponding leaflet tension space is displayed in Fig. 5 for total lipid number Nil + Nol = 2525. The origin of this space, corresponding to the relaxed reference state with tensionless leaflets Σil = Σol = 0, is obtained for Nil = 840 lipids in the inner leaflet and Nol = 1685 lipids in the outer leaflet. Therefore, the bilayer state with two tensionless leaflets is obtained when the outer lipid number Nol is about twice as large as the inner lipid number Nil. | ||
| Fig. 5 Leaflet tension space for vesicle bilayers with a total number of Nil + Nol = 2525 lipids in both leaflets. The two coordinates are the leaflet tensions Σil and Σol in the inner and outer leaflets. The reference state with tensionless leaflets, corresponding to Σil = Σol = 0, is obtained for a vesicle bilayer with Nil = 840 lipids in the inner leaflet and Nol = 1685 lipids in the outer one.18 Negative and positive leaflet tensions describe compressed and stretched leaflets. The black data correspond to elastic OLT deformations obtained from the reference state by reshuffling lipids from one leaflet to the other and adjusting the vesicle volume to obtain tensionless bilayers with Σ = Σil + Σol = 0. The green data represent the elastic deformations arising from changes in vesicle volume, corresponding to vesicle inflation or deflation (VID). | ||
Because the reference state has a large lipid number asymmetry, it is difficult to identify the ELT states with Σol = Σil for spherical bilayers. In contrast, it is relatively simple to generate the OLT states with Σol = −Σil from the relaxed reference state with Σol = Σil = 0 by: (i) reshuffling lipids between the two leaflets and (ii) adjusting the vesicle volume to obtain a tensionless bilayer.18,19,30 The resulting OLT states correspond to the black data points in Fig. 5. The different OLT states are distinguished by the stress asymmetry
| ΔΣve ≡ Σol − Σil | (19) |
To generate the green data points for vesicle inflation or deflation (VID) in Fig. 5, we start again from the reference state with Σil = Σol = 0 but now change the vesicle volume in order to increase or decrease the bilayer tension, thereby mimicking the experimental procedure of osmotic inflation or deflation. Note that the green data do not follow the main diagonal, in contrast to the equal leaflet tension (ELT) data in Fig. 3, but become parallel to the main diagonal for large leaflet tensions, which implies a constant stress asymmetry, ΔΣve.
4.3 Leaflet tensions of tensionless vesicle bilayers
The leaflet tensions of tensionless vesicle bilayers, which are assembled from a total number of Nil + Nol = 2875 lipids, are displayed in Fig. 6. For these vesicle bilayers, the relaxed reference state with tensionless leaflets is obtained for Nol = 1921 lipids in the outer leaflet and Nil = 954 lipids in the inner leaflet, corresponding to the dashed vertical line in Fig. 6. Thus, when both leaflet tensions vanish, the lipid number Nol in the tensionless outer leaflet is more than twice as large as the lipid number Nil in the tensionless inner leaflet. | ||
| Fig. 6 Leaflet tensions for tensionless vesicle bilayers with a total number of Nil + Nol = 2875 lipids. The vesicles have a diameter of 23.8 d or 19 nm. The blue and red data represent the outer and inner leaflet tensions.19 The green data correspond to the bilayer tension Σ = Σol + Σil, which is close to zero. During the run time of the simulations, we observed no flip-flops within the stability regime (white), corresponding to 1775 ≤ Nol ≤ 2095. The left vertical line at Nol = 2105 represents the instability line at which the lipids start to undergo flip-flops from the compressed outer to the stretched inner leaflet. The right vertical line at Nol = 1755 represents the instability line at which the lipids start to undergo flip-flops from the compressed inner to the stretched outer leaflet. | ||
The white stability regime in Fig. 6 is bounded by two instability lines. When we reach the left instability line at Nol = 2105, lipids start to flip-flop from the compressed outer leaflet to the stretched inner leaflet. Likewise, at the right stability line with Nol = 1755, the compressed inner leaflet becomes instable with respect to flip-flops from the inner to the outer leaflet. The cumulative distribution function for the first flip-flop is displayed in Fig. S12.† In addition to flip-flops, tensionless vesicle bilayers undergo structural instabilities outside of their stability regime as illustrated in Fig. S13.†
4.4 Volume per lipid and lateral volume compressibility
The elastic response of a planar bilayer to mechanical tension can be described in terms of area per lipid or in terms of volume per lipid. In order to determine area per lipid for nanovesicles, we need to introduce some projection onto the curved surfaces of the vesicle bilayers, which represents an ambiguous procedure. Such an ambiguity can be avoided by using the volume per lipid, v, to characterize the lipid bilayer.18The volume per lipid can be obtained from the following procedure based on Voronoi tessellation. In the coarse-grained molecular model, the molecules are built up from different types of spherical beads. Voronoi tessellation assigns a polyhedral cell to each bead, such that all points in this cell are closer to the center of the chosen bead than to the center of any other bead. In Fig. S7,† we illustrate the tessellation method for a planar bilayer and for an individual lipid molecule. Next, the volumes Vil and Vol of the inner and outer leaflets are computed by summing up the volumes of all polyhedral cells that belong to the respective leaflet. Finally, the volumes per lipid, vil and vol, of the inner and outer leaflets are then obtained by dividing the leaflet volumes by the lipid numbers, Nil and Nol, which leads to
 | (20) |
One example for this dependence is shown in Fig. 7 for a vesicle bilayer assembled from a total number of Nil + Nol = 1500 lipids. Inspection of this figure shows that the optimal lipid volumes for the outer and inner leaflet have almost identical but slightly different values as given by18 vil,0 = (3.5790 ± 0.0004)d3 for the inner leaflet and by vol,0 = (3.5612 ± 0.0003)d3 for the outer, leaflet of the vesicle, corresponding to the vertical dashed lines in Fig. 7. Therefore, the optimal lipid volumes for the inner and outer leaflets differ by less than one percent.
 | ||
| Fig. 7 Leaflet tensions versus volume per lipid for nanovesicles with a total number of Nil + Nol = 1500 lipids.18 Leaflet tensions Σle = Σol and Σle = Σil of the outer (black triangles) and inner leaflets (red triangles) versus volumes per lipid, vle = vil and vle = vol, in the two leaflets of the tensionless bilayers. The two dotted vertical lines are located at the optimal lipid volumes v = v0ol ≃ 3.56d3 and v = v0il ≃ 3.58d3 of the outer and inner leaflet. | ||
The deviations of the lipid volumes from their optimal values define the relative volume dilations
 | (21) |
 | (22) |
 | (23) |
4.5 Tension-induced fusion of nanovesicles
Membrane fusion of two nanovesicles can be induced by their bilayer tensions or by their leaflet tensions. A particularly interesting fusion process is observed for tensionless bilayers with Σ = 0 and Σol = −Σil, which avoids bilayer rupture as an alternative pathway to fusion.One example for membrane fusion as observed in molecular dynamics simulations, is depicted in Fig. 8 for a nanovesicle in contact with a planar bilayer.33,39 In order to visualize the fusion pathway, the lipids in the planar bilayer have red head groups and green tails whereas the lipids in the vesicle have orange head groups and yellow tails.
 | ||
| Fig. 8 Fusion of nanovesicle with planar bilayer: The vesicle bilayer consists of 6869 lipids (orange heads, yellow chains) and has a diameter of about 30 nm, while the planar bilayer contains 6911 lipids (red heads, green chains). The water beads originally inside the vesicle are blue, the water beads in the exterior compartment are not shown for clarity. The figure displays four time lapse snapshots which illustrate the development of the fusion process from 78.5 ns, when the first contact between the two membranes occurs and the lipid tails start to undergo interbilayer flip-flops, until the opening of the fusion pore after 1334 ns. Reused with permission from ref. 33, American Physical Society, 2007. | ||
The observed fusion pathway proceeds via three distinct substeps. After the vesicle and the planar bilayer have come into contact at time t = 78.5 ns, the vesicle starts to spread onto the bilayer, thereby forming a highly curved membrane segment along the contact line with the planar bilayer. The lipids along the contact line then undergo interbilayer flip-flops from the vesicle to the planar bilayer, see the yellow lipid tails that appear in the lower leaflet of the planar bilayer. These flip-flops lead to intermixing and partial fusion of the two bilayers, followed by the nucleation of a bean-shaped hemifusion diaphragm at about t = 1177 ns. The bean-shape of the diaphragm can be clearly seen when one looks at cross-sections parallel to the planar bilayer, which are perpendicular to the side views in Fig. 8. Finally, this diaphragm ruptured close to the contact line at t = 1334 ns, thereby opening up a strongly asymmetric fusion pore that provides a water channel between the interior vesicle solution (blue) and the water compartment (white) above the planar bilayer.
The fusion process displayed in Fig. 8 was induced by increasing the area per lipid, a, of the planar bilayer, thereby increasing the mechanical tension Σ, experienced by this bilayer. The resulting fusion process competes with several alternative pathways such as membrane adhesion, hemifusion, and rupture. Because of these alternative pathways, the fraction of successful fusion events, which defines the fusion probability, depends strongly on the area per lipid, a, and on the mechanical tension Σ within the planar bilayer. Indeed, as shown in Fig. S14,† the fusion probability increases linearly with increasing a ∼Σ, reaches a maximum, and then decreases again for larger values of a ∼Σ. The decay of the fusion probability for large a is caused by bilayer rupture.
 | ||
| Fig. 9 Two identical vesicles with tensionless bilayers undergo fusion, when their outer leaflets are stretched by a sufficiently large leaflet tension Σol and their bilayers experience a sufficiently large stress asymmetry. Each vesicle contains Nil = 4500 lipids in its inner and Nol = 5600 lipids in its outer leaflet, corresponding to the outer leaflet tension Σol = +1.02 kBT/d2 and the inner leaflet tension Σil = −1.02 kBT/d2. The vesicles come into contact at time t = 0 and undergo fusion within 0.3 μs.1 | ||
The fusion of nanovesicles with tensionless bilayers but stretched outer leaflets can be understood as follows. First, within the emerging contact area, the shielding of the hydrophobic cores of the two bilayers is reduced by stretching the two outer leaflets and increasing their areas and volumes per lipid. Second, both leaflet tensions drive the subsequent opening of the fusion pore. Indeed, the stretched outer leaflet tries to reduce its area, thereby pulling on the emerging fusion pore, whereas the compressed inner leaflet tries to increase its area, thereby curving the rim of the pore. Furthermore, recent molecular dynamics simulation show that this fusion process proceeds without bilayer rupture and without leakage of vesicle contents.40
5 Membrane tensions of giant vesicles
In this section, we will address membrane tensions of giant vesicles and will focus on multispherical and two-sphere shapes as well as on different shapes of tubular membranes. All of these shapes involve closed membrane necks, which also represent the necessary initial step for vesicle division. Additional aspects of multispherical shapes are discussed in Section S6†, more details on positive two-sphere shapes are provided in Section S7,† which also describes the experimentally observed division of positive two-sphere shapes.41 Negative two-sphere shapes are further examined in Section S8.†5.1 Multispherical shapes of giant vesicles
Multispherical shapes of giant vesicles can be obtained by exposing the two leaflets of the vesicle membranes to two different sugar solutions which generate a spontaneous curvature within the membranes.42,43 If the inner leaflet is in contact with sucrose and the outer leaflet exposed to glucose, the spontaneous curvature m is positive. On the other hand, the GUV membrane acquires a negative spontaneous curvature, m < 0, when the interior leaflet is exposed to glucose and the outer leaflet is in contact with sucrose. Some examples for the resulting multispheres are displayed in Fig. 10.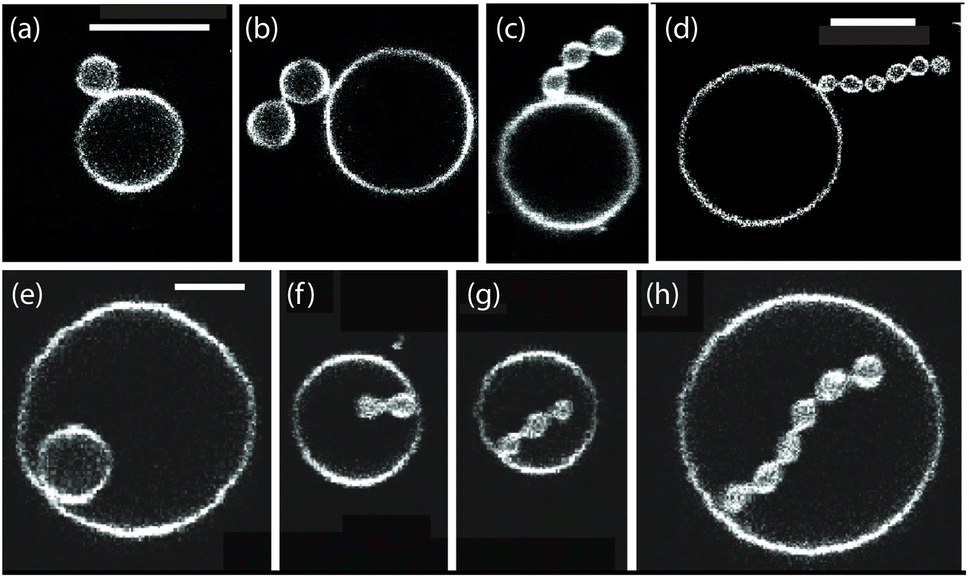 | ||
| Fig. 10 (a–d) (1 + Ns)-spheres for positive spontaneous curvatures, consisting of one large sphere and Ns small spheres, all with positive mean curvature. The scale bars in (a) and (d) are 10 μm, the scale bar in (a) also applies to (b) and (c). (e–h) (1 + Ns)-spheres for negative spontaneous curvatures, consisting of one large sphere with positive mean curvature and Ns small spheres with negative mean curvature. The membrane necks of the positive and negative multispheres have a positive and negative effective mean curvature, respectively, as follows from eqn (24). The scale bar in (e) is 5 μm and applies to (e–h).42 | ||
![[v with combining macron]](https://www.rsc.org/images/entities/i_char_0076_0304.gif) and the rescaled spontaneous curvature
and the rescaled spontaneous curvature ![[m with combining macron]](https://www.rsc.org/images/entities/i_char_006d_0304.gif) as defined by eqn (S9) and (S10).† The stability regime of each multisphere is bounded by two lines of limit shapes. When we leave the stability regime by crossing a line of limit shapes, at least one closed membrane neck opens up. On the other hand, away from these limit shapes, the multispherical shapes represent persistent shapes that depend only on but are independent of .44
as defined by eqn (S9) and (S10).† The stability regime of each multisphere is bounded by two lines of limit shapes. When we leave the stability regime by crossing a line of limit shapes, at least one closed membrane neck opens up. On the other hand, away from these limit shapes, the multispherical shapes represent persistent shapes that depend only on but are independent of .44
 | (24) |
In fact, for each multisphere, all necks have the same sign. Indeed, all membrane necks are positive for each multisphere in Fig. 10a–d and negative for each multisphere in Fig. 10e–h. As a consequence, we can distinguish positive multispheres with positive membrane necks from negative multispheres with negative membrane necks.
 | (25) |
The mechanical tension as given by eqn (25) involves both the curvature-elastic parameters κ and m as well as the mean curvatures Ml and Ms (or M*) of the large and small spheres. Therefore, eqn (25) directly demonstrates that the mechanical tension Σ depends on the size and shape of the multispherical vesicle.
5.2 Two-sphere shapes of giant vesicles
The simplest multispheres are provided by two spheres connected by a closed membrane neck as shown in panels a and e of Fig. 10. The positive two-sphere shape in Fig. 10a consists of one large sphere and one smaller spherical out-bud, and the negative two-sphere shape in Fig. 10e of one large sphere and one smaller spherical in-bud. The stability regime of the positive two-spheres is described in the next paragraph and displayed in Fig. 11, the stability regime of the negative two-spheres in Section S8 and Fig. S16.† | ||
Fig. 11 Stability regime (light blue) for positive (1 + 1)-spheres with positive spontaneous curvature . The stability regime is bounded by two lines (dark blue) of limit shapes, Lpos1+1 and Lpos2*, which meet at the corner point (purple circle) with  and and  . The persistent (1 + 1)-spheres along the red dashed line are characterized by tensionless membranes with mechanical tension Σ = 0; this tension is positive and negative to the left and to the right of the red dashed line. The inset displays a persistent (1 + 1)-shape that remains unchanged when we vary the spontaneous curvature along the horizontal dashed line (orange). This shape invariance is a direct consequence of the area and volume relations in eqn (S27) and (S28).† . The persistent (1 + 1)-spheres along the red dashed line are characterized by tensionless membranes with mechanical tension Σ = 0; this tension is positive and negative to the left and to the right of the red dashed line. The inset displays a persistent (1 + 1)-shape that remains unchanged when we vary the spontaneous curvature along the horizontal dashed line (orange). This shape invariance is a direct consequence of the area and volume relations in eqn (S27) and (S28).† | ||
 | (26) |
The lower boundary line of the stability regime in Fig. 11 is provided by another line of limit shapes, denoted by L2* and consisting of two equally sized spheres with radius 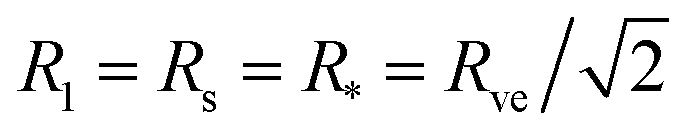 . In the morphology diagram, the L2*-line is located at
  and
and  .
.
The two lines of limit shapes, Lpos1+1 and Lpos2*, meet at the corner point with = 2* = 1/√2 and = 2* = √2. At this corner point, the limit shape consists of two equally sized spheres with mean curvature M* = 1/R* = m2*, which implies zero bending energy, Ebe = 0, as follows from eqn (S3).†
| Σ = 2κm2 = 2κ(Meffls)2 for all limit shapes Lpos1+1 | (27) |
| Σ = 0 for m = Ml + Ms, | (28) |
Along the line of limit shapes Lpos2* with = 2* = 1/√2 and ≥2* = √2, the mean curvature M* of the equally sized spheres is equal to M* = m2* = √2/Rve. It then follows from eqn (25) with Ml = Ms = M* that the associated membrane mechanical tension is given by
 | (29) |
 , which represents the lower end point of the dashed red line in Fig. 11. Furthermore, the mechanical tension Σ as given by eqn (29) behaves as Σ ≈ –2κm2 for large m, that is, the mechanical tension Σ becomes large and negative for large and positive spontaneous curvature m.
As shown in Fig. 11, the L1+1-line meets the L2*-line of two equally sized spheres at the corner point with 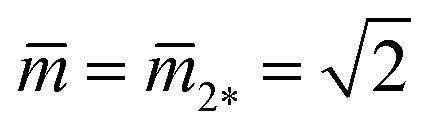 and
and 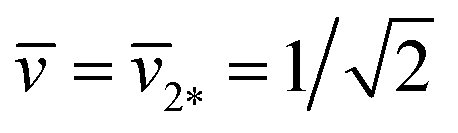 where the mechanical tension Σ has the value
| Σ = 2κm2*2 = 4κ/Rve2 (corner point). | (30) |
5.3 Different shapes of tubular membranes
Tubular membranes and vesicles can exhibit different shapes, corresponding to multispherical, unduloidal, and cylindrical shapes. | ||
Fig. 12 (a) Stability regime (light blue) for positive (1 + 14)-spheres. The stability regime is bounded by two lines of limit shapes (dark blue), Lpos1+14 and Lpos15*. These two lines meet at the corner point with 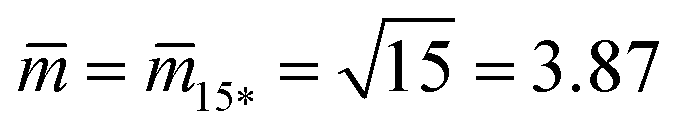 and and 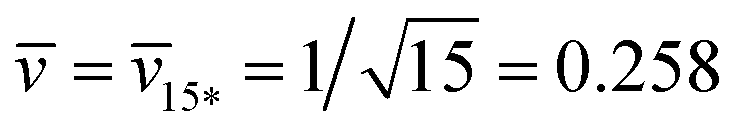 . The persistent (1 + 14)-shapes along the red dashed line are enclosed by membranes with vanishing mechanical tension, Σ = 0; (b) example for a GUV that forms a (1 + 14)-sphere consisting of one somewhat larger sphere at the lower end and a multispherical tube of 14 small spheres; and (c) example for a GUV forming a (15*)-sphere with 15 equally sized spheres. The images in (b) and (c) are from ref. 42, both scale bars are 10 μm. . The persistent (1 + 14)-shapes along the red dashed line are enclosed by membranes with vanishing mechanical tension, Σ = 0; (b) example for a GUV that forms a (1 + 14)-sphere consisting of one somewhat larger sphere at the lower end and a multispherical tube of 14 small spheres; and (c) example for a GUV forming a (15*)-sphere with 15 equally sized spheres. The images in (b) and (c) are from ref. 42, both scale bars are 10 μm. | ||
The line of limit shapes Lpos1+14 in Fig. 12a is given by
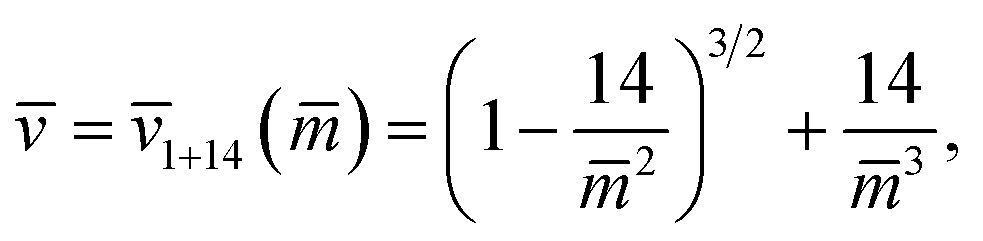 | (31) |
|
≥ 15*≡√15 and = 15* ≡ 1/√15
| (32) |
. The red dashed line in Fig. 12a provides the location for vesicle membranes with vanishing mechanical tension, Σ = 0. Along this line, the spontaneous curvature m is equal to 2Meffls, which can be combined with eqn (S27) and (S28)† to obtain a parametric plot.43
The small spheres of the (1 + 14)-spheres in Fig. 12b transform into small prolates along an instability line as given by the relationship
 | (33) |
. This equation has no solution for < ss ≡ 21.47, one solution for = ss, and two solutions for > ss. Therefore, the small spheres of the persistent (1 + 14)-spheres are stable for < ss = 21.47 but transform into small prolates for > ss and a certain -dependent range of -values. At = ss, the instability line emerges from the single point (ss,ss) = (21.47,0.4035), which opens up into a parabola-like line for > ss. For large , the upper and the lower branch of this parabola-like line approach the two lines of limit shapes, Lpos1+14 and Lpos15, respectively. This bifurcation is located outside of the morphology diagram displayed in Fig. 12a.
and in eqn (S9) and (S10)† are then equal to = 1 = 1 and = 1 = 1 for each proteoliposome.When we add GTP, the proteoliposomes start to fuse and to form multispherical tubes. More precisely, the fusion of N* proteoliposomes leads to an (N*)-multisphere with the shape parameters  and
and  , provided both the total membrane area and the total vesicle volume are conserved during the fusion process. For N* = 2, the shape parameters
  and
and  represent the corner point of the stability regime in Fig. 11, at which the two lines of limit shapes, Lpos1+1 and Lpos2*, meet. For N* = 15, the shape parameters
 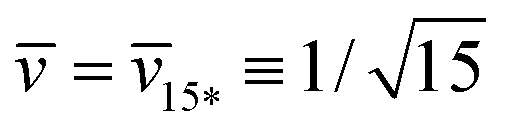 and
and 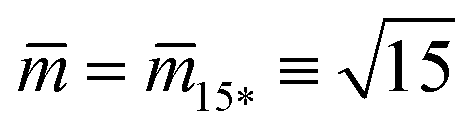 define the location of the corner point in Fig. 12a.
,)-plane, long unduloids with mean curvature M = m and zero bending energy are located between two hyperbolae with = 1() ≡ 1/ and = 2() ≡ 3/(4 ). Such unduloid shapes will form via the fusion of proteoliposomes when some membrane proteins get lost during the fusion process, thereby reducing the spontaneous curvature , or when the fusion process is leaky and the interior volume of the proteoliposomes is reduced during the process.
 | ||
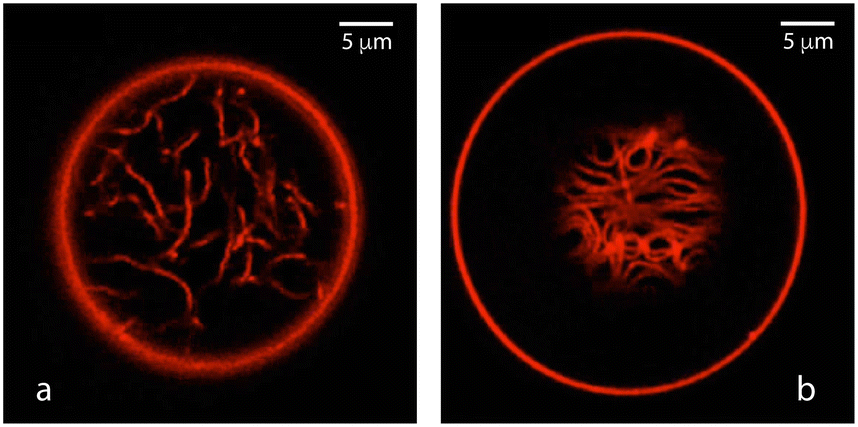
| Fig. 13 Time-lapse snapshots of an irregular pentagon formed by membrane nanotubes and five three-way junctions as observed by structured illumination microscopy. Reused with permission from ref. 47, Springer-Nature, 2018. Time points in seconds (upper left corners); scale bar in (c) also applies to (a) and (b). The pentagon consists of five three-way junctions connected by five tubular segments. One tube segment is marked by the white dotted rectangle in (b). The four blue arrow heads point to transient membrane necks (or constrictions) formed along three tubular segments, which resemble peristaltic shape deformations of these tubules.49 | ||
If one of the membrane necks as indicated by the blue arrow heads in Fig. 13, became closed for an extended period of time, the neck can undergo fission, thereby breaking the nanotubes into several fragments. For reticular networks, such a fragmentation of the nanotubes has indeed been induced experimentally, both in vivo and in vitro, by downregulating the biosynthesis of GTP-hydrolyzing membrane proteins50 and by interrupting the supply of GTP.45 As a consequence, any mechanism that keeps the membrane necks open also prevents nanotube fragmentation.
For a cylindrical tube with radius Rcy and length L, the most unstable mode, denoted by ln*, is characterized by wavenumber p = p* = 1/Rcy, period 2πRcy, and mean-squared amplitude49
 | (34) |
 | (35) |
In Fig. 13, the peristaltic modes do not lead to tube fragmentation. Inspection of this figure indicates that the most unstable modes have amplitudes of about half the cylinder radius which defines another tension threshold Σth,2 via
 | (36) |
6 Membranes in contact with condensate droplets
The term ‘condensate droplet’ implies that the droplet is enclosed by a liquid–liquid rather than by a liquid–gas interface. Aqueous two-phase (or biphasic) systems based on biopolymers such as PEG and dextran have been applied for several decades in biochemical analysis and biotechnology54 and are intimately related to water-in-water emulsions.55 The aqueous phase separation leads to the formation of two coexisting liquid phases, denoted here by α and β as in Fig. 14. The two liquid phases α and β are separated by a liquid–liquid interface with interfacial tension Σαβ, which represents a new tension scale for the vesicle-droplet systems. | ||
| Fig. 14 Partial wetting geometry of vesicle-droplet systems, which involve three liquid phases α (white), β (green), and γ (light red). The phases α and β represent two coexisting phases that arise via segregative or associative liquid–liquid phase separation; the γ phase is an inert spectator phase: (a) phase separation of the exterior solution and adhesion of an exterior β droplet to the outer leaflet of the vesicle membrane; and (b) phase separation of the interior solution creating one interior α and one interior β droplet, both of which are in contact with the inner leaflet of the membrane.56 | ||
The aqueous phase separation of PEG-dextran solutions provides an example for segregative phase separation, in which one phase is enriched in one macromolecular component such as PEG whereas the other phase is enriched in the other macromolecular component such as dextran. The segregative behavior implies that the different species of macromolecules effectively repel each other. The phase diagram and the interfacial tension of aqueous PEG-dextran solutions is described in Section S9 and Fig. S17.† Another type of aqueous two-phase system is created by associative phase separation, for which one phase is enriched in the macromolecular components whereas the other phase represents a dilute solution of the macromolecules.57–60 The associative behavior implies that the different macromolecular species effectively attract each other. Associative phase separation is observed, for instance, in solutions of two, oppositely charged polyelectrolytes,59,60
Condensate droplets have also been observed in living cells where they provide separate liquid compartments or organelles which are not enclosed by intracellular membranes. These biomolecular condensates are believed to form via liquid–liquid phase separation in the cytoplasm61,62 and can be reconstituted in vitro.63–66 They are enriched in certain types of proteins that have intrinsically disordered domains and interact via multivalent macromolecular interactions.62,65–68
6.1 Geometry of vesicle-droplet systems
When a condensate droplet comes into contact with a vesicle membrane, attractive interactions between droplet and membrane lead to the adhesion of the droplet to the membrane. The geometry of these vesicle-droplet systems involves three liquid phases α, β, and γ as shown in Fig. 14. The two phases α and β are formed by segregative or associative liquid–liquid phase separation and are separated by the αβ interface. When the droplet partially wets the membrane, the αβ interface forms a contact line with the membrane, which divides the membrane up into two segments: the αγ segment exposed to the α and γ phases as well as the βγ segment in contact with the β and γ phases. In Fig. 14a and b, the coexisting phases α and β are located outside and inside the vesicle, respectively. Therefore, Fig. 14a displays one exterior β droplet at the outer leaflet of the bilayer membrane, whereas Fig. 14b shows one interior α and one interior β droplet in contact with the inner leaflet of the membrane.6.2 Remodelling of GUV membranes by condensate droplets
The adhesion of condensate droplets to vesicles generates strong morphological responses of the vesicle membranes. One example for this response is provided by the apparent kinks, which are observed in the optical microscope along the contact line between the adhering droplet and the vesicle membrane, see Fig. 14. On the nanoscopic scale, these kinks represent membrane segments with a very high curvature, caused by the capillary forces that the αβ interface exerts onto the membrane at the contact line.69,70 For PEG-dextran systems, the particularly interesting processes are the complete engulfment of the droplets by the membranes71,72 and the formation of membrane nanotubes,73 as shown in Fig. 15 and 16, respectively. The different patterns of nanotubes displayed in Fig. 16a and b reveal complete and partial wetting of the GUV membrane by the aqueous two-phase system. More details on this wetting behavior are provided in Section S9 and Fig. S18.† | ||
| Fig. 15 Complete engulfment of condensate droplets by GUV membranes (red): (a and b) two-sphere shape of the membrane, which completely engulfs the dextran-rich β droplet (green) via an in-bud and forms a closed membrane neck adjacent to the droplet; reused with permission from ref. 71, American Chemical Society, 2012 (c and d) two-sphere shape of the membrane, which forms two spherical segments around both the dextran-rich β (green) and the PEG-rich α (black) droplet, connected by a closed membrane neck72 In both cases, the systems's free energy is strongly reduced by eliminating the αβ interface. | ||
 | ||
| Fig. 16 Spontaneous tubulation of the αγ membrane segment in contact with the PEG-rich phase α leads to different patterns of nanotubes:73 (a) disordered pattern corresponding to a vesicle membrane that is completely wetted by the PEG-rich phase; and (b) layer of densely packed tubes corresponding to a membrane that is partially (de)wetted by both aqueous phases. All tubes are connected to the outer vesicle membranes (big circles). In both images, the diameter of the fluorescence-labelled tubes is below the diffraction limit of the light microscope. | ||
6.3 Interfacial tension versus curvature-elastic tensions
The two morphological pathways displayed in Fig. 15 and 16 arise from the competition between the interfacial tension of the liquid–liquid interface with the curvature-elastic membrane tensions of the two membrane segments αγ and βγ.When the area Aαβ of the αβ interface is reduced by ΔAαβ, the interfacial free energy of the vesicle-droplet system decreases by
| ΔEint = −ΣαβΔAαβ | (37) |
For GUVs filled with PEG-dextran solutions, inward-pointing nanotubes are formed by the membrane segment αγ exposed to the PEG-rich phase α, as displayed in Fig. 16. The associated spontaneous curvature mαγ is generated by the adsorption of PEG molecules onto the membranes.73 The free energy reduction by the nanotube formation competes with the free energy reduction by the complete engulfment of the droplets. Which process is energetically more favorable depends on three parameters, the interfacial tension Σαβ and the curvature-elastic tensions
| σαγ ≡ 2καγmαγ2 and σβγ ≡ 2κβγmβγ2 | (38) |
When the αγ membrane segment has a large spontaneous curvature mαγ ≫ 1/Rve but a small mean curvature, this segment has a large bending energy of the order σαγ Aαγ, which is proportional to the curvature-elastic tension σαγ of the αγ segment and to the surface area Aαγ of this segment. Now, when the membrane area ΔAme of the weakly curved mother vesicle is transferred to form a nanotube of mean curvature M ≃ mαγ, we gain the bending energy
| ΔEbe = −σαγΔAme = −2καγmαγ2ΔAme. | (39) |
We now repeat this argument for the membrane segment βγ in contact with the dextran-rich phase β, which generates the spontaneous curvature mβγ of the βγ segment. When the membrane area ΔAme of this segment forms a nanotube with mean curvature M ≃ mβγ, we gain the bending energy
| ΔEbe = −σβγΔAme = −2κβγmβγ2ΔAme. | (40) |
Because the membrane segment βγ in contact with the dextran-rich phase is not observed to form nanotubes, we can directly conclude from eqn (39) and (40) that the curvature-elastic tension σβγ of the βγ segment is smaller than the curvature-elastic tension σαγ of the αγ segment.
The reduction of the membrane's bending energy by nanotube formation as given by eqn (39) remains to be compared with the reduction of the interfacial free energy by the engulfment of the droplet as described by eqn (37). We then conclude that complete droplet engulfment should be observed for70
| Σαβ ≫ σαγ = 2καγmαγ2 (complete engulfment), | (41) |
| σαγ ≫ Σαβ (nanotube formation), | (42) |
7 Conclusions
In this paper, we elucidate the notion of membrane tension for three biomimetic membrane systems as provided by planar lipid bilayers, unilamellar nanovesicles, and GUVs. For planar bilayers and nanovesicles, we distinguish the bilayer tension Σ from the two leaflet tensions, Σ1 and Σ2, with Σ = Σ1 + Σ2. A global view of the leaflet tensions is provided by the two-dimensional parameter spaces in Fig. 3 and 5 for planar and vesicle bilayers, respectively. Particularly interesting bilayer states are tensionless but have opposite leaflet tensions (OLTs) as in Fig. 4 for planar bilayers and in Fig. 6 for nanovesicles. Outside their stability regimes, planar and vesicle bilayers exhibit lipid flip-flops (Fig. S8 and S12†) and structural instabilities (Fig. S9 and S13†).For GUV membranes, the total membrane tension Σtot is equal to the mechanical membrane tension Σ plus the curvature-elastic tension 2κm2. The mechanical membrane tension depends on the size and shape of the membrane as demonstrated for multispheres (Fig. 10) in Section 5.1 and for positive two-sphere shapes (Fig. 11) in Section 5.2. We then addressed the different shapes of tubular membranes, which can be multispherical (Fig. 12), unduloidal (Fig. 13), or cylindrical. Unduloidal shapes represent peristaltic deformations of cylindrical shapes. The fluctuation tension Σfl for the excess membrane stored in the peristaltic modes exhibits two tension thresholds as given by eqn (35) and (36).
The adhesion of condensate droplets to GUVs is considered in Section 6. The geometry of the vesicle-droplet systems (Fig. 14) involves three surfaces, the liquid–liquid interface with interfacial tension Σαβ as well as two membrane segments αγ and βγ with curvature-elastic tensions σαγ and σβγ as defined in eqn (38). The relative magnitude of these tensions determines the remodelling of the GUV membranes: for large interfacial tension, the condensate droplets are completely engulfed by the vesicle membranes as in Fig. 15, whereas one of the membrane segments forms membrane nanotubes as in Fig. 16 for small interfacial tension.
Finally, it follows from the finite persistence length of tensionless fluid membranes as given by eqn (6) and from the poration of sufficiently large membranes in Section 3.3, that the thermodynamic route to membrane tension is ill-defined, in contrast to the thermodynamic definition of interfacial tension by J. Willard Gibbs.
Data availability
This paper provides a theoretical analysis of simulation data and experimental data that are available in the published and cited literature.Conflicts of interest
There are no conflicts to declare.Acknowledgements
I thank Bartosz Różycki, Udo Seifert, Gerhard Gompper, and Alberto Imperato for useful correspondence, and all my collaborators for enjoyable and fruitful interactions. This research was conducted within the Max Planck School “Matter to Life” supported by the German Federal Ministry of Education and Research (BMBF) in collaboration with the Max Planck Society and the Max Planck Institute of Colloids and Interfaces. Open Access funding provided by the Max Planck Society.References
- R. Lipowsky, R. Ghosh, V. Satarifard, A. Sreekumari, M. Zamaletdinov, B. Różycki, M. Miettinen and A. Grafmüller, Biomolecules, 2023, 13, 926 CrossRef CAS PubMed.
- R. Lipowsky, Faraday Discuss., 2013, 161, 305–331 RSC.
- R. Lipowsky, Adv. Biol., 2022, 6, 2101020 CrossRef PubMed.
- M. D. Collins and S. L. Keller, Proc. Natl. Acad. Sci. U.S.A., 2008, 105, 124–128 CrossRef CAS PubMed.
- A. Orth, L. Johannes, W. Römer and C. Steinem, ChemPhysChem, 2012, 13, 108–114 CrossRef CAS PubMed.
- L. D. Landau and E. M. Lifshitz, Theory of Elasticity, Pergamon Press, New York, 1986 Search PubMed.
- B. Różycki and R. Lipowsky, J. Chem. Phys., 2015, 142, 054101 CrossRef PubMed.
- E. Evans and R. Hochmuth, Current Topics in Membranes and Transport, Elsevier, 1978, 10, 1–64 CAS.
- R. Lipowsky, Adv. Colloid Interface Sci., 2014, 208, 14–24 CrossRef CAS PubMed.
- T. Bhatia, J. Agudo-Canalejo, R. Dimova and R. Lipowsky, ACS Nano, 2018, 12, 4478–4485 CrossRef CAS PubMed.
- P.-G. De Gennes and C. Taupin, J. Phys. Chem., 1982, 86, 2294–2304 CrossRef CAS.
- W. Helfrich and W. Harbich, Chem. Scripta, 1985, 25, 32–36 CAS.
- L. Peliti and S. Leibler, Phys. Rev. Lett., 1985, 54, 1690–1693 CrossRef CAS PubMed.
- R. Goetz, G. Gompper and R. Lipowsky, Phys. Rev. Lett., 1999, 82, 221–224 CrossRef CAS.
- J. Rowlinson and B. Widom, Molecular Theory of Capillarity, Oxford University Press, Oxford, 1989 Search PubMed.
- U. Seifert and R. Lipowsky, Phys. Rev. A, 1990, 42, 4768–4771 CrossRef CAS PubMed.
- G. Gompper and D. Kroll, Phys. Rev. E, 1995, 51, 514–525 CrossRef CAS PubMed.
- M. Zamaletdinov, M. Miettinen and R. Lipowsky, Soft Matter, 2023, 19, 6929–6944 RSC.
- A. Sreekumari and R. Lipowsky, Soft Matter, 2022, 18, 6066–6078 RSC.
- A. Hossein and M. Deserno, Biophys. J., 2020, 118, 624–642 CrossRef CAS PubMed.
- M. Varma and M. Deserno, Biophys. J., 2022, 121, 4001–4018 CrossRef CAS PubMed.
- O. Farago, J. Chem. Phys., 2003, 119, 596–605 CrossRef CAS.
- T. V. Tolpekina, W. K. den Otter and W. J. Briels, J. Chem. Phys., 2004, 121, 8014–8020 CrossRef CAS PubMed.
- M. Miettinen and R. Lipowsky, Nano Lett., 2019, 19, 5011–5016 CrossRef CAS PubMed.
- A. Imparato, J. Shillcock and R. Lipowsky, Europhys. Lett., 2005, 69, 650–656 CrossRef CAS.
- A. Imparato, J. Chem. Phys., 2006, 124, 154714 CrossRef PubMed.
- J. Stecki, J. Chem. Phys., 2006, 125, 154902 CrossRef CAS PubMed.
- J.-B. Fournier and C. Barbetta, Phys. Rev. Lett., 2008, 100, 078103 CrossRef PubMed.
- H. Shiba, H. Noguchi and J.-B. Fournier, Soft Matter, 2016, 12, 2373–2380 RSC.
- R. Ghosh, V. Satarifard, A. Grafmüller and R. Lipowsky, Nano Lett., 2019, 19, 7703–7711 CrossRef CAS PubMed.
- J. Z. A. Finkelstein and F. Cohen, Annu. Rev. Physiol., 1986, 48, 163–174 CrossRef PubMed.
- J. Shillcock and R. Lipowsky, Nat. Mater., 2005, 4, 225–228 CrossRef CAS PubMed.
- A. Grafmüller, J. Shillcock and R. Lipowsky, Phys. Rev. Lett., 2007, 98, 218101 CrossRef PubMed.
- L. Gao, R. Lipowsky and J. C. Shillcock, Soft Matter, 2008, 4, 1208–1214 RSC.
- T.-T. Kliesch, J. Dietz, L. Turco, P. Halder, E. Polo, M. Tarantola, R. Jahn and A. Janshoff, Sci. Rep., 2017, 7, 12070 CrossRef PubMed.
- R. B. Lira, T. Robinson, R. Dimova and K. A. Riske, Biophys. J., 2019, 116, 79–91 CrossRef CAS PubMed.
- I. Ivanov, R. B. Lira, T.-Y. D. Tang, T. Franzmann, A. Klosin, L. C. da Silva, A. A. Hyman, K. Landfester, R. Lipowsky, K. Sundmacher and R. Dimova, Adv. Biosyst., 2019, 3, 1800314 CrossRef PubMed.
- S. Deshpande, S. Wunnava, D. Hueting and C. Dekker, Small, 2019, 15, 1902898 CrossRef PubMed.
- A. Grafmüller, J. C. Shillcock and R. Lipowsky, Biophys. J., 2009, 96, 2658–2675 CrossRef PubMed.
- B. Rozycki, R. Ghosh and R. Lipowsky, Fusion of nanovesicles driven by the stress asymmetry between leaflettensions, in preparation.
- J. Steinkühler, R. L. Knorr, Z. Zhao, T. Bhatia, S. Bartelt, S. Wegner, R. Dimova and R. Lipowsky, Nat. Commun., 2020, 11, 905 CrossRef PubMed.
- T. Bhatia, S. Christ, J. Steinkühler, R. Dimova and R. Lipowsky, Soft Matter, 2020, 16, 1246–1258 RSC.
- R. Lipowsky, Adv. Colloid Interface Sci., 2022, 301, 102613 CrossRef CAS PubMed.
- R. Lipowsky, The Giant Vesicle Book, Taylor & Francis, 2019, ch. 5, pp. 73–168 Search PubMed.
- R. E. Powers, S. Wang, T. Y. Liu and T. A. Rapoport, Nature, 2017, 543, 257–272 CrossRef CAS PubMed.
- M. A. Betancourt-Solis, T. Desai and J. A. McNew, J. Biol. Chem., 2018, 293, 18514–18524 CrossRef CAS PubMed.
- D. Holcman, P. Parutto, J. E. Chambers, M. Fantham, L. J. Young, S. J. Marciniak, C. F. Kaminski, D. Ron and E. Avezov, Nat. Cell Biol., 2018, 20, 1118–1125 CrossRef CAS PubMed.
- C. J. Obara, A. S. Moore and J. Lippincott-Schwartz, Cold Spring Harbor Perspect. Biol., 2023, 15, a041259 CrossRef CAS PubMed.
- R. Lipowsky, S. Pramanik, A. S. Benk, M. Tarnawski, J. P. Spatz and R. Dimova, ACS Nano, 2023, 17, 11957–11968 CrossRef CAS PubMed.
- G. Orso, D. Pendin, S. Liu, J. Tosetto, T. J. Moss, J. E. Faust, M. Micaroni, A. Egorova, A. Martinuzzi, J. A. McNew and A. Daga, Nature, 2009, 460, 978–983 CrossRef CAS PubMed.
- W. Helfrich and R.-M. Servuss, Il Nuovo Cimento D, 1984, 3, 137–151 CrossRef.
- S. Milner and S. Safran, Phys. Rev. A, 1987, 36, 4371–4379 CrossRef CAS PubMed.
- U. Seifert, Z. Physik B, 1995, 97, 299–309 CrossRef CAS.
- P. A. Albertsson, Partition of Cell Particles and Macromolecules: Separation and Purification of Biomolecules, Cell Organelles Membranes, and Cells, in Aqueous Polymer Two-phase Systems and Their Use in Biochemical Analysis and Biotechnology, Wiley, 3rd edn, 1986 Search PubMed.
- J. Esquena, Curr. Opin. Colloid Interface Sci., 2016, 25, 109–119 CrossRef CAS.
- R. Lipowsky, Membranes, 2023, 13, 223 CrossRef CAS PubMed.
- C. D. Crowe and C. D. Keating, Interface Focus, 2018, 8, 20180032 CrossRef PubMed.
- H. G. B. de Jong and H. R. Kruyt, Proc. K. Ned. Akad. Wet., 1929, 32, 849–856 CAS.
- C. E. Sing, Adv. Colloid Interface Sci., 2017, 239, 2–16 CrossRef CAS PubMed.
- L. Li, S. Srivastava, M. Andreev, A. B. Marciel, J. J. de Pablo and M. V. Tirrell, Macromolecules, 2018, 51, 2988–2995 CrossRef CAS.
- C. P. Brangwynne, C. R. Eckmann, D. S. Courson, A. Rybarska, C. Hoege, J. Gharakhani, F. Jülicher and A. A. Hyman, Science, 2009, 324, 1729–1732 CrossRef CAS PubMed.
- S. F. Banani, H. O. Lee, A. A. Hyman and M. K. Rosen, Nat. Rev. Mol. Cell Biol., 2017, 18, 285–295 CrossRef CAS PubMed.
- P. Li, S. Banjade, H.-C. Cheng, S. Kim, B. Chen, L. Guo, M. Llaguno, J. V. Hollingsworth, D. S. King, S. F. Banani, P. S. Russo, Q.-X. Jiang, B. T. Nixon and M. K. Rosen, Nature, 2012, 483, 336–341 CrossRef CAS PubMed.
- A. Patel, H. O. Lee, L. Jawerth, S. Maharana, M. Jahnel, M. Y. Hein, S. Stoynov, J. Mahamid, S. Saha, T. M. Franzmann, S. Grill, D. Drechsel, A. A. Hyman and S. Alberti, Cell, 2015, 162, 1066–1077 CrossRef CAS PubMed.
- Y. Lin, D. S. W. Protter, M. K. Rosen and R. Parker, Mol. Cell, 2015, 60, 208–219 CrossRef CAS PubMed.
- A. Molliex, J. Temirov, J. Lee, H. J. Kim, T. Mittag and J. P. Taylor, Cell, 2015, 163, 123–133 CrossRef CAS PubMed.
- T. W. Han, M. Kato, S. Xie, L. C. Wu, H. Mirzaei, J. Pei, M. Chen, Y. Xie, J. Allen, G. Xiao and S. L. McKnight, Cell, 2012, 149, 768–779 CrossRef CAS PubMed.
- L. Guo and J. Shorter, Mol. Cell, 2015, 60, 189–192 CrossRef CAS PubMed.
- H. Kusumaatmaja, Y. Li, R. Dimova and R. Lipowsky, Phys. Rev. Lett., 2009, 103, 238103 CrossRef PubMed.
- R. Lipowsky, J. Phys. Chem. B, 2018, 122, 3572–3586 CrossRef CAS PubMed.
- Y. Li, H. Kusumaatmaja, R. Lipowsky and R. Dimova, J. Phys. Chem. B, 2012, 116, 1819–1823 CrossRef CAS PubMed.
- R. Dimova and R. Lipowsky, Adv. Mater. Interfaces, 2017, 4, 1600451 CrossRef.
- Y. Liu, J. Agudo-Canalejo, A. Grafmüller, R. Dimova and R. Lipowsky, ACS Nano, 2016, 10, 463–474 CrossRef CAS PubMed.
Footnote |
| † Electronic supplementary information (ESI) available: Sections S1–S9, Fig. S1–S18, and Table S1. See DOI: https://doi.org/10.1039/d4fd00184b |
| This journal is © The Royal Society of Chemistry 2025 |