Tailoring the impact behavior of polyamide 6 ternary blends via a hierarchical core–shell structure in situ formed in melt mixing
Rui Dou,
Chao Shen,
Bo Yin*,
Ming-bo Yang and
Bang-hu Xie
College of Polymer Science and Engineering, Sichuan University, State Key Laboratory of Polymer Materials Engineering, Chengdu, 610065 Sichuan, China. E-mail: yinbo@scu.edu.cn
First published on 23rd January 2015
Abstract
PA6-based ternary blends were prepared by melt blending of HDPE-g-MA and EPDM rubber, in which EPDM with a low and high viscosity was respectively selected to construct different core–shell morphologies. The core–shell morphology evolution was subsequently controlled via quiescent melt annealing. The relationship between the hierarchical core–shell structure and impact behaviors were studied systematically. Right after extrusion, the dispersed domains in low viscosity EPDM blends displayed a single core–shell structure while a multi-core structure with multiple HDPE-g-MA particles exists within the EPDM2 phase formed in high viscosity EPDM blends. During annealing, the lower viscosity EPDM blends displayed a core–shell size coarsening phenomenon without the core–shell morphological type changing. However, for higher viscosity EPDM blends, the initial multi-core structure evolved into a complete EPDM single-core structure after annealing. The notched Izod impact test indicated that the ternary blends with a multi-core structure had much higher impact toughness than that of other blends. The crack-initiation pattern, impact fractured surface and cross-section of the impact surface tests have been performed to study the impact mechanism. The results indicated that HDPE-g-MA particles within the multi core–shell structure could both enhance the core–shell particles strength and enlarge interfacial areas which avoided the rupture and debonding of multi-core particles. Also these core–shell particles could prevent propagation of the crack effectively, thus obtaining higher notched Izod impact strength.
I. Introduction
Polymer blending is one of the most important ways of achieving a desirable combination of properties which are often absent in pure polymers.1–5 As well, melt-blending allows for the generation of complex micro-structured multi-component blends. Also it is well known that the phase morphology is generally controlled not only by thermodynamic factors (interfacial tension, compatibility, composition ratio etc.6–9) but also by kinetic factors (viscosity ratio, mixing sequent, mixing of temperature, screw speed etc.10–13). More importantly, the properties of polymer blends are largely dependent on the phase morphology.1,5,10,14–16 Therefore, to achieve the best combination of mechanical properties, the key is to control the phase morphology of polymer blends.As is well known, the excellent toughness of high impact polystyrene (HIPS) depends on the formation of particular salami-like microstructure.17 The satisfactory toughening effect of poly (lactic acid) (PLA) often depends on the balance between interfacial compatibilization and crosslinking of the elastomer.18 Moreover, DR Paul et al. found that the rubber particle size,19,20 rubber type21 and crystallization behavior22 played a significant role on the mechanical properties of rubber-toughened polymer, which made significant contributions in the field of polymer toughening.
Recently, because multi-component polymer blends can demonstrate a wide variety of micro-structured morphologies with multiple interfaces present, more attention has been paid to the ternary polymer blends and many researchers have focus on optimizing the mechanical properties of blends containing core–shell microstructure dispersed in a polymer matrix.10,23–25 Luzinov et al.25 discussed the morphology and mechanical properties of ternary blends consisting of polystyrene matrix and polyolefin/styrene butadiene rubber core–shell dispersed phases. The ultimate mechanical properties of the blends showed some dependence on the stiffness of the PO core according to their conclusion. Fu et al.24 succeed to obtain a high toughness PP/EPDM/SiO2 blends via the formation of EPDM/SiO2 core–shell structure. The toughing mechanism they believed was that SiO2 agglomerate around EPDM increased the effective size of the rubber particles, making the stress fields around SiO2 particles served as a bridge between two neighboring rubber particles which resulting a higher impact strength. Zhuo Ke et al.23 studied the mechanical properties and the morphologies for ternary blends of a core–shell structure with a low density polyethylene core and an elastic polybutadiene shell in Polyamide 6 (PA6) matrix. For blend with 90 wt% PA and 10 wt% core–shell toughener, they found that there was only a 10% loss in modulus but a 10-fold increase in impact toughness compared to neat PA6.
However, majority previous works place more emphasis on the performance improvement for multi-components blends, toughening mechanism responsible for the core–shell structure toughened blends has not been comprehensively established so far. Concerning the toughening mechanism, one of the most important findings in polymer-toughing is known as the critical matrix ligament thickness (tc) theory, which is developed by Wu after an investigation on nylon 6/EPDM blends.26 They found only when the matrix ligament thickness (t) is smaller than tc could the shear yielding of matrix ligament exist and does a sharp brittle–ductile transition of blends occur. Over the years, theoretical27–29 and experimental30,31 studies show that the role of rubber on toughening of semi-crystalline polymers is mostly related to the cavitation of the filler. The high dilative stresses produced in front of a growing crack induce the formation of voids in or around the rubber particles. As a result, cavitated particles act then as stress concentrators around which the matrix can deform plastically and thus absorb much fracture energy.
In our previous work, Li et al.10,32 firstly discovered that the HDPE/EPDM-g-MA core–shell structure showed the outstanding superiority on the toughness improvement of PA6-based ternary blends compared to the rubber toughed PA6/EPDM blends. Also the difference of toughening mechanism between pure rubber particles in PA6/EPDM-g-MA binary blends and core–shell particles in PA6/EPDM-g-MA/HDPE ternary blends was discussed. They found that the fibrillation of core–shell particles in PA6/EPDM-g-MA/HDPE ternary blends, as “Particles Bridge”, can absorb fracture impact energy and sustain a higher stress so as to obtain the effect of strain hardening and prevent micro-crack further propagating. This result may have provided us with new insights into the toughening mechanism of ternary blend containing core–shell morphology.
However, what is still unknown is how core–shell structure is governed by the thermodynamic factors and kinetic factors and how the resulting changes in the microstructure of core–shell particles size and type influences impact behavior of the final blends. Up to now, the effect of core–shell particle size and type on impact behavior of PA6 blends and the associated toughening mechanism in relation to the micromechanical deformation process have been still not completely understood. With this aim in mind, in this study two EPDM with different viscosity were respectively employed in the ternary blends system to construct different core–shell morphology and the core–shell morphology evolution was subsequently controlled via quiescent melt annealing. The relation between hierarchical core–shell morphology and impact behavior of ternary blends was studied. Meanwhile, the mechanisms responsible for the changeable toughness of PA6/HDPE-g-MA/EPDM ternary blends with different core–shell morphology were comprehensively explored through DSC, OM and SEM tests.
II. Experimental section
2.1 Materials
Polyamide 6 (PA6), grade AKULON F136-C, was supplied by DSM, Netherland. Maleic anhydride grafted high density polyethylene (HDPE-g-MA), with the trademark TRD-100H was from Yizheng Siruida Plastic Company Ltd, China, had been grafted with 0.7 wt% maleic anhydride group. Two ethylene–propylene–diene monomers with different viscosity were used. EPDM 4770P (EPDM1) and EPDM 4725P (EPDM2) were both purchased from Dow. The properties of raw materials are listed in Table 1.| Polymers | Density at 25 °C (g cm−3) | η0 × 10−3 (Pa s) at 250 °C | Ethylene (wt%) ASTM D 3900 | ENB (wt%) ASTM D 6047 |
|---|---|---|---|---|
| a η0: zero shear viscosity. | ||||
| PA6 | 1.13 | 2.0 | — | |
| HDPE-g-MA | 0.93 | 15.0 | — | |
| EPDM1 | 0.88 | 1.5 | 70 | 4.9 |
| EPDM2 | 0.88 | 14.2 | 70 | 4.9 |
2.2 Sample preparation
PA6 was dried in a vacuum oven for 24 h at 80 °C before blending to minimize the effects of moisture. Ternary blends of PA6/HDPE-g-MA/EPDM1 (PHE1) and PA6/HDPE-g-MA/EPDM2 (PHE2), 70/15/15 based on weight fractions was prepared by adding the raw materials simultaneously into the feed cylinder and melt blended using a co-rotating twin-screw extruder (Leistritz ZSE-18) with a screw diameter of 30.8 mm and an L/D ratio of 40. The screw speed was set at 150 rpm and the melt-zone temperatures were set to be 250 °C. The average shear rate was estimated to be γ = 508.1 s−1 based on the type of extruder. The extrudate was then quenched in cold water and pelletized. After drying to remove the moisture for 12 h under vacuum at 80 °C, the pellets were molded to sheets and bars at 250 °C in a press under a pressure of 10 MPa for 3 min, and were followed annealed at 250 °C with pressure for 0 min, 10 min, 20 min, 40 min and 60 min, respectively, and then were cooled in the ambient air. In order to minimize the effect of degradation, the annealing test was conducted under a nitrogen atmosphere. The sheet was used for morphology observation and the bars with dimension of 78 mm × 10 mm × 4 mm (length × width × thickness) were used for notched Izod impact testing after machining notches (notch depth = 2.0 ± 0.1 mm). Then all the samples were kept at 23 °C for at least 48 h before testing. The as-obtained samples were labeled according to the blends components and annealing time. For example, the sample of PHE1-1 represented the PA6/HDPE-g-MA/EPDM1 blends after 10 min melt annealing. The two different blends annealing 0 min were labeled as PHE1-0 and PHE2-0, respectively.2.3 Interfacial tension measurement
Several methods can be used to evaluate the interfacial tension between molten polymers.33 In our previous work, the interfacial tensions were calculated by Wu's equation.34 However, it should be pointed that Wu's equation was improper to evaluate the interfacial tension for polymer pairs involving PA6 and maleic anhydride grafted copolymers (such as HDPE-g-MA in this paper) because the reaction between the carboxyl group in maleic anhydride of HDPE-g-MA and the amino end group of PA6 could reduce the interfacial tension of the two phases. Therefore, the interfacial tension for the pairs of polymers in this study was determined using the rheological behavior of their respective blend. The data were analyzed using Gramespacher and Meissner's35 analyses following the procedures reported elsewhere.36–38 The results concerning the interfacial tensions are listed in Table 2.| Polymer pairs | Interfacial tension (mN m−1) |
|---|---|
| PA6/HDPE-g-MA | 0.7 |
| PA6/EPDM1 | 11.7 |
| EPDM1/HDPE-g-MA | 0.7 |
| PA6/EPDM2 | 21.9 |
| EPDM2/HDPE-g-MA | 1.7 |
These interfacial tension data used to calculate the spreading coefficients are listed in Table 3. For ternary blends of PA6/HDPE-g-MA/EPDM1 and PA6/HDPE-g-MA/EPDM2 blends, it is predicted that both EPDM1 and EPDM2 phase should be completely engulfed by the HDPE-g-MA dispersed phase.
| Spreading coefficient (mN m−1) | |
|---|---|
| λ(HDPE-g-MA/EPDM1) | 10.3 |
| λ(HDPE-g-MA/EPDM2) | 19.5 |
2.4 Rheological measurement
Steady-shear viscosity measurements of homopolymers were carried out using a RH7 high press capillary rheometer (Rohlin, England) under a temperature of 250 °C in a shear rate range from 20–2000 s−1. The measured shear viscosities of homopolymers are shown in Fig. 1. | ||
| Fig. 1 Shear viscosity as a function of shear rate at 250 °C for EPDM1, EPDM2, HDPE-g-MA and PA6. The dashed lines represent the average shear rate during mixing. | ||
2.5 Optical microscope (OM) observation
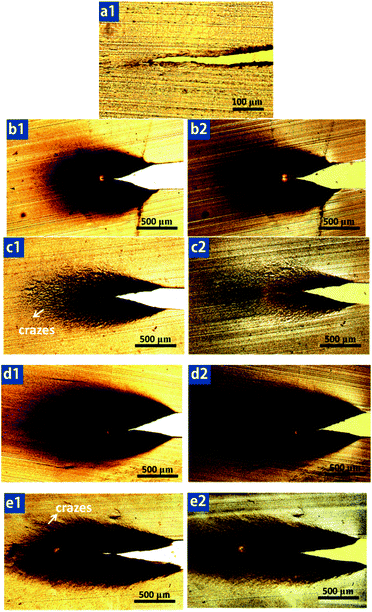
In order to examine the crack initiation stage, an arrested crack in the specimen was produced with an Izod impact tester. In detail, the pendulum was raised at an angle of 45 °C from the vertical and then released to hit the specimen. With appropriately chosen impact energy of about 1 J, the specimen was not broken into two halves, and the propagating crack stopped in the interior of the specimen. The slices with a thickness of 30 μm were cut along the crack propagation direction but perpendicular to the fracture surface. The morphologies of these thin sections were examined using Olympus BX51 polarizing optical microscopy (Olympus Co., Tokyo, Japan) under both bright field and crossed-polar conditions.2.6 Morphology characterization
A JEOL JSM-5900LV scanning electron microscopy (SEM, JEOL, Japan) at a 20 kV accelerating voltage was used to observe the phase morphology of the blends. The samples were cryo-fractured in liquid nitrogen and the fractured surfaces were sputtered with gold before observation. Moreover, a transmission electron microscope (TEM) (Model: FEI-Tecnai G2F20, USA) was also used to reveal the phase morphology of ternary blends. Ultra-thin sections having minimum thickness of 60 nm were cut using an ultra-microtome (Model: Leica-EM FC6, German) under the condition of sample temperature −80 °C. The sections were stained with OsO4 for 10 min in order to enhance contrast.Quantitative analysis of the dispersed morphology was performed using image analysis of Image-Pro Plus 6. At least 300 dispersed domains were measured to estimate number-average diameter (dn) for each sample. Corrections to the particles size were performed using Schwartz–Saltykov method.39
2.7 Characterization of crystal structure
The thermal analysis of the samples was conducted using a TA Q20 differential scanning calorimeter (New Castle, U.S.A), calibrated by indium. Samples of about 5 mg were heated to 250 °C at a rate of 10 °C min−1 under a nitrogen atmosphere. Moreover heating curves were recorded for analysis. The degree of crystallinity was calculated from heat of fusion using 190 J g−1 as the heat of fusion of 100% crystalline PA6.402.8 Mechanical tests
The Izod notched impact strength of the specimens was measured with a VJ-40 Izod machine according to ASTM D256-04. At least seven specimens were tested and the average values were reported.III. Results and discussion
3.1 Morphology of PA6/HDPE-g-MA/EPDM1 and PA6/HDPE-g-MA/EPDM2 blends after immediately extruding
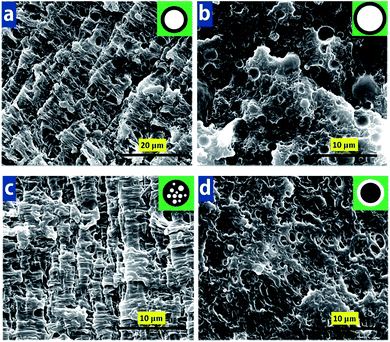
Fig. 2 shows the phase morphology of PA6/HDPE-g-MA/EPDM for the EPDM1 and EPDM2 right after extruding. The interface between dispersion phase and PA6 matrix is very obscure both in the two blend system (seen in Fig. 2a and b). This is attributed to the reaction between the carboxyl group in maleic anhydride of HDPE-g-MA and the amino end group of PA6,41 which lead to a good compatibility between PA6 and HDPE-g-MA. In addition, because of the presence of ethylene chain segment in EPDM, HDPE-g-MA and EPDM is semimiscible, therefore the phase interface between HDPE-g-MA and EPDM was very indistinct. Combining the micrographs viewed from Fig. 2c and d, the phase morphology is great different between PA6/HDPE-g-MA/EPDM1 and PA6/HDPE-g-MA/EPDM2 blends. Typical single core–shell morphology with HDPE-g-MA phase encapsulated by EPDM1 was observed in the PA6/HDPE-g-MA/EPDM1 blends, while multi-core morphology with HDPE-g-MA particles within EPDM2 phase was found in the PA6/HDPE-g-MA/EPDM2 blends. Additionally, the formation of core–shell structure can also been confirmed by TEM, the dark cores in Fig. 2e were believed to be the HDPE-g-MA phase, and the encapsulated shell was EPDM1 phase. Fig. 2d of PHE2 ternary blends displayed “salami”-like substructure (multi-core structure), the dark inner inclusions HDPE-g-MA phase resided in the gray EPDM2 dispersed phase domains. The results cannot be explained through interfacial tension theory (shown in Table 3). Based on the results reported by Sundararaj et al.,42,43 they assigned this phenomenon to a difference in softening temperature between both components. The lower melting component will always first encapsulate the higher melting component to form the matrix phase. In our present study, the formation of HDPE-g-MA phase encapsulated by both EPDM1 and EPDM2 can be attributed to a lower softening temperature of EPDM compared with HDPE-g-MA.Considering the different core–shell droplets type seen from Fig. 2c and d, it seems that the viscosity difference of EPDM1 and EPDM2 plays a crucial role on the formation of phase morphology. Fig. 1 clearly demonstrates that EPDM2 has a higher shear viscosity than that of EPDM1 during melt mixing. And based on the theory of viscosity ratio, highly viscous matrices enhance droplet break-up due to their efficient shear stress transfer towards the dispersed phase and the higher dispersive forces acting on it; low viscous matrices often act as a lubricant for the dispersed phase reducing droplet break-up. Therefore, EPDM2 can transfer higher shear stresses to make HDPE-g-MA broke into small particles forming multi-core morphology compared with EPDM1. In the subsequent extrusion, the HDPE-g-MA subinclusions were immobilized by the highly viscous EPDM2 phase. The immobilization of HDPE subinclusions in the EPDM2 shell is also encouraged by the relatively low HDPE/EPDM-g-MA interfacial tension (shown in Table 2), this is also consist with the results obtained by Favis.44
3.2 Morphology evolution during quiescent annealing
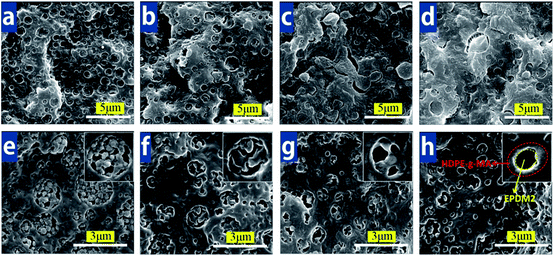
The morphology of both PHE1 and PHE2 after immediately extruding does not consistent with its thermodynamic equilibrium morphology. Therefore, quiescent melt annealing test was carried out. Fig. 3 shows the evolution of the microstructure during annealing. Overall, many interesting features can be noticed from Fig. 3. The first observed phenomenon is an unchanged HDPE-g-MA/EPDM1 core–shell type during annealing for PA6/HDPE-g-MA/EPDM1 blend system. Only the dispersed phase enlarges continuously and gradually with annealing time. At the beginning, the average dispersed domain size is 0.49 μm. After undergoing 60 min annealing, the droplets size increases to 0.90 μm. This phase coarsening behavior during annealing has been reported by many other researches.45–48 For the ternary blend of EPDM2 system seen through Fig. 3e–h, with annealing time increasing, HDPE-g-MA subinclusions tend to coarsen and migrate to the PA6/EPDM2 interface. After 40 min of quiescent annealing, most HDPE-g-MA phase has migrated to the PA6 matrix boundary (seen in Fig. 3g) before inverting to an almost complete HDPE-g-MA/EPDM2 shell–core structure (EPDM2 phase located within the HDPE-g-MA region) after 60 min (shown in Fig. 3h). Meanwhile, the composite droplets size decreases from 0.54 μm to 0.40 μm with annealing time. For EPDM2 system, the diameter decrease of composite droplets is likely caused by the reduction of the interfacial tension as well as the volume relaxation of dispersed phase during melt annealing.Finally, a better understanding of Fig. 3 for the morphology evolution of PA6/HDPE-g-MA/EPDM blend system during annealing is summarized schematically in Fig. 4. The EPDM1 system displayed a size coarsening phenomenon of dispersed phase without core–shell morphological type changed during annealing. However, for EPDM2 system, the initial HDPE-g-MA multi-core morphology evolved into a complete EPDM2 single-core structure after annealing. Based on the results of morphology evolution, the next part will be focused on the understanding of structure–property relationship for both the two systems.
3.3 The notched impact strength
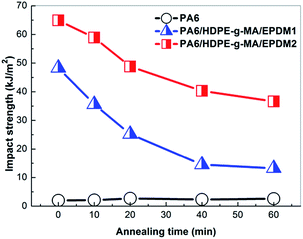
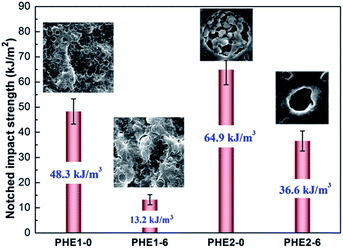
The impact property of the blends is exhibited in Fig. 5. Impact strength of PA6 keeps almost constant with annealing time. The increase of annealing time could reduce the toughness of the EPDM1 and EPDM2 ternary system markedly, and a ductile–brittle transition behavior could be noticed. But interestingly, the impact strength of the EPDM2 system samples displays a higher value than that of the EPDM1 system samples during the whole annealing process. It is believed that the different core–shell microstructure between PA6/HDPE-g-MA/EPDM1 and PA6/HDPE-g-MA/EPDM2 blends during annealing is responsible for this phenomenon. And to our best knowledge, the relationship between core–shell morphology and toughness has never been comprehensively studied before, Here, seen from Fig. 6 we choose four typical samples with different core–shell microstructure (small rubber shell particle, larger rubber shell particle, multi-core particle and HDPE-g-MA shell particle) as our research focus to investigate the toughening mechanism in the subsequent section.3.4 Toughening mechanism
 | (1) |
Fig. 8 shows the crystallinity and melting point of the EPDM1 and EPDM2 system samples. The PA6 crystallinity in all ternary blends was at a constant level of 30%, and the PA6 melting point was almost 221 °C which indicates that annealing has no effect on the inherent properties of PA6 phase. In the case of our ternary blend system, therefore, the difference in the PA6 crystallinity hardly accounted for the remarkable dependence of impact toughness on PA6/HDPE-g-MA/EPDM ternary blends. Moreover, the constant melting temperature indicates no degradation occurs during annealing for ternary blends.
For PHE2 system, the size of dispersed phase fluctuated around 0.5 μm calculated from Fig. 3e and f, which indicated that the changed impact strength is not caused by the effect of dispersed phase particle size.
3.5 The relation of structure and property
It is generally accepted that microvoiding is the essential step which triggers matrix shear yielding, thereby resulting in considerable energy dissipation.60–62 Microvoiding can occur either by internal cavitation or debonding.63–65 After clearly observation of Fig. 13a and c, the formation mechanism of micro-voids for PHE1-0 and PHE2-0 can be attributed to debonding and internal cavitation, respectively. Moreover, the size of the micro-voids in the PHE1-0 blends is rather smaller than that of PHE2-0.Fig. 14 shows a sketch for the toughening mechanism changes of PA6/HDPE-g-MA/EPDM blends in different morphologies. As is clearly observed in Fig. 14a, due to the smaller size of core–shell particles (dn = 0.49 μm), the stress fields around particles seem to serve as a bridge between two neighboring core–shell particles and the stress yield around individual particle would interfere with each other resulting the matrix yielding would propagate and pervade over the entire matrix, and then the blend would be tough. In contrast, for the PHE1-6 blend, because average core–shell particle size increases to 0.90 μm, which makes it far out of optimum particle size (dn = 0.2–0.5 μm) for toughening PA6. It has been reported by numerous researchers that only the size of the impact modifier particles exceeds a critical value the crazing of the matrix around them can be effectively initiated.20,66,67 But it should be noted that if the particles are too large, the cracks quickly passed through the weak interfaces and induced premature crack propagation due to the coalescence of crazes, following craze initiation and propagation at the early stage of the impact testing, and consequently, the impact specimens were unable to develop a substantial yield zone before the crack growth from the notch tip brought the test to an end, eventually giving the PHE1-6 blends inferior impact toughness.
 | ||
| Fig. 14 A sketch showing the toughening mechanism changes for different morphologies. (a) PHE1-0, (b) PHE1-6, (c) PHE2-0, (d) PHE2-6. The white arrow represents the crack-propagation direction. | ||
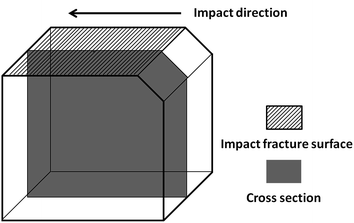
For PHE2-0 with multi-core structure, large amount of HDPE-g-MA particles embed in the EPDM2 phase increases the interface area between HDPE-g-MA and EPDM which is larger than that for single-core structure in PHE1-0. Based on the relatively good miscibility of HDPE-g-MA and EPDM (shown in Fig. 2b), it can be concluded that multi-core structure with larger interface area has a higher strength than that for single-core structure. Also, HDPE-g-MA particles in the EPDM2 phase serving as “fillers” will enhance the multi-core structure strength synergistically. Then for PHE2-0, on one hand, an increase in the core–shell structure strength can bear a higher tensile stress during impact, avoid the rupture and debonding of multi-core particles and allow the expansion of the local plastic zone until the critical stress level is reached, causing large-area stress yielding of the matrix. On the other hand, the deformation of HDPE-g-MA particles could produce more micro-voids and then caused stress yielding. Meanwhile, the fibrotic HDPE-g-MA (shown in Fig. 13c) can absorb fracture energy and the enlarged interfacial area can prevent propagation of the crack. The SEM micrographs in Fig. 14 show that the thickness of shear strips for PHE2-0 (d = 2.1 μm) is smaller than that (d = 11.1 μm) for PHE1-0, indicating a higher density of strips on the same surface area, which is corresponding to better effect of crack propagation prevention. This is consist with its highest impact strength. For PHE2-6, it should be pointed that a reversing core–shell structure with HDPE-g-MA shell and EPDM core was achieved after annealing for the morphology of PHE2-6. Fig. 14d shows the fracture feature for PHE2-6. Due to the lower strength of EPDM2 compared with HDPE-g-MA, this type of core–shell particles maybe unstable during impact and could rupture when the critical stress level is reached, hence only cavitations can be found in the fracture surface without any sign of stress yielding, indicating lower impact strength.
Based on the above discussion, by considering that shear yielding is far more effective than crazing in energy dissipation, multi-core structure, formed during melt mixing, provides a deep understanding of elastomer toughened polymer blends. However, the effect of core number, size and properties on the performance of PA6 blends has not been widely investigated in this work which is not neglected. Further work is now being undertaken in our group.
IV. Conclusions
The hierarchical core–shell structure of PA6/HDPE-g-MA/EPDM ternary blends was successfully controlled using the quiescent melt annealing method. The effect of hierarchical core–shell structure evolution on the notch impact strength of the blends is tremendous, of which multi-core structure gives the blends much higher impact strength than other structures. The OM observation of crack-initiation region manifests that multi-core structure can not only effectively trigger massive micro-cracks, but can remarkably terminate the propagation of cracks. The correlation between particle size and impact toughness revealed that there existed an optimum particle size for PA6 toughening in this ternary blend system. It appeared that the crystallization of PA6 was not a contributing factor in achieving the super toughness in the ternary blends. The morphology of impact-fractured surface and cross sections underneath the impact-fractured surface indicate that multi-core structure with larger interface area and higher interfacial adhesion can bear a higher tensile stress during impact, avoid the rupture and debonding of multi-core particles and allow the expansion of the local plastic zone until the critical stress level is reached, causing large-area stress yielding of the matrix. Moreover, the deformation of HDPE-g-MA particles can also produce more micro-voids to dissipate fracture impact energy and then gives higher impact strength.Acknowledgements
The authors gratefully acknowledge the financial support from the National Natural Science Foundation of China (Contract no. 51273219 and 5142106), the National Key Basic Research Program of China (973 Program, no. 2012CB025902), the Fundamental Research Funds for the Central Universities (no. 2013SCU04A03) and the Foundation of State Key Laboratory of Polymer Materials Engineering (Grant no. sklpme2014-3-12).Notes and references
- D. R. Paul, J. W. Barlow and H. Keskkula, Encyclopedia of polymer science and engineering, Wiley, New York, 1988 Search PubMed.
- R. A. Kudva, H. Keskkula and D. R. Paul, Polymer, 2000, 41, 239–258 CrossRef CAS.
- H. G. Fang, F. Jiang, Q. H. Wu, Y. S. Ding and Z. G. Wang, ACS Appl. Mater. Interfaces, 2014, 6, 13552–13563 CAS.
- M. L. Robertson, M. J. Paxton and M. A. Hillmyer, ACS Appl. Mater. Interfaces, 2011, 3, 3402–3410 CAS.
- D. Ponnamma, K. K. Sadasivuni, M. Strankowski, Q. P. Guo and S. Thomas, Soft Matter, 2013, 9, 10343–10353 RSC.
- P. L. Corroller and B. D. Favis, Polymer, 2011, 52, 3827–3834 CrossRef PubMed.
- S. Ravati and B. D. Favis, Polymer, 2010, 51, 4547–4561 CrossRef CAS PubMed.
- X. Q. Liu, R. H. Li, R. Y. Bao, W. R. Jiang, W. Yang, B. H. Xie and M. B. Yang, Soft Matter, 2014, 10, 3587–3596 RSC.
- S. Ravati and B. D. Favis, Polymer, 2013, 54, 3271–3281 CrossRef CAS PubMed.
- L. P. Li, B. Yin, Y. Zhou, L. Gong, M. B. Yang, B. H. Xie and C. Chen, Polymer, 2012, 53, 3043–3051 CrossRef CAS PubMed.
- K. Wang, F. Chen, Z. M. Li and Q. Fu, Prog. Polym. Sci., 2014, 39, 891–920 CrossRef CAS PubMed.
- J. P. Cao, X. D. Zhao, J. Zhao, J. W. Zha, G. H. Hu and Z. M. Dang, ACS Appl. Mater. Interfaces, 2013, 5, 6915–6924 CAS.
- R. Dou, W. Wang, Y. Zhou, L. P. Li, L. Gong, B. Yin and M. B. Yang, J. Appl. Polym. Sci., 2013, 129, 253–262 CrossRef CAS.
- M. Umeda and I. Uchida, Langmuir, 2006, 22, 4476–4479 CrossRef CAS PubMed.
- K. Y. Zhang, A. K. Mohanty and M. Misra, ACS Appl. Mater. Interfaces, 2012, 4, 3091–3101 CAS.
- Y. Lin, H. B. Chen, C. M. Chan and J. S. Wu, Macromolecules, 2008, 41, 9204–9213 CrossRef CAS.
- G. E. Molau and H. Keskula, J. Polym. Sci., Part A-1: Polym. Chem., 1966, 4, 1595–1607 CrossRef CAS.
- H. Z. Liu, L. Guo, X. J. Guo and J. W. Zhang, Polymer, 2012, 53, 272–276 CrossRef CAS PubMed.
- A. J. Oshinski, H. Keskkula and D. R. Paul, Polymer, 1992, 33, 268–283 CrossRef CAS.
- C. B. Bucknall and D. R. Paul, Polymer, 2009, 50, 5539–5548 CrossRef CAS PubMed.
- D. M. Laura, H. Keskkula, J. W. Barlow and D. R. Paul, Polymer, 2003, 44, 3347–3361 CrossRef CAS.
- J. J. Huang, H. Keskkula and D. R. Paul, Polymer, 2006, 47, 639–651 CrossRef CAS PubMed.
- Z. Ke, D. Shi, J. H. Yin, R. Li and Y. W. Mai, Macromolecules, 2008, 41, 7264–7267 CrossRef CAS.
- H. Yang, Q. Zhang, M. Guo, C. Wang, R. N. Du and Q. Fu, Polymer, 2006, 47, 2106–2115 CrossRef CAS PubMed.
- I. Luzinov, C. Pagnoulle and R. Jerome, Polymer, 2000, 41, 7099–7109 CrossRef CAS.
- S. Wu, Polymer, 1985, 26, 1855–1863 CrossRef CAS.
- K. Dijkstra and G. H. T. Bolscher, J. Mater. Sci., 1994, 29, 4286–4293 CrossRef CAS.
- A. Lazzeri and C. B. Bucknall, Polymer, 1995, 36, 2895–2902 CrossRef CAS.
- P. A. Tzika, M. C. Boyce and D. M. Parks, J. Mech. Phys. Solids, 2000, 48, 1893–1929 CrossRef CAS.
- R. J. M. Borggreve, R. J. Gaymans, J. Schuijer and J. F. I. Housz, Polymer, 1987, 28, 1489–1496 CrossRef CAS.
- A. van der Wal and R. J. Gaymans, Polymer, 1999, 40, 6067–6075 CrossRef CAS.
- B. Yin, L. P. Li, Y. Zhou, L. Gong, M. B. Yang and B. H. Xie, Polymer, 2013, 54, 1938–1947 CrossRef CAS PubMed.
- N. R. Demarquette, A. M. C. Souza, G. Palmer and P. H. P. Macaubas, Polym. Eng. Sci., 2003, 43, 670–683 CAS.
- S. Wu, Polymer interface and adhesion, Marcel Dekker, New York, 1982 Search PubMed.
- H. Gramespacher and J. Meissner, J. Rheol., 1992, 36, 1127–1141 CrossRef CAS.
- A. M. C. Souza and N. R. Demarquette, Polymer, 2002, 43, 1313–1321 CrossRef CAS.
- A. M. C. Souza and N. R. Demarquette, Polymer, 2002, 43, 3959–3967 CrossRef CAS.
- P. H. P. Macaubas and N. R. Demarquette, Polymer, 2001, 42, 2543–2554 CrossRef CAS.
- S. A. Saltikov, Proceedings of the second international congress for stereology, Springer-Verlag, New York, 1967, pp. 163–173 Search PubMed.
- I. Campoy, M. A. Gomez and C. Marco, Polymer, 1998, 39, 6279–6288 CrossRef CAS.
- J. Roeder, R. V. B. Oliveira, M. C. Goncalves, V. Soldi and A. T. N. Pires, Polym. Test., 2002, 21, 815–821 CrossRef CAS.
- U. Sundararaj, C. W. Macosko and C. K. Shih, Polym. Eng. Sci., 1996, 36, 1769–1781 CAS.
- U. Sundararaj, Macromol. Symp., 1996, 112, 85–89 CrossRef CAS.
- J. Reignier and B. D. Favis, AIChE J., 2003, 49, 1014–1023 CrossRef CAS.
- P. L. Corroller and B. D. Favis, Polymer, 2011, 52, 3827–3834 CrossRef PubMed.
- Y. Chen, Y. Chen, W. Chen and D. C. Yang, Eur. Polym. J., 2007, 43, 2999–3008 CrossRef CAS PubMed.
- I. Fortelný, J. Jůza, T. Vacková and M. Šlouf, Colloid Polym. Sci., 2011, 289, 1895–1903 Search PubMed.
- L. Zhu, X. H. Xu and J. Sheng, J. Polym. Res., 2011, 18, 1269–1275 CrossRef CAS PubMed.
- O. K. Muratoglu, A. S. Argon, R. E. Cohen and M. Weinberg, Polymer, 1995, 36, 921–930 CrossRef CAS.
- J. J. Huang, H. Keskkula and D. R. Paul, Polymer, 2004, 45, 4203–4215 CrossRef CAS PubMed.
- J. J. Huang, H. Keskkula and D. R. Paul, Polymer, 2006, 47, 624–638 CrossRef CAS PubMed.
- J. J. Huang and D. R. Paul, Polymer, 2006, 47, 3505–3519 CrossRef CAS PubMed.
- A. J. Oshinski, H. Keskkula and D. R. Paul, Polymer, 1992, 33, 268–283 CrossRef CAS.
- A. J. Oshinski, H. Keskkula and D. R. Paul, J. Appl. Polym. Sci., 1996, 61, 623–640 CrossRef CAS.
- A. J. Oshinski, H. Keskkula and D. R. Paul, Polymer, 1996, 37, 4909–4918 CrossRef CAS.
- A. Afshar, I. Massoumi, R. Lesan-Khosh and R. Bagheri, Mater. Des., 2010, 31, 802–807 CrossRef CAS PubMed.
- C. Z. Geng, J. J. Su, S. J. Han, K. Wang and Q. Fu, Polymer, 2013, 54, 3392–3401 CrossRef CAS PubMed.
- F. Luo, J. Wang, H. Bai, K. Wang, H. Deng, Q. Zhang and Q. Fu, Mater. Sci. Eng., A, 2011, 528, 7052–7059 CrossRef CAS PubMed.
- A. Dasari, Q. X. Zhang, Z. Z. Yu and Y. W. Mai, Macromolecules, 2010, 43, 5734–5739 CrossRef CAS.
- A. F. Yee, D. M. Li and X. W. Li, J. Mater. Sci., 1993, 28, 6392–6398 CrossRef CAS.
- G. M. Kim and G. H. Michler, Polymer, 1998, 39, 5689–5697 CrossRef CAS.
- G. M. Kim and G. H. Michler, Polymer, 1998, 39, 5699–5703 CrossRef CAS.
- R. J. M. Borggreve, R. J. Gaymans and H. M. Eichenwald, Polymer, 1989, 30, 78–83 CrossRef CAS.
- D. Dompas, G. Groeninckx, M. Isogawa, T. Hasegawa and M. Kadokura, Polymer, 1995, 36, 437–441 CrossRef CAS.
- H. J. Sue, J. Huang and A. F. Yee, Polymer, 1992, 33, 4868–4871 CrossRef CAS.
- E. Piorkowska, A. S. Argon and R. E. Cohen, Macromolecules, 1990, 23, 3838–3848 CrossRef CAS.
- S. Y. Hobbs, Polym. Eng. Sci., 1986, 26, 74–81 CAS.
| This journal is © The Royal Society of Chemistry 2015 |


