Oxidative cascade reactions yielding polyhydroxy-theaflavins and theacitrins in the formation of black tea thearubigins: Evidence by tandem LC-MS†
Nikolai
Kuhnert
*a,
Michael N.
Clifford
b and
Anja
Müller
a
aFunctional Materials and Nanomolecular Science Research Centre, Jacobs University Bremen, 28759, Bremen, Germany. E-mail: n.kuhnert@jacobs-university.de; Tel: +0049 421 200 3120
bCentre for Nutrition and Food Safety, Faculty of Health and Medical Sciences, The University of Surrey, Guildford, GU2 7XH, United Kingdom
First published on 14th October 2010
Abstract
LC-MSn and direct infusion-MSn have been applied for the first time to the characterisation of crude thearubigins isolated from black tea. The data generated have been used to test two hypotheses of thearubigin structure: (i) that a significant fraction of the thearubigins consist of polyhydroxylated derivatives of the better-known catechin dimers (theaflavins, theaflavin mono- and di-gallates, theacitrins) in redox equilibrium with their associated quinones; and (ii) that a significant fraction of the thearubigins consist of dicarboxylic acids generated by oxidative cleavage of aromatic diols. The data were consistent with the polyhydroxylation hypothesis and did not support the dicarboxylic acid hypothesis. Evidence is presented for the presence in crude thearubigins of at least 29 hydroxylated theaflavins (with between one and six oxygen insertions), at least 12 theaflavin mono-gallates (with between one and six oxygen insertions), at least nine theaflavin di-gallates (with between one and four oxygen insertions), and at least ten theacitrin mono-gallates (with between one and four oxygen insertions). Evidence is also presented for at least ten mono- or di-quinone forms of the parent compounds and hydroxylated derivatives in each of these homologous series. A general method for the analysis of complex mixtures by tandem LC-MS is furthermore introduced and established.
Introduction
Black tea is, second only to water, the most consumed beverage globally with an average per capita consumption of around 550 ml a day. Annual production of tea leaves reached a record high in 2008 with a global harvest of 3.75 Mt.1 Production of dried tea comprises 20% green, 2% oolong and the remainder black. In January 2006, tea prices were US$1.56 kg−1 and had increased to a record high in June 2008 of US$3.40 kg−1, making black tea one of the most economically important agricultural products.1,2 Despite its importance, the majority of black tea's chemical composition remains unresolved if not mysterious.Black tea is produced from the young green shoots of the tea plant (Camellia sinensis), which are converted to black tea by a manufacturing process, in which the green tea shoots are so-called fermented. Within the fermentation, an enzymatic oxidation process, the major chemical constituents of the green tea leaves, flavan-3-ols or catechins 1–6, mainly epigallocatechin 3 and its gallate ester 1, that account for 10–25% of the dry weight of a fresh green tea leaf, (representative structures shown in Scheme 1) are consumed and chemically transformed. These substrates are oxidised and extensively transformed into novel dimeric, oligomeric and polymeric compounds, few of which have been fully characterised. This material was originally referred to as oxytheotannin.3 Selected well characterised dimeric structures such as theacitrins 7, theaflavins 8–11, theasinensins 12 and theanaphthoquinones 13 are shown in Scheme 1.
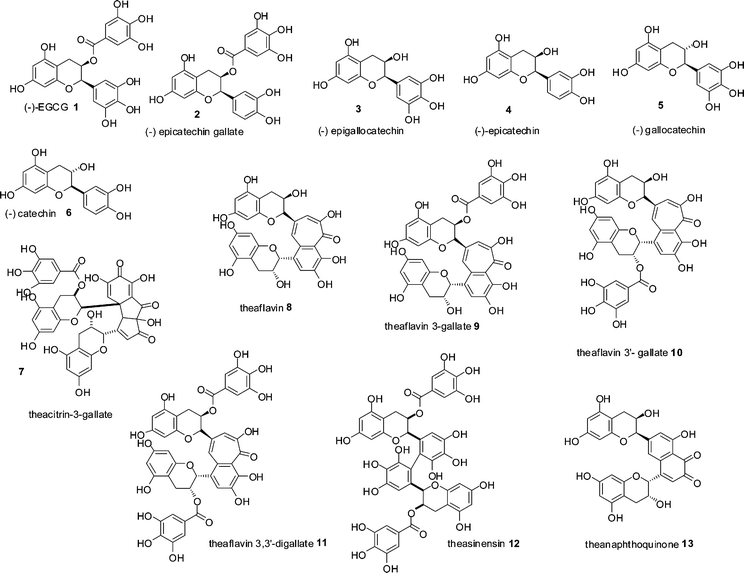 | ||
| Scheme 1 Structures of green tea catechin derivatives 1–6 and structures of formal dimers of catechins 7–13 found in black tea.15 | ||
Oxytheotannin was subsequently divided into the reddish-orange, ethyl-acetate-soluble theaflavins, and the brownish water-soluble (or ethyl acetate-insoluble) thearubigins. Although first observed in 1959,4 the term thearubigins was not introduced until 1962,5 but even 50 years later these oligomeric and polymeric transformation products remain poorly characterised.
The components of black tea can be divided into two classes. Firstly, a series of well characterised small molecules, including alkaloids such as theobromine and caffeine, carbohydrates and amino acids, and a series of glycosylated flavonoids, that together account for 30–40% of the dry mass of a typical black tea infusion. Secondly, the heterogeneous fraction of polyphenolic fermentation products that account for the remaining 60–70%. These fermentation products are again divided in two distinct classes of compounds: Firstly the orange-red theaflavins containing benztropolone ring systems and secondly the heterogeneous fraction of the thearubigins (TRs) constituting between 60 and 70% of the dry mass of an average black tea infusion.6 Substantial progress has been made in the isolation and structure elucidation of the theaflavins over the last 40 years with many compounds of this class being isolated and identified, whereas the structures of the thearubigins, that were discovered in 19594,7 and named as such by Roberts in 19628 still retain their mysterious nature and remain a challenge for scientists. Two recent reviews, one by Harbowy and Balentine and one by Haslam summarise the state of knowledge on the chemical structure of the TRs.9,10 It is commercially important to elucidate the chemical structure of the TRs and hence their function for a variety of reasons.
Structural characterisation will improve the understanding of the components contributing to taste, colour and shelf-life of black tea based products. Furthermore structure elucidation of the TR fraction will allow the identification of chemical compounds responsible for any of the various and wide ranging beneficial biological activities arising from the human consumption of black tea and black tea based products.11
We have reported on the characterisation of black tea thearubigins by a series of standard and advanced analytical techniques including ESI-FT-ICR mass spectrometry and MALDI-TOF mass spectrometry. Our observations and conclusions were as follows.12–14
Thearubigins comprise several thousand compounds, an order of magnitude higher than previously expected, with around 10 000 molecular ions resolved in a single direct infusion ESI-FTICR MS experiment. Around 1500 molecular formulas have been assigned using these data.12
The unusual Gaussian shaped hump characteristic of thearubigin chromatograms can be explained by the large number of compounds present combined with peak broadening arising from aromatic–aromatic interactions, non-covalent interactions such as hydrogen bonding, and dis-equilibration–re-equilibration during chromatography.
Data obtained by ESI-FT-ICR and MALDI-TOF mass spectroscopy, Diffusion NMR, AFM and size exclusion chromatography, demonstrate that components of the thearubigins do not exceed 2100 Da and are therefore unlikely to contain oligomers comprising more than seven catechins units.
Although not identical, thearubigins from 15 different sources are remarkably similar with respect to all their spectroscopic fingerprints.
Petrolomics style as well as novel data interpretation strategies were adopted and developed to visualise these enormously complex data. Several homologous series were detected, with mass increments corresponding to oxygen insertion, loss of hydrogen, and addition of gallate, hexose, deoxy-hexose, and, particularly, water increments.
This interpretation permitted the formulation of an experimentally based hypothesis to explain the formation and structure of approximately 90% of the thearubigins, whose molecular formula has been assigned, with a mass below 1000 Da, which we have named “oxidative cascade hypothesis”.12
The hypothesis assumes three levels of chemical reaction types producing the thousands of compounds observed within the thearubigin fraction.
Level 1: The six catechin building blocks oligomerise using the four types of dimerisation mechanisms previously described in the literature. These four mechanisms comprise a type I mechanism (theasinensin type), a type II mechanism (theaflavin type) a type III mechanism (theacitrin type) and a type IV mechanism (theanaphthoquinone type). The rules of connectivities have been discussed by Drynan et al. in detail.15 At this level oligomers comprising two to seven catechin units or two to four gallated catechin units are formed.
Level 2: Any oligomer reacts via an ortho-quinone intermediate with water as the most abundant nucleophile in the fermenting tea leaf. In this reaction an aromatic hydrogen is replaced by a phenolic OH group, thus formally an oxygen is inserted into an aromatic CH group until finally all aromatic hydrogens are replaced by phenolic OHs. Compounds like polyhydroxytheaflavins or polyhydroxytheacitrins are formed. This level represents a true oxidative cascade reaction, since with the introduction of a new phenolic OH group the aromatic nuclei become more electron rich and hence with each oxygen insertion step easier to oxidise. Regioisomers are possible at each step of oxygen insertion.
Level 3: Any of the polyhydroxylated oligomers of catechins are in a redox equilibrium with their corresponding quinone structures (both ortho- and para-quinoid structures are feasible). Again with increasing numbers of phenolic OHs groups present this oxidation step will be favoured. Evidence for quinone structures in the TR fraction were clearly obtained using mass spectrometry and Circular Dichroism spectroscopy.
This contribution reports our testing of this hypothesis using, in particular structures produced at levels 2 and 3 by direct infusion MSn and LC–MSn experiments
Materials and methods
Chemicals and reagents
(–)-Epicatechin, (–)-EGCG, theaflavin, theaflavin-3-gallate, theaflavin-3′-gallate and theaflavin-3,3′-digallate and the 15 world teas were provided by Unilever, Colworth (UK). All other chemicals and reagents were purchased from the Sigma Aldrich Company.Preparation of thearubigins
Freshly ground black tea leaves (8 g) were added to 150 ml freshly boiled water and kept for 10 min in a Thermos flask, which was inverted every 30 s. The flask contents were filtered through a Whatman No 4 filter paper to remove the leaves, and the remaining brew allowed to cool to room temperature. Caffeine sufficient to achieve 20 mM was added to the brew, stirred to ensure dissolution, and allowed to stand at 4 °C for two hours, and centrifuged at 23,300 × g for 20 min. The resulting precipitate was recovered and suspended in boiling water, and partitioned against aliquots of ethyl acetate (40 ml) until no further color was extracted (usually ×5).The ethyl acetate-supernatant was removed and evaporated to dryness under nitrogen below 35 °C, and the residue (TF fraction) recovered in 10 ml distilled water. The aqueous phase was partitioned at 80 °C against two volumes of chloroform, the decaffeinated liquid stored overnight at −80 °C, and freeze-dried. The freeze-dried material (TR fraction) was stored at −20 °C until required and reconstituted as required for the analysis. The thearubigins were obtained as orange to light brown fluffy powders. Individual yields are stated in Table 1.
| Sample number | Black tea leaf description | Yield [mg, %] | Number of well-resolved peaks in negative mode LC-MS |
|---|---|---|---|
| I | Kenya | 560, 7 | 15 |
| II | Darjeeling | 780, 1 | 18 |
| III | Lipton Blend | 401, 5 | 22 |
| IV | Vietnam Dust | 489, 5 | 28 |
| V | Turkish | 687 8 | 30 |
| VI | Tiger Hill | 783, 1 | 29 |
| VII | Kenyan BP1 | 621, 8 | 22 |
| VIII | Java Broken | 710, 9 | 27 |
| IX | Indian BB21 | 410, 5 | 25 |
| X | Darjeeling White Leaf | 567, 6 | 25 |
| XI | Ceylon UVA | 490, 5 | 24 |
| XII | Ceylon Standard EBOP | 601, 7 | 27 |
| XIII | Ceylon GMD | 730, 8 | 19 |
| XIV | Assam | 480, 6 | 26 |
| XV | Argentine BOP | 510, 6 | 30 |
LC-MSn
The LC equipment (Agilent 1100 series) comprised a binary pump, an auto sampler with a 100 μL loop, and a DAD detector with a light-pipe flow cell (recording at 400 and 254 nm and scanning from 200 to 600 nm). This was interfaced with an ion-trap mass spectrometer fitted with an ESI source (Bruker Daltonics HCT Ultra) operating in the negative ion mode Auto MSn mode to obtain fragment ion m/z. Tandem mass spectra were acquired in Auto-MSn mode (smart fragmentation) using a ramping of the collision energy. Maximum fragmentation amplitude was set to 1 Volt, starting at 30% and ending at 200%. MS operating conditions (negative mode) had been optimised using theaflavin-3-gallate 15 with a capillary temperature of 300 °C, a dry gas flow rate of 10 L/min, and a nebulizer pressure of 10 psi.As necessary, MS2, MS3 and MS4 fragment-targeted experiments were performed to focus only on compounds producing a parent ion at m/z 563.2, 579.2, 595.2, 611.2, 627.2 for theaflavin derivatives, 715.2, 731.2, 747.2, 763.2, 779.2 for theaflavin gallate derivatives, 867.2, 883.2, 899.2, 915.2, 931.2 for theaflavin digallate derivatives, 759.2, 775.2, 791.2, 807.2, 823.2 and 911.2 for theacitrin derivatives.
High resolution LC-MS
High Resolution LC-MS in the negative ion mode was carried out using the same HPLC equipped with a MicrOTOF Focus mass spectrometer (Bruker Daltonics) fitted with an ESI source and internal calibration was achieved with 10 mL of 0.1 M sodium formate solution injected through a six port valve prior to each chromatographic run. Calibration was carried out using the enhanced quadratic calibration mode. It should be noted that in TOF calibration the intensities of the measured peaks have a significant influence on the magnitude of the mass error with high intensity peaks resulting in detector saturation displaying larger mass errors. Where necessary this was avoided by using a more dilute sample. All MS measurements were carried out in the negative ion mode.HPLC analysis
The extracted thearubigins were analysed by HPLC using an Agilent 1200 HPLC pump with a 5 μl loop, coupled to an Agilent 1100 autosampler, an Agilent 1100 DAD-UV-VIS detector. Black tea extracts and thearubigin extracts were reconstituted at 3 g/l in 1![[thin space (1/6-em)]](https://www.rsc.org/images/entities/char_2009.gif) :
:![[thin space (1/6-em)]](https://www.rsc.org/images/entities/char_2009.gif) 1 MeOH/H2O and filtered through a 0.45 μm HPLC filter prior to injection of a volume of 3 μl. HPLC analysis used a POLARIS 5-C18-A column (length 250 mm, diameter 3 mm, particle size 5 μm) with a step gradient elution employing acetonitrile (MeCN) and water containing 0.005% formic acid, as follows: 8% MeCN from 0 to 50 min, then changing to 31% MeCN for 10 min then changing to 25% MeCN for a further 5 min.
1 MeOH/H2O and filtered through a 0.45 μm HPLC filter prior to injection of a volume of 3 μl. HPLC analysis used a POLARIS 5-C18-A column (length 250 mm, diameter 3 mm, particle size 5 μm) with a step gradient elution employing acetonitrile (MeCN) and water containing 0.005% formic acid, as follows: 8% MeCN from 0 to 50 min, then changing to 31% MeCN for 10 min then changing to 25% MeCN for a further 5 min.
Direct infusion tandem MS
A thearubigin solution (TR IV, TR VI and TR XII) of 5 g/l in water was infused at a flow rate of 180 μl/min into an ion trap mass spectrometer (Bruker HCT ultra) in the negative ion mode using the instrument settings above. MS2 experiments were carried out manually with an isolation width of 1 Da for targeted masses in the mass range between m/z 500 to 1000 with 30–50 MS2 spectra summed up per 1 Da.Data analysis
Data were analysed using Bruker Data Analysis 4.0 software. Micro TOF data were analysed (TICs, EICs) after external enhanced quadratic calibration. Ion trap data were analysed in terms of EICs, TICs and neutral loss chromatograms (NLCs) using the implemented software routines.Reaction of TR with KMnO4
To a solution of TR XII (5 ml, 5 g/l) was added at room temperature 1 ml 0.1 M KMnO4 solution and the solution stirred for 5 min. until discoloration of the KMnO4 took place. The resulting solution was centrifuged at 5000 rpm, filtered and subjected to LC-MS analysis using the conditions above.Results and discussion
The LC–MSn and direct infusion–MSn results are presented and discussed in three main sections. The first deals with confirming the presence in the TR fractions analysed of substances previously reported in black tea. The second tests in four representative homologous series (A–D) our hypothesis of progressive hydroxylation and aromatic diol–quinone equilibria. Finally, an alternative dicarboxylic acid hypothesis is evaluated.Because the thearubigins are much more complex than most other extracts of foods and beverages that are routinely analysed by LC–MS it is important to appreciate that the data generated differ significantly. For example, because the chromatogram is so crowded, even a peak that appears well-resolved in the UV-Vis trace yields several intense MS peaks accompanied by several weaker signals. Similarly, during direct infusion MS, even with a 1 Da window set for the ion trap, numerous regio- and stereo-isomers will be trapped and these might be accompanied by multiply-charged ions, each yielding multiple fragment ions. Accordingly, the resultant fragment spectra are less clean than would commonly be found when analysing less complex mixtures, and some allowance must be made for these peculiarities when interpreting the spectra.
ESI-LC-TOF MS data
In a first set of experiments thearubigins were isolated from fifteen commercial black teas, presenting a selection of geographical and sensory variations (see Table 1). As isolation procedure a method previously used by Roberts was employed comprising caffeine precipitation of TRs.7,12Crude TR samples from 15 commercial teas were analysed by ESI-LC-TOF MS in the negative ion mode. All fifteen showed the typical Gaussian TR hump and some well-resolved peaks floating thereon. At 400 nm the TR hump was particularly pronounced. Representative chromatograms are shown in Fig. 1. In comparison with the original black tea infusion, we observed a significant reduction in the intensities of the floating well-resolved peaks in the UV-VIS chromatogram (>90%) and in the negative ion mode total ion chromatogram (TIC) (80–90%). In the UV chromatogram typically between 15 and 20 well-resolved peaks were observed, whereas in the TICs between 15 and 30 were observed (See Table 1). In our earlier paper we detected in these crude TR fractions substances that had been previously reported and for which there was unambiguous NMR data in the literature.15 The tandem MS data obtained in this investigation confirm these previous assignments (see Table S1 and S2 in supplementary information†).
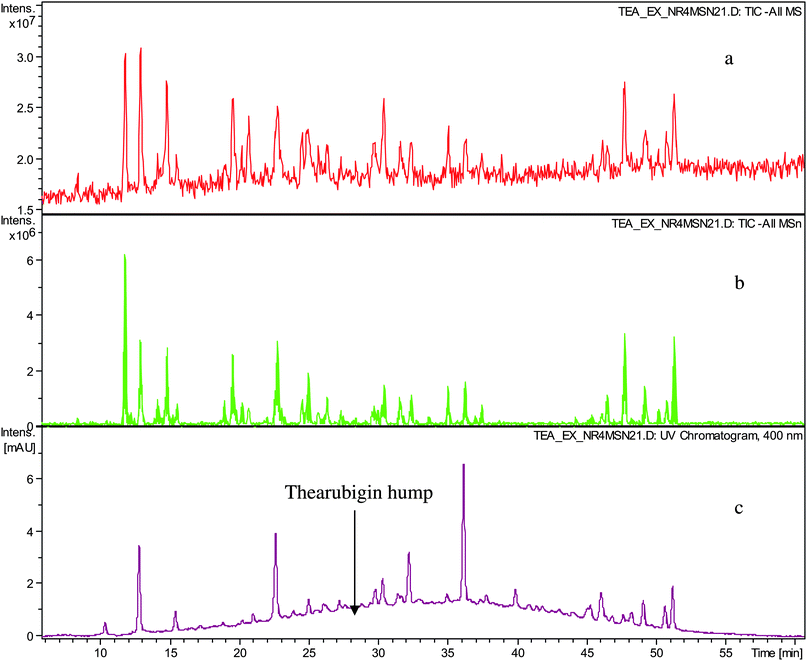 | ||
| Fig. 1 HPLC chromatogram of sample TR IV a) TIC in negative ion mode, b) TIC of all MSn in negative ion mode and c) UV trace monitored at 400 nm showing well-resolved peaks and thearubigin hump. | ||
By reference to a review of black tea composition,15 a listing was prepared of other components that might be present in the crude TR samples, and these were sought by extracting the appropriate ion chromatograms from the ESI-LC-TOF-MS data. When appropriate ions were found these were probed by tandem MS. These high resolution and tandem MS data confirm the presence of previous literature assignments for around forty compounds. The tandem MS results and selected extracted ion chromatograms (EIC) are shown in the supplementary informations (Figures S2–S5†).
Constant neutral loss chromatograms
In an LC-tandem MS experiment following LC separation molecular ions of analytes present are fragmented. In the fragmentation process the molecular ion produces a fragment ion and a neutral species. By using data analysis algorithms the presence of fragment ions (in so called all MSn searches) and neutral losses (in so called neutral loss chromatograms) with desired masses can be sought and therefore chromatographic peaks corresponding to a particular mass and having particular fragmentation characteristics can be located.In the preceding paper,12 we hypothesised that the crude TR contained novel compounds belonging to several homologous series. These were sought by using constant neutral loss analyses (CNL) of the tandem MS data. NLCs were prepared for the gallate increment (C7H5O4m/z 152), the hexose increment (C6H10O5m/z 162), and the deoxy-hexose increment (C6H12O4m/z 146), and are shown in Fig. 2. Clearly, these postulated structural increments are ubiquitous in the sample.
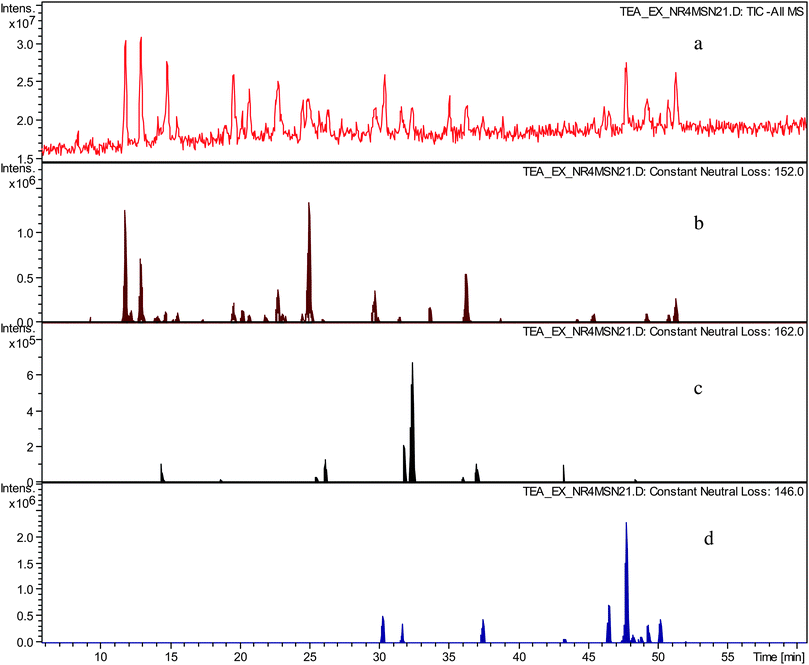 | ||
| Fig. 2 a) TIC in negative ion mode of sample TR VI, b) constant neutral loss chromatogram of neutral loss at m/z 152 (gallate), c) constant neutral loss chromatogram of neutral loss at m/z 162 (hexose), d) constant neutral loss chromatogram of neutral loss at m/z 146 (deoxy-hexose). | ||
The possible significance of the hexose and deoxy-hexose increments will be examined in the future. We suggest tentatively that such homologous series might include compounds similar to theaflavonin and desgalloyl-theaflavonin, in which one of the precursors is a flavonol glycoside.12,15
Further NLCs were obtained for smaller increments such as loss of water, loss of CO2 or demethylation again showing that our HSA hypothesis and analysis has considerable value (see supplementary information Figure S3†). Interestingly, neutral losses of CO2 are largely absent from the data and we shall return to this point at a later stage in this paper.
Probing by tandem MS the progressive hydroxylation hypothesis for thearubigins structure
In the preceding paper, we put forward a mechanistic hypothesis for the formation of TRs combined with a structural hypothesis for around 90% of the 1500 TR components so far identified by molecular formula.12 This hypothesis accommodates a wide range of TR components but is far from complete because multiply charged ions, components with masses above 1000 Da, and positive ion mode data have so far not been considered, with other structures certainly being present. This hypothesis proposes an initial formation of well-known catechin dimers (7–13).16,17 These dimers are oxidised to ortho-quinones that in turn add water as a nucleophile to yield polyhydroxylated dimers. The oxidation to quinones and addition of water continues until all aromatic hydrogens are replaced by OH functionalities. In turn, the polyhydroxylated oligomers of catechins are in a redox equilibrium with their quinone counterparts by a two electron oxidation followed by loss of two protons. This hypothesis now requires evaluation using tandem MS experiments.The traditional chemistry approach to identifying a novel compound would be to prepare a crude isolate, purify it, and then obtain NMR, MS, IR and elemental composition data for a single component. If possible, synthesis would be used to confirm the identification. We have shown that the black tea TR fraction consists of at least 5000 components, ignoring isomers. If allowance is made for the presence of isomers then some 30 000 to 50 000 substances would be expected. The best current LC methods resolve only some 200 to 300 compounds and the isolation and purification from this of a single TR is far beyond the current capabilities of separation science. Synthesis of compounds (our interpretation would suggest around 30 000 target compounds) selected from those that we believe to be present is feasible but would not greatly assist when the mixture occurring naturally cannot be resolved.18
A full analysis of all 500 homologous series identified would be far beyond the scope of this paper but is in principle possible with the data available and the analysis strategies introduced here for the first time.12 For evaluation of our hypothesis, we chose four homologous series (A–D, see Table 2) to which the addition of oxygen had been identified previously, for which a pure standard of the parent molecule was available, and for which the ESI-FTICR MS molecular ion was sufficiently intense to allow fragment spectra to be obtained.
| Series | A: Theaflavins | B: Theaflavin mono-gallates | C: Theaflavin di-gallates | D: Theacitrin mono-gallates | |
|---|---|---|---|---|---|
| C29H24Ox | C36H28Ox | C43H32Ox | C37H28Ox | ||
| Parent compound | 8 C29H24O12 | 9 C36H28O15 | 11 C43H32O19 | 7 C37H28O18 |

|
| 563.2 | 715.2 | 867.3 | 759.2 | ||
| O1 | 8 + O1 C29H24O14 | 9 + O1 C36H28O16 | 11 + O1 C43H32O20 | 7 + O1 C37H28O19 | |
| 1 O inserted | 579.2 | 731.2 | 883.3 | 775.2 | |
| O2 | 8 + O2 C29H24O15 | 9 + O2 C36H28O17 | 11 + O2 C43H32O21 | 7 + O2 C37H28O20 | |
| 2 O inserted | 595.2 | 747.2 | 899.3 | 791.2 | |
| O3 | 8 + O3 C29H24O16 | 9 + O3 C36H28O18 | 11 + O3 C43H32O22 | 7 + O3 C37H28O21 | |
| 3 O inserted | 611.2 | 763.2 | 915.3 | 807.2 | |
| O4 | 8 + O4 C29H24O17 | 9 + O4 C36H28O19 | 11 + O4 C43H32O23 | 7 + O4 C37H28O22 | |
| 4 O inserted | 627.2 | 779.2 | 931.3 | 823.2 | |
| O5 | 8 + O5 C29H24O18 | 9 + O5 C36H28O20 | 7 + O5 C37H28O23 | ||
| 5 O inserted | 643.2 | 795.2 | 839.2 | ||
| O6 | 8 + O6 C29H24O19 | 9 + O6 C36H28O21 | 7 + O6 C37H28O24 | ||
| 6 O inserted | 659.2 | 811.2 | 855.2 |
To facilitate description of the TR chemistry we introduce a compound nomenclature in a simple and logical manner to describe the hydroxylated derivatives and associated quinone forms. Taking theaflavin 8, for example, the hydroxylated derivatives will be 8 + O1, 8 + O2, etc. With the exception of the fully hydroxylated derivative (8 + 07), there will be many regioisomers. The designation 8 + Ox where x is any positive integer from one to seven (or as otherwise appropriate for the theoretical maximum) insertions will be used to refer to the totality of the oxygenated derivatives. Putative quinones are designated as 8 + O1−H2 or 8 + O2−H4 indicating the loss of two or four hydrogens respectively from the parent compound within the homologous series.
Our basic experimental strategy was first to generate extracted ion chromatograms at the mass of the parent ion for each member of the four homologous series A–D under investigation, and when the signals were strong enough to obtain MS2 and MS3 spectra. This approach established that signals were obtained at m/z values corresponding to the majority of predicted hydroxylated derivatives in each of the four homologous series. In many cases, predominantly for two or three oxygen insertions, several regioisomers can be detected at distinct retention times. The signals for the associated quinones and the more extensively hydroxylated derivatives were on occasions too weak to provide higher order fragmentation spectra.
To circumvent this problem, our second approach was to use direct infusion MSn. In this operating mode, a signal can be maintained for much longer (minutes) than in LC–MS (seconds) permitting optimisation of the trapping and fragmentation. However, in general, the procedure must be automated and there are other significant practical limitations. For example, setting an isolation width of 1 Da and investigating the mass range 600 m/z to 1000 m/z generates 400 spectra per sample. Even with a 1 Da isolation width between 5 and 10 molecular ions (see mass table in ref. 13) are isolated from the TR sample in the ion trap and fragmented at the same time, resulting in fragment ions originating from a considerable number of molecular ions. Furthermore, each molecular ion can in theory correspond to up to ten different regio- and stereoisomers, increasing the number of structurally distinct parent ions to over 100.
To complicate matters yet further, a large number of direct infusion MS2 fragment spectra show base peaks at m/z values higher than that of the parent ion. This confirms that doubly charged precursor ions of higher molecular mass are present in the sample, as previously indicated by MALDI-TOF MS.12
To our knowledge, this is the first time that such tandem MS experimental strategies have been implemented to characterise a complex polyphenolic mixture of dietary significance. Four hundred MS2 spectra were obtained at intervals of 1 Da with an isolation width of 1 Da each for two randomly selected TR samples, TR XII and TR IV.
Our rationale for data interpretation is as follows.
The fragmentation pattern and mechanism of fragmentation for the first member in each homologous series (e.g. theaflavin 8, theaflavin 3, 3′-digallate 11, etc.) has been determined experimentally with authentic standards or obtained from literature data.15
For flavonoids, it has been well established that variations in B-ring and A-ring hydroxylation do not alter the mechanism of fragmentation. For example, the B-ring hydroxylation series (epi)afzelchin, (epi)catechin and (epi)gallocatechin (and associated proanthocyanidins) fragment by the same mechanism, with the RDA fragment increasing by 16 Da in parallel with the mass of the parent molecule. Similarly, it has been demonstrated for various classes of flavonoids analysed by negative ion LC–MS that the extent of A-ring hydroxylation is easily determined from the fragments observed.19,20 For ester fragmentation, e.g. degallation in MS2 for series of structurally related compounds identical fragmentation mechanisms have been observed.21,22 Accordingly, we believe that it is reasonable to expect that similar, if not identical, fragmentation mechanisms will apply to all members of any one of the homologous series that we are investigating.
Therefore, if an ion corresponding to an expected hydroxylated derivative fragmented in the same manner as the parent molecule, this would be interpreted as consistent with our hypothesis. The presence of other fragment ions, potentially arising from co-eluting and/or simultaneously trapped species would be considered not to invalidate this interpretation. Although it was anticipated that in each series most intermediate hydroxylation levels would be observed, the apparent absence of some would not invalidate the interpretation because some regioselectivity in the nucleophilic addition of water to the quinone can reasonably be expected. Similarly, although it was expected to detect some regio-isomers during LC–MS, failure to detect all the theoretical forms might arise because of co-elution, or some simply being below the limit of detection. It was anticipated that generally retention time would decrease relative to the parent molecule as hydroxylation increased unless internal hydrogen bonding significantly increased the hydrophobicity. However, if all the hydroxylated derivatives in any series eluted after the parent molecule, this would cast doubt on the identification.
Homologous series A: Theaflavins
An authentic purified reference standard of theaflavin 8 shows a rather complex MS2 spectrum with a base peak at m/z 462.9, of uncertain structure, and a further characteristic fragment at m/z 425.1. This fragment can be rationalised in terms of a retro Diels–Alder fragmentation (RDA) at one of the two benzopyran moieties with a neutral loss of an enone at m/z 137 (C7H6O3) and an enol fragment at m/z 425 (C22H15O9). The mechanism of fragmentation is shown in Scheme 2 and the fragmentation of theaflavin 8 during tandem MS has been discussed by Mulder.23 The enol fragment has five sites available for hydroxylation, two in the A-ring and three in the fused ring system, whereas the eliminated benzopyran fragment has two sites in the catechin A-ring. Accordingly, the neutral mass loss of either 138, 154 or 170 amu is diagnostic for the extent of hydroxylation in this part of the molecule. It should be noted, however, that certain flavanol and/or theaflavin tautomers (see Fig. 5) would be susceptible to an additional hydroxylation at C4 (and/or C4′) increasing the theoretical maximum hydroxylation in theaflavin 8 from seven to nine, and the maximum insertions in the RDA-eliminated benzopyran fragment from two to three.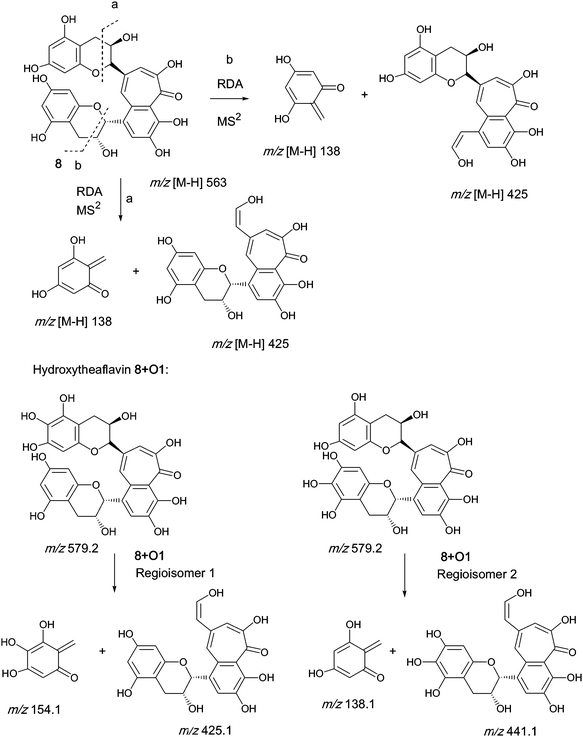 | ||
| Scheme 2 Mechanism of fragmentation of theaflavin 8 and retro Diels–Alder fragmentations of selected members of series A compounds 8 + Ox (regioisomers selected randomly). | ||
Direct infusion ESI-FTICR MS and LC-MS measurements12 detected the starting member theaflavin 8 C29H24O12 (at m/z 563.2) and putative hydroxy theaflafin 8 + O1 C29H24O13 (at m/z 579.2), 8 + O2 C29H24O14 (at m/z 595.2), 8 + O3 C29H24O14 (at m/z 611.2) and 8 + O4 C29H24O15 (at m/z 627.2). As shown in Fig. 3, the EICs prepared from LC-MS data located these same masses (although 8 + O1 was rather weak), with evidence for several regioisomers at 8 + O2, 8 + O3 and 8 + O4 (Scheme 3).
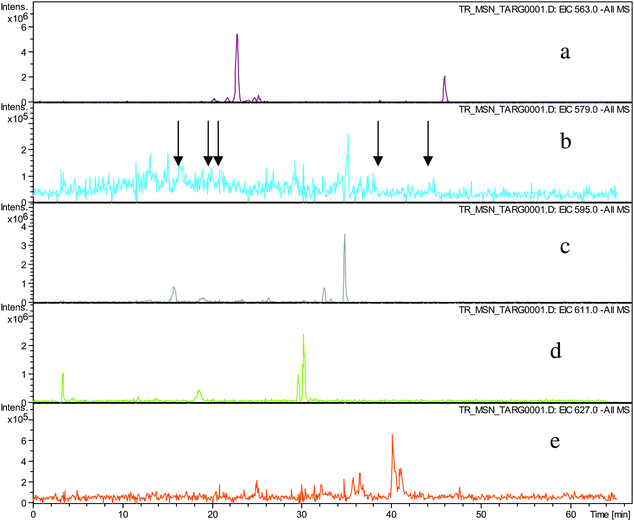 | ||
| Fig. 3 EIC chromatograms for parent ions in homologous series A: a) EIC of ion 8 at m/z 563.2, b) EIC of ions 8 + O1 at m/z 579.2, (arrows indicating location of peaks of low intensity), c) EIC of ions 8 + O2 at m/z 595.2, d) EIC of ions 8 + O3 at m/z 611. e) EIC of ions 8 + O4 at m/z 627.2. | ||
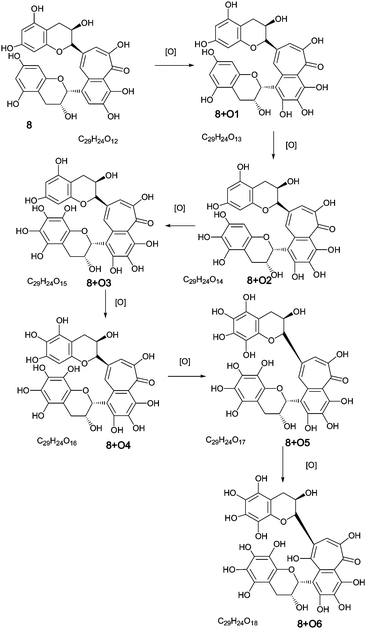 | ||
| Scheme 3 Homologous series A of oxygen insertion into theaflavin 8 (regioisomers selected randomly). | ||
In order to evaluate the assignment of these peaks as hydroxy-theaflavins EICs were prepared at the masses corresponding to the expected RDA fragment ions at m/z 425.1, 441.1, 457.1, 473.1 and 489.1. Selected data for one TR sample are shown in Table 3 and supplementary information (Fig. 4).
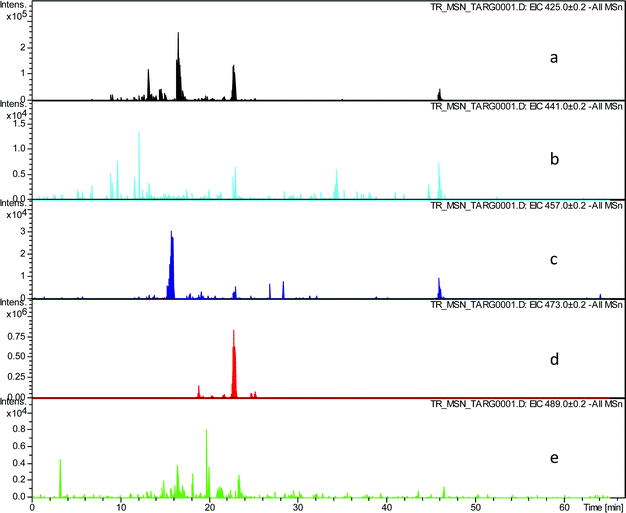 | ||
| Fig. 4 EIC chromatograms extracted from all MSn data for RDA fragment ions in homologous series A: a) EIC of fragment ion at m/z 425.1, b) EIC of fragment ion at m/z 441.1, c) EIC of fragment ion at m/z 457.1, d) EIC of fragment ion at m/z 473.1, e) EIC of fragment ion at m/z 489.1. | ||
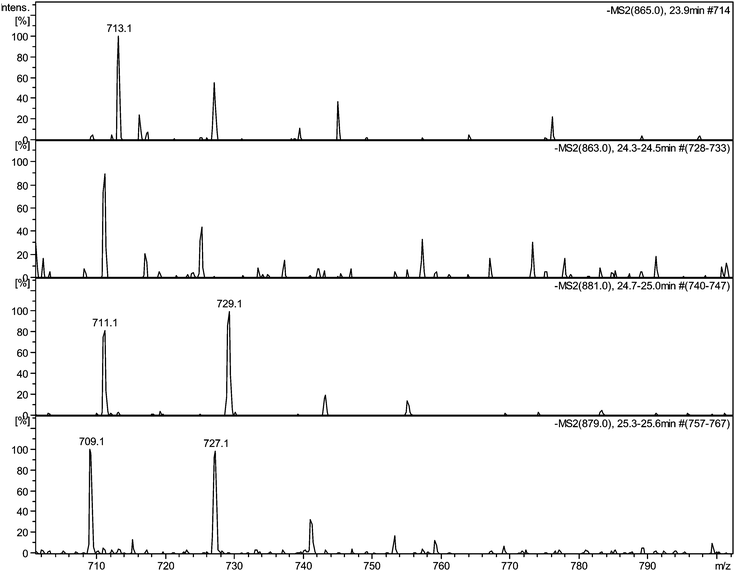 | ||
| Fig. 5 Selected MS2 spectra of quinone series C obtained by direct infusion experiments of sample TR XII in negative ion mode showing degallated fragments: a) MS2 of parent ion 11−H2 at m/z 865 showing a fragment at m/z 713.1; b) MS2 of parent ion 11−H4 at m/z 863 showing a fragment at m/z 711.1; c) MS2 of parent ion 11 + O1−H2 at m/z 881 showing a fragment at m/z 729.1; d) MS2 of parent ion 11 + O1−H4 at m/z 879 showing a fragment at m/z 727.1. | ||
| Compound No | Molecular formulas C29H24Ox | Mass of parent ion[m/z] | Retention times from EICs [min] | Fragment ions observed in LC-MS2 EICs [m/z] | Mass loss MS1 to MS2a | Fragment ions observed in direct infusion MS2 [m/z] |
|---|---|---|---|---|---|---|
| a 138 = normal benzopyran; 154 = one extra hydroxyl in benzopyran; 170 = two extra hydroxyls in benzopyran; 122 = see text – possibly a Benzopyran from which one hydroxyl has been eliminated; 106 = see text – possibly a benzopyran from which two hydroxyls have been eliminated. | ||||||
| 8 | C29H24O12 | 563.2 | 46.1 | 461 (100%), 425 (70%) | 102, 138 | 461.2 (100%), 425.1 (70%), 457.1 (10%) |
| 8 + O1 | C29H24O13 | 579.2 | 37.1 | 441.1 | 138 | 457.1 (20%), 425.1 (30%) |
| 579.2 | 28.3 | 457.1 | 122 | |||
| 579.2 | 17.3 | 425.1 | 154 | |||
| 579.2 | 16.1 | 457.2 | 122 | |||
| 579.2 | 11.8 | 425.2 | 154 | |||
| 8 + O2 | C29H24O14 | 595.2 | 23.3 | 489.2 | 106 | 425.1 (100%), 441.1 (12%), 457.1 (3%), 473.1 (3%), 489.1 (3%) |
| 595.2 | 20.8 | 425.1 | 170 | |||
| 595.2 | 19.3 | 425.1 | 170 | |||
| 595.2 | 17.9 | 489.1 | 106 | |||
| 595.2 | 16.3 | 425.1 | 170 | |||
| 595.2 | 12.8 | 425.1 | 170 | |||
| 8 + O3 | C29H24O15 | 611.2 | 13.1 | 457.2 | 154 | 425.1 (2%), 441.1 (2%), 457.1 (5%), 473.1 (5%) |
| 8 + O4 | C29H24O16 | 627.2 | 425.1 (5%), 441.1 (5%), 457.1 (80%), 473.1 (20%) | |||
| 8 + O5 | C29H24O17 | 643.2 | 457.2 (35%) | |||
| 8 + O6 | C29H24O18 | 659.2 | 457.1 (3%), 473.1 (12%), 489.1 (25%) |
A close inspection of the MS2 and MS3 spectra of these peaks revealed the following:
The peak at 46.1 min retention time (RT), corresponding to theaflavin 8, produces the known RDA fragment at m/z 425.
Five 8 + O1 regio-isomers were detected at m/z 579, all eluting faster than theaflavin 8. The possibility that some of these might be (epi)theaflavic acid gallates, previously characterised black tea components,15 was excluded because it was not possible to detect losses of 44 amu (decarboxylatoin) or 152 amu (degallation). Two 8 + O1 regio-isomers show a transition from m/z 579 to m/z 425 indicating that one oxygen has been inserted in the RDA-eliminated benzopyran moiety. One suffered a loss of 138 amu indicating that the hydroxyl had been inserted in the benzotropolone (see Scheme 2). Two lost 122 amu suggesting that the RDA-eliminated benzopyran moiety contained one less hydroxyl than is found in theaflavin 8, and accordingly two hydroxyls had been inserted in the benzotropolone moiety. This is discussed below.
Six 8 + O2 regio-isomers were detected at m/z 595, all eluting faster than theaflavin 8. Four 8 + O2 regio-isomers transitioned from m/z 595 to m/z 425 indicating that two hydroxyls had been inserted in the RDA-eliminated benzopyran moiety. Two 8 + O2 regio-isomers transitioned from m/z 595 to m/z 489 suggesting that the RDA-eliminated benzopyran moiety contained two less hydroxyls than is found in theaflavin 8, and that four hydroxyls had been inserted in the benzotropolone moiety. This is discussed below.
Only one 8 + O3 regio-isomer was detected at m/z 611, eluting faster than theaflavin 8. This transitioned from m/z 611 to m/z 457 indicating that one additional hydroxyl had been inserted in the RDA-eliminated benzopyran and the other two were in the benzotropolone moiety
Single 8 + O4, 8 + O5 and 8 + O6 regio-isomers were found but the signals were too weak to yield higher order spectra.
The direct infusion tandem MS experiments confirmed the foregoing and yielded additional data, with parent ion–fragment ion transitions as follows:
1. For 8 + O2, additional isomers were detected with two insertions in the benzotropolone (m/z 595 to m/z 457), one insertion in the benzopyran with the second insertion in the benzotropolone (m/z 595 to m/z 441), and with three insertions in the benzotropolone associated with a benzopyran lacking one hydroxyl.
2. For 8 + O3, additional isomers were detected with three insertions in the benzotropolone (m/z 611 to m/z 473), one insertion in the benzotropolone plus two insertions in the benzopyran (m/z 611 to m/z 441), and three insertions in the benzopyran (m/z 611 to m/z 425).
3. For 8 + O4 one isomer with four insertions was detected (m/z 627 to m/z 425, loss of 202, RDA fragment with four oxygens inserted) pointing to potential addition of hydrogen peroxide to a quinone. The presence in a black tea infusion of H2O2 at concentrations of around 30–60 μM was previously established by Subramanian.24 So addition of H2O2 a much more powerful nucleophile, due to its α-effect, if compared with water, seems feasible in black tea, to form an aromatic hydroperoxide. Unfortunately the hydroperoxide moiety appears as a neutral loss in the mass spectrum and can therefore not be easily further investigated to further substantiate this possibility. However, we expand our structural hypothesis on TR formation at this point to include as well H2O2 as a potential nucleophile involved in TR formation. It must be noted that when fragmentation data indicate that two (or four) oxygens have been inserted in a particular moiety, one (or two) might be a peroxide. Additional isomers were detected with three insertions in the benzopyran plus one in the benzotropolone (m/z 627 to m/z 441), two insertions in the benzopyran plus two in the benzotropolone (m/z 627 to m/z 457), one insertion in the benzopyran plus three in the benzotropolone (m/z 627 to m/z 473), and four in the benzotropolone (m/z 627 to m/z 489).
4. For 8 + O5 Additional isomers were detected with three insertions in the benzopyran plus two in the benzotropolone (m/z 643 to m/z 457).
5. For 8 + O6 one isomer with four insertions was detected (m/z 659 to m/z 457) pointing to potential addition of hydrogen peroxide to a quinone.24 Additional isomers were detected with three insertions in the benzopyran plus three in the benzotropolone (m/z 659 to m/z 473), and two insertions in the benzopyran plus four in the benzotropolone (m/z 659 to m/z 489).
Several transitions, e.g. m/z 595 to m/z 489 or m/z 579 to m/z 457, corresponding to neutral losses of 122 and 106 respectively, have been observed in these experiments. Assuming these are RDA fragmentations, this suggests the absence of one or two OH functionalities at one A ring of the theaflavin. While such compounds are feasible, to our knowledge neither they nor their putative dehydroxylated precursors have been reported in tea. It is suggested that they might form through a vinylogous dehydroxylation similar to that seen in conversion of EGCG to tricetanidin 13 and possibly involving the tautomer that is susceptible to hydroxylation at C4.
All data are summarised in Table 3. Selected MS2 spectra are shown in the supplementary information (Figure S6†). In no case was the theoretical maximum oxygenation exceeded and collectively the data argue strongly for the presence of at least 29 polyhydroxy-theaflavins 8 + Ox in TR samples. Only one compound structurally similar to 8 + O1 has been previously reported in the literature by Matsuo.25
Homologous series B: Theaflavin mono-gallates
Authentic purified reference standards of theaflavin 3-gallate 9 and theaflavin 3′-gallate 10 show MS2 spectra with a base peak at m/z 563.2 corresponding to a degallated theaflavin (C29H23O12). The mechanism of fragmentation is shown in Scheme 4 and further details on theaflavin tandem MS have been discussed by Mulder.23 The theaflavin mono-gallates have eleven sites available for oxygen insertion, three in each A-ring, two in the gallate moiety and three in the benzotropolone moiety. If oxygens have been inserted in the gallate moiety then ‘degallation’ mass losses of 170 or 186 amu would be expected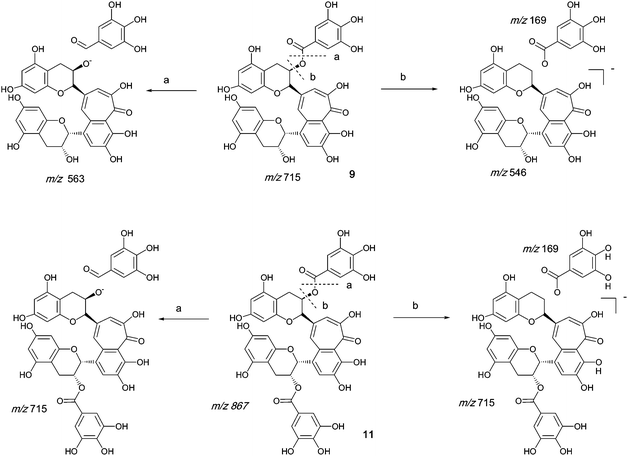 | ||
| Scheme 4 Mechanism of fragmentation of theaflavin mono gallate 9 and theaflavin digallate 11. | ||
The theaflavin mono-gallates 9/10 + Ox homologous series B commences with theaflavin 3-gallate 9 and 3′-gallate 10 C36H28O15 (at m/z 715.2). Direct infusion MS experiments have indicated the presence of putative hydroxy theaflavin mono-gallates 9/10 + O1 at m/z 731.2 (C36H28O16), 9/10 + O2 at m/z 747.2 (C36H28O17), 9/10 + O3 at m/z 763.2 (C36H28O18), 9/10+O4 ar m/z 779.2 (C36H28O19), 9/10 + O5 at m/z 795.2 (C36H28O20) and 9/10 + O6 at m/z 811.2 (C36H28O21) this last with low intensity, indicating the insertion of up to six oxygens (see Scheme 4). Direct infusion MS demonstrated the loss of gallate from 9/10 + O1 to 9/10 + O6, inclusive. LC-MS data were searched for these masses.
Tandem LC-MS detected an MS2 mass loss of 184 in two regio-isomers of 9/10 + O3 consistent with the presence of one gallate residue bearing two additional hydroxyls (Table 4). MS3 indicated that the third hydroxyl was inserted in the RDA-eliminated benzopyran moiety. These hydroxylated derivatives were appreciably more hydrophobic than the 9/10 + O2 and the 9/10 + O1 regio-isomers suggesting the presence of internal hydrogen bonds involving the hydroxylated gallate residue in 9/10 + O3, but they eluted in advance of the parent theaflavin mono-gallates. Gallate hydroxylation was not detected in 9/10 + O4.
| Compound No | Molecular formula C36H28Ox | Mass of parent ion [m/z] | Retention times from EICs [min] | Fragment ions observed in LC-MS2 EICs [m/z] | Mass Loss from MS1 to MS2a | MS3 ions of MS2 [m/z] | Mass Loss from MS2 to MS3b | Fragment ions observed in direct infusion MS2 [m/z] |
|---|---|---|---|---|---|---|---|---|
| a 152 – loss of gallate; 184 = loss of gallate containing two extra hydroxyls; 138 = normal benzopyran; 154 = one extra hydroxyl in benzopyran;. | ||||||||
| 9 | C36H28O15 | 715.2 | 49.2 | 563.2 (100%) | 152 | 425.1 (100%) | 138 | 563.2 |
| 10 | 715.2 | 50.6 | 563.2 (100%) | 152 | 425.2 (100%) | 138 | ||
| 9/10 + O1 | C36H28O16 | 731.2 | 38.8 | 579.2 | 152 | 425.1 | 154 | 579.2 |
| 731.2 | 22.5 | 579.2 | 152 | |||||
| 731.2 | 23.8 | 579.2 | 152 | |||||
| 9/10 + O2 | C36H28O17 | 747.2 | 17.7 | 595.2 | 152 | 595.2 | ||
| 747.2 | 14.5 | 595.2 | 152 | |||||
| 747.2 | 13.3 | 595.2 | 152 | |||||
| 9/10 + O3 | C36H28O18 | 763.2 | 44.9 | 579.2, 611.2 | 184, 152 | 425.2, 457.1 | 154, 154 | 611.2 |
| 763.2 | 35.6 | 579.2, 611.2 | 184, 152 | |||||
| 9/10 + O4 | C36H28O19 | 779.2 | 43.8 | 627.2 | 152 | 627.2 | ||
| 9/10 + O5 | C36H28O20 | 795.2 | 152 | 643.2 | ||||
| 9/10 + O6 | C36H28O21 | 811.2 | 152 | 659.2 |
The EICs corresponding to these six oxygenation levels were prepared (see supplementary information Figures S5 and S6†) and demonstrated the presence of regio-isomers as follows:
Three 9/10 + O1 regio-isomers with an m/z 731.2 to m/z 579 transition
Three 9/10 + O2 regio-isomers with an m/z 747.2 to m/z 595 transition
Three 9/10 + O3 regio-isomers with an m/z 763.2 to m/z 611 transition
One 9/10 + O4 regio-isomer with an m/z 779.2 to m/z 627 transition
The signals for 9/10 + O5 and 9/10 + O6 were too weak to be reliably distinguished from background.
Results are summarised in Table 4. Selected MS2 spectra are shown in the supplementary information (Figure S6†). Collectively, the data argue strongly for the presence of at least 12 polyhydroxy theaflavin mono-gallates 9/10 + Ox in TR samples.
Homologous series C: Theaflavin 3, 3′-di-gallates
An authentic purified reference standard of theaflavin 3, 3′-di-gallate 11 shows MS2 spectra with base peak at m/z 715.2 corresponding to a mono-gallated theaflavin (C36H27O15). The mechanism of fragmentation is shown in Schemes 4 and 5. The oxygen insertion homologous series for theaflavin di-gallates (series C) commences with theaflavin 3, 3′-di-gallate 11 at m/z 867.2 (C43H34O18). Direct infusion ESI-FTICR MS (13) detected the parent molecule 11 (C36H27O15, m/z 867), and putative hydroxy theaflavin-digallates 11 + O1 at m/z 883.2 (C43H34O19), 11 + O2 at m/z 899.2 (C43H34O20), 11 + O3 at m/z 915.2 (C43H34O21), 11 + O4 at m/z 931.2 (C43H34O22), 11 + O5 at m/z 947.2 (C43H34O23) and 11 + O6 at m/z 963.2 (C43H34O24). The signals for 11 + O5 and 11 + O6 were of low intensity. At MS2, all showed the loss of gallate. Selected MS3 data confirm the structure of the MS2 fragment ions at m/z 715.2 and 731.2 as theaflavin di-gallates or hydroxy theaflavin di-gallates, respectively. All data are summarised in Table 5. Selected EICs and selected MS2 spectra are shown in the supplementary information (Figure S7†).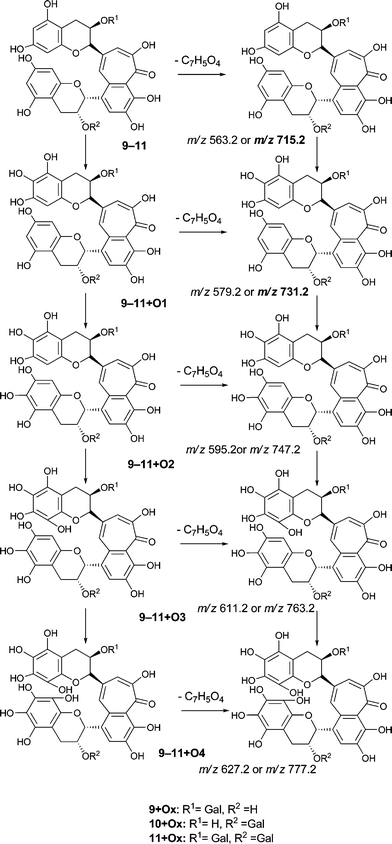 | ||
| Scheme 5 Suggested mechanism of formation of oxygenated homologous series of compounds through successive oxidations and nucleophilic additions of water starting from theaflavin mono gallates 9 and 10 and theaflavin digallate 11 including expected fragmentation pathways (regioisomers selected randomly). | ||
| Compound No | Molecular formula C43H32Ox | Mass of parent ion [m/z] | Retention times from EICs [min] | Fragment ions observed in LC-MS2 EICs [m/z] | Mass Loss from MS1 to MS2 | MS3 ions of MS2 [m/z] | Fragment ions observed in direct infusion MS2 [m/z] |
|---|---|---|---|---|---|---|---|
| 11 | C43H32O19 | 867.3 | 51.2 | 715.2 (100%) | 152 | 563.2 (100%) | 715.2 (100%), 563.2 (40%) |
| 11 + O1 | C43H32O20 | 883.3 | 37.5 | 731.2 | 152 | 579.2 | 731.2 (100%) |
| 883.3 | 34.2 | 731.2 | 152 | ||||
| 883.3 | 33.6 | 731.2 | 152 | ||||
| 11 + O2 | C43H32O21 | 899.3 | 25.5 | 747.2 | 152 | 747.2 (8%) | |
| 899.3 | 22.6 | 747.2 | 152 | ||||
| 11 + O3 | C43H32O22 | 915.3 | 21.1 | 763.2 | 152 | 763.2 (40%) | |
| 915.3 | 18.6 | 763.2 | 152 | ||||
| 915.3 | 16.3 (broad) | 763.2 | 152 | ||||
| 11 + O4 | C43H32O23 | 931.3 | 9.9 | 779.2 | 152 | 779.2 (30%) |
The EICs corresponding to these six oxygenation levels were prepared and demonstrated the presence of regioisomers as follows:
Three 11 + O1 regio-isomers with an m/z 883.2 to m/z 731.2 transition
Two 11 + O2 regio-isomers with an m/z 899.2 to m/z 747.2 transition
Three 11 + O3 regio-isomers with an m/z 915.2 to m/z 763.2 transition
One 11 + O4 regio-isomer with an m/z 931.2 to m/z 779.2 transition
It was not possible to obtain satisfactory fragmentation spectra for 11 + O5 and 11 + O6.
Collectively, the data argue strongly for the presence of at least nine polyhydroxy theaflavin di-gallates 11 + Ox in TR samples.
Homologous series D: Theacitrin mono-gallates
An authentic purified reference standard of theacitrin 3-gallate 7 shows an MS spectrum with base peak at m/z 759.2 (C37H27O18). The mechanism of fragmentation is shown in Scheme 6 and involves two fragmentation routes, firstly the loss of a gallate moiety to give a base peak at m/z 607.1 (C30H23O14) and secondly loss of water to yield a fragment at m/z 751.2 (see Scheme 6).12 Using tandem LC-MS a second regioisomer of theacitrin gallate 33 possibly theacitrin 3′-gallate) could be observed, but its structure has never been unambiguously confirmed by NMR spectroscopy (15).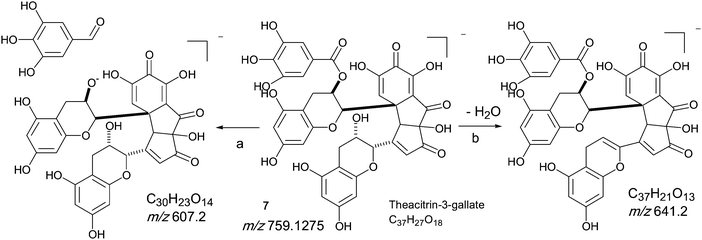 | ||
| Scheme 6 Mechanism of fragmentation of theacitrin-3-gallate 7. | ||
Therefore we consider in the discussion of this homologous series only derivatives of 7 with other possible regioisomers feasible as well.
The oxygen insertion homologous series (D) shown in Scheme 7 commences with theacitrin 3-gallate 7 at m/z 759.2 (C37H27O18). Direct infusion MS detected putative hydroxy theacitrin mono-gallates 7 + O1 at m/z 775.2 (C37H27O19), 7 + O2 at m/z 791.2 (C37H27O20), 7 + O3 at m/z 807.2 (C37H27O21), 7 + O4 at m/z 823.2 (C37H27O22), 7 + O5 at m/z 839.2 (C37H27O23) and 7 + O6 at m/z 855.2 (C37H27O24), the last two with low intensities (see Scheme 7). At MS2, all showed the loss of gallate Selected MS3 data confirm the structure of the MS2 fragment ions at m/z 607 and 623 as a theacitrin mono-gallate and a hydroxy theacitrin mono-gallate, respectively. All data are summarised in Table 6.
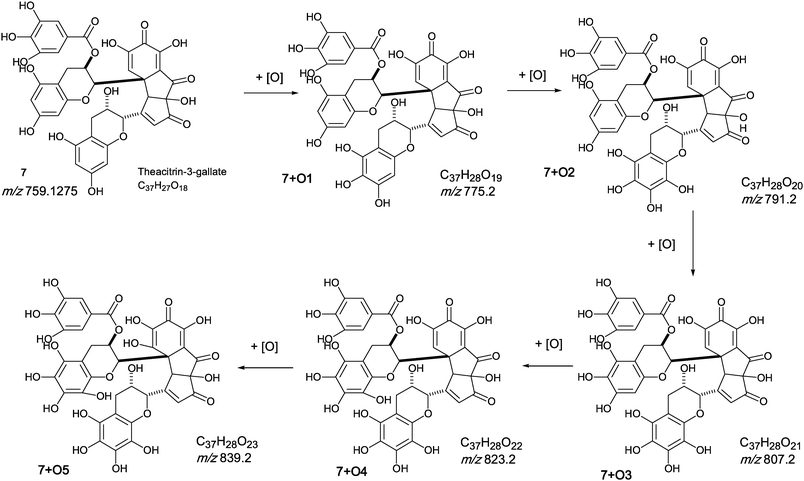 | ||
| Scheme 7 Homologous series D of theacitrin-3-gallate 7 with successive oxygen insertion (regioisomers selected randomly). | ||
| Compound No | Molecular formula C37H28Ox | Mass of parent ion [m/z] | Retention times from EICs [min] | Fragment ions observed in LC-MS2 EICs [m/z] | Mass Loss from MS1 to MS2 | MS3 ions of MS2 [m/z] | Fragment ions observed in direct infusion MS2 [m/z] |
|---|---|---|---|---|---|---|---|
| 7 | C37H28O18 | 759.2 | 15.4 | 607.2 (100%), 741.2 (40%) | 152, 18 | 589 (100%), 427.1, 301.1 | 607.2 (100%), 741.2 (40%) |
| 7 + O1 | C37H28O19 | 775.2 | 34.6 | 623.2 | 152 | 605.2 | 623.2 (15%) |
| 775.2 | 28.4 | 623.2 | 152 | ||||
| 775.2 | 18.7 | 623.2 | 152 | ||||
| 7 + O2 | C37H28O20 | 791.2 | 21.3 | 639.2 | 152 | 639.2 (5%) | |
| 791.2 | 19.0 | 639.2 | 152 | ||||
| 791.2 | 17.2 | 639.2 | 152 | ||||
| 7 + O3 | C37H28O21 | 807.2 | 25.8 | 655.2 | 152 | 655.2 (10%), 793.2 (6%) | |
| 807.2 | 22.3 | 655.2 | 152 | ||||
| 7 + O4 | C37H28O22 | 823.2 | 14.6 | 671.2 | 152 | 671.2 (40%), 809.2 (8%) | |
| 823.2 | 14.4 |
The EICs corresponding to these six oxygenation levels were prepared (see supplementary information Figure S8†) and demonstrated the presence of regioisomers as follows:
Three 7 + O1 regio-isomers with m/z 775 to m/z 623.2 and m/z 757 transitions for loss of gallate and water, respectively were located in the chromatograms.
Three 7 + O2 regio-isomers with an m/z 791 to m/z 639 transition were located in the chromatograms.
Two 7 + O3 regio-isomers with an m/z 807 to m/z 655 transition for loss of gallate were located in the chromatograms.
Two 7 + O4 regio-isomers one of with an m/z 823 to m/z 671 transition for loss of gallate were located in the chromatograms.
It was not possible to obtain satisfactory fragmentation spectra for 7 + O5 and 7 + O6. The MS signals for 7 + O3 and 7 + O4 were appreciably stronger than for 7 + O1 and 7 + O2. Somewhat contrary to expectations, only the 7 + O4 regio-isomers eluted faster than the parent compound. These data argue strongly for the presence of at least 10 polyhydroxy theacitrin 3-gallates 7 + Ox in TR samples. Selected data for one TR sample are shown in Table 6. Selected tandem mass spectra are shown in supplementary information (Figure S9†).
Aromatic diol–ortho-quinone equilibria
As part of the polyhydroxylation hypothesis we suggested that each class of polyhydroxy dimers is in a redox-equilibrium with their quinone counterparts. Scheme 8 illustrates such a redox-equilibrium. An exhaustive investigation of these aromatic diol–quinone equilibria for all suggested and identified homologous series would require several hundred targeted MS, and a lengthy discussion, both of which are outside the scope of this paper. LC–MS and direct infusion–MS data are presented in Table 7 for the quinones associated with homologous series A–D and these are discussed below. Representative MS2 spectra from direct infusion experiments are shown in supplementary information (Figure S9†).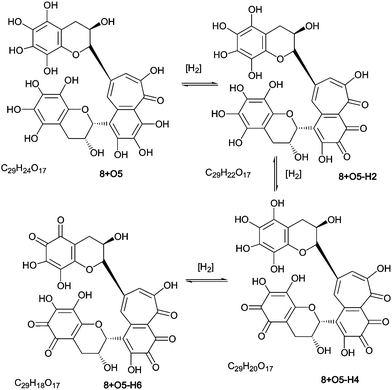 | ||
| Scheme 8 Redox equilibrium between polyhydroxy-theaflavins and their quinone counterparts (regioisomers selected randomly). | ||
| Series | Parent compound Molecular formula and mass | Compound | Quinone Molecular formula | Quinone parent ion [m/z] | Fragment ion observed in MS2 of direct infusion tandem MS corresponding to expected quinone fragment | Mass loss at MS2 (MS3)b |
|---|---|---|---|---|---|---|
| a Also observed in LC-MS. b Normal benzopyran; 152 = gallate or mono-hydroxy-mono-quinone benzopyran; 154 = one extra hydroxyl in benzopyran; 168 = di-hydroxy-mono-quinone benzopyran; 170 = two extra hydroxyls in benzopyran; 172 = two extra. c Hydroxyls in benzopyran in which one double bond has been reduced. d Similar fragmentation would be expected for dihydrotheaflavins reported by Tanaka et al.25 | ||||||
| Theaflavins series A | C29H24O12 | 8−H2 | C29H22O12 | 561.2 | 423.1 (70%) | 138 |
| 563.2 | 8−H4 | C29H20O12 | 559.2 | 421.0 (45%) | 138 | |
| C29H24O13 | 8 + O1−H2 | C29H22O13 | 577.2 d | 425.1 100%) | 138 | |
| 579.2 | 8 + O1−H4 | C29H20O13 | 575.2 | 423.1 (30%) | 138 | |
| C29H24O14 | 8 + O2−H2 | C29H22O14 | 593.2 | 421.1 (5%), 423.1 (5%), 441.1 (12%) a | 172, 170, 152 | |
| 595.2 | 8 + O2−H4 | C29H20O14 | 591.2 | 421.1 (60%), 439.1 (100%) | 170, 152 | |
| C29H24O15 | 8 + O3−H2 | C29H22O15 | 609.2 | 471.1 (3%), | 138 | |
| 611.2 | 8 + O3−H4 | C29H20O15 | 607.2 | 469.1 (5%), 439.1 (12%) | 168, 138 | |
| C29H24O16 | 8 + O4−H2 | C29H22O16 | 625.2 | 455.1 (20%), 471.1 (5%) | 170, 154 | |
| 627.2 | 8 + O4−H4 | C29H20O16 | 623.2 | 453.1 (5%), 471.1 (15%), 485.1 (5%) | 170, 152, 138 | |
| Theaflavin mono-gallate series B | C36H28O15 | 9/10−H2 | C36H26O15 | 713.2 | 561.2 (20%) | 152 |
| 715.2 | 9/10−H4 | C36H24O15 | 711.2 | Not observed | ||
| C36H28O16 | 9/10 + O1−H2 | C36H26O16 | 729.2 | 577.2 (20%) | 152 | |
| 731.2 | 9/10 + O1−H4 | C36H24O16 | 727.2 | 575.2 (25%) | 152 | |
| C36H28O17 | 9/10 + O2−H2 | C36H26O17 | 745.2 | 593.2 (MS3 at 455.1 and 423.1) | 152 (138, 170) | |
| 747.2 | 9/10 + O2−H4 | C36H24O17 | 743.2 | 591.2 (80%) | 92 | |
| C36H28O18 | 9/10 + O3−H2 | C36H26O18 | 761.2 | 563.2, 609.2 | 198, 152 | |
| 763.2 | 9/10 + O3−H4 | C36H24O18 | 759.2 | 607.2 (10%) | 152 | |
| C36H28O19 | 9/10 + O4−H2 | C36H26O19 | 777.2 | 625.2 (45%) | 152 | |
| 779.2 | 9/10 + O4−H4 | C36H24O19 | 775.2 | 623.2 (50%) | 152 | |
| Theaflavin digallates Series C | C43H32O19 | 11−H2 | C43H30O19 | 865.2 | 713.2. (100%) | 152 |
| 867.3 | 11−H4 | C43H28O19 | 863.2 | 711.2 (90%) | 152 | |
| C43H32O20 | 11 + O1−H2 | C43H30O20 | 881.3 | 729.2 (100%) | 152 | |
| 883.3 | 11 + O1−H4 | C43H28O20 | 879.3 | 727.2 (100%) | 152 | |
| C43H32O21 | 11 + O2−H2 | C43H30O21 | 897.2 | 745.2 (15%) | 152 | |
| 899.3 | 11 + O2−H4 | C43H28O21 | 895.3 | 743.2(30%) | 152 | |
| C43H32O22 | 11 + O3−H2 | C43H30O22 | 913.2 | 761.2 (40%)(MS3 at 609.2 1 and 591.2) | 152 (152, 170) | |
| 915.3 | 11 + O3−H4 | C43H28O22 | 911.2 | 759.2 (100%) (MS3 at 607.2, 589.2 and 463.1) | 152 (152, 170, 296) | |
| C43H32O23 | 11 + O4−H2 | C43H30O23 | 929.3 | 777.1 (20%) | 152 | |
| 931.3 | 11 + O4−H4 | C43H28O23 | 927.3 | 775.2 (35%) | 152 | |
| Theacitrin mono-gallate Series D | C37H28O18 | 7−H2 | C37H26O18 | 757.2 | 739.2 (15%), 607.2 (100%), 605.1 (15%) | 18, 150, 152 18, 154, 152, 150 |
| 759.2 | 7−H4 | C37H24O18 | 755.2 | 737.2 (5%), 601.2 (40%), 603.1 (20%), 605.1 (20%) | ||
| C37H28O19 | 7 + O1−H2 | C37H26O19 | 773.2 | 755.2 (5%), 621.2 (8%) | 18, 152 | |
| 775.2 | 7 + O1−H4 | C37H24O19 | 771.2 | 619.1 (4%) | 152 | |
| C37H28O20 | 7 + O2−H2 | C37H26O20 | 789.2 | 637.1 (10%) | 152 | |
| 791.2 | 7 + O2−H4 | C37H24O20 | 787.2 | 635.1 (10%) | 152 | |
| C37H28O21 | 7 + O3−H2 | C37H26O21 | 805.2 | 653.2 (50%), 775.2 (25%), 789.1 (10%) | 152, 30, 18 | |
| 807.2 | 7 + O3−H4 | C37H24O21 | 803.2 | 653.2 (50%) | 150 | |
| C37H28O22 | 7 + O4−H2 | C37H26O22 | 821.3 | 803.2 (40%), 669.1 (20%) | 18, 152 | |
| 823.2 | 7 + O4−H4 | C37H24O22 | 819.3 | 801.2 (30%), 667.2 (35%) | 18, 152 |
For all four series, it was possible to detect mono-quinone (i.e. –2H) and di-quinone (i.e. –4H) derivatives of the parent compound and derivatives that had undergone up to four hydroxylations. In the theaflavin series (A) the expected retro-Diels–Alder fragment was always observed, and the patterns of hydroxylation (insertions in the RDA-eliminated benzopyran and in the benzotropolone) were consistent with those reported for the non-quinoid forms (Table 7). It should be noted that an alternative formal loss of 2H by a direct aromatic coupling (theasinensin type coupling) is not consistent with our fragmentation data. The mass of the RDA-eliminated benzopyran observed during direct infusion-MS was either m/z 138, m/z 152, m/z 154, m/z 168, m/z 170 or m/z 172 corresponding respectively to an unmodified benzopyran moiety, a mono-hydroxy-mono-quinone derivative, a mono-hydroxy derivative, a di-hydroxy-mono-quinone derivative, a di-hydroxy derivative, and a di-hydroxy derivative in which additional reduction has occurred (Scheme 9). In some instances, the quinone(s) were clearly present in the benzotropolone moiety.
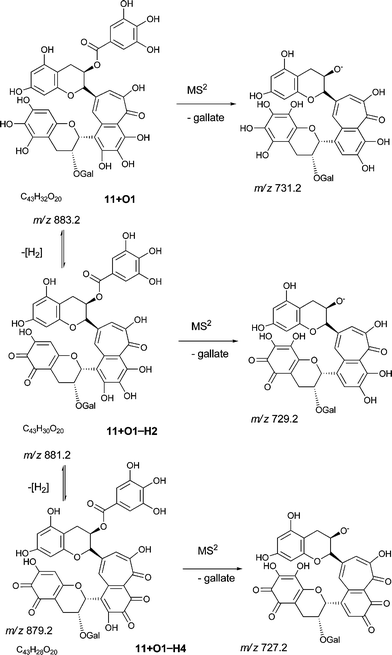 | ||
| Scheme 9 Fragmentation of theaflavin digallate 11 + O1 and its ortho-quinone derivatives (regioisomers selected randomly). | ||
During direct infusion-MS2, the quinones associated with the theaflavin mono-gallates, the theaflavin di-gallates and the theacitrin mono-gallates (with the exception of 7 + O3−H4) all produced a fragment at m/z 152 that is probably the degallation as observed with the non-quinoid forms, but which might also be an RDA-eliminated mono-hydroxy-mono-quinone benzopyran fragment. Under the conditions employed in this investigation, the non-quinoid forms eliminate gallate in preference to the bemzopyran moiety.
At MS3, the theaflavin mono-gallate derivative 9/10 + O2−H2 also yielded benzopyran fragments at m/z 138 and m/z 170 corresponding to an unmodified benzopyran and a di-hydroxy benzopyran, respectively. 9/10 + O3−H2 uniquely produced a fragment at m/z 198 that is presumably a di-quinoid form of the m/z 202 fragment produced by 8 + O4 and 8 + O6.
At MS3, the theaflavin di-gallate derivatives 11 + O3−H2 and 11 + O3−H4 yielded fragments at m/z 170 and m/z 152 corresponding to an RDA-eliminated di-hydroxy benzopyran moiety and either the second gallate or a mono-hydroxy-mono-quinone benzopyran moiety, respectively.
During direct infusion–MS2 of the quinones associated with the theacitrin mono-gallate derivatives the elimination of water was frequently observed as previously reported for the non-quinoid forms. Fragments at m/z 154 (7−H4) and m/z 150 (7−H2, 7−H4 and 7 + O3−H4) were also observed. These correspond to an RDA-eliminated mono-hydroxy benzopyran moiety and a quinoid form of the gallate moiety, respectively.
Of the 40 masses probed by direct infusion MSn all yielded fragments that could be rationalised by these substances being mono- or di-quinone forms of the parent molecules and polyhydroxylated derivatives belonging to homologous series A–D.
The evaluation of an alternative hypothesis for thearubigins structure
After several discussions with colleagues it became necessary to evaluate an alternative hypothesis for TR structure. This alternative hypothesis would explain the increased number of oxygens and reduced number of hydrogens by oxidative cleavage of aromatic polyol moieties, producing dicarboxylic acids. This transformation was first proposed by Roberts.26 It was considered initially as a possible feature of the theacitrins and has been proposed to explain the formation of theaflavates or theaflavic acid,15 and is thus worthy of serious consideration. This hypothesis and our original hypothesis are not necessarily mutually exclusive.We evaluated this dicarboxylic acid hypothesis by probing the data using the appropriate Homologous Series Analysis (HSA), i.e. (–C2H2) or (+O, –CH). These homologous series were not detected in the data. As a further check, we sought neutral losses of 44 a.m.u (–CO2) that would have been expected if the dicarboxylic acids were present in the TR. The neutral loss chromatogram (NLC) obtained clearly indicated that such fragmentation is of very limited occurrence.
Metal oxidising agents such as FeCl3, KMnO4 or K2Cr2O7 are well known to cleave aromatic diols oxidatively yielding dicarboxylic acids. As a final precaution, to ensure that the protocol employed could indeed detect these dicarboxylic acids if present, a TR sample was deliberately oxidised by treatment with a small amount of KMnO4 solution, sufficient to achieve decoloration. The sample was subsequently analysed by tandem LC-MS and a neutral loss chromatogram at m/z 44 obtained. The data are shown in the supplementary information (Figure S10†). It can clearly be seen that a chemical oxidising agents induces oxidative aromatic ring cleavage and formation of carboxylic acids, whose presence can be established in a complex mixture using neutral loss analysis. These neutral losses are, however absent in the TR samples, suggesting the absence of ring cleaved derivatives.
Conclusion
In conclusion we have provided an innovative general strategy for the mass spectrometric characterisation of complex materials (materials in which too many compounds are present to allow chromatographic separation). Such complex materials are ubiquitous in food chemistry (complex polyphenols in tea and cocoa, matured red wines, non-phenolic components in Maillard reactions, etc.), biological systems and environmental samples such as waste or NOMs. Previous complex mixture analysis has remained at the step of counting and sorting compounds at the high resolution mass spectrometry level and has failed to provide structural hypotheses.27–31 Our general strategy for complex mixture analysis comprises the following steps:1. Chemical characterisation of the material using traditional spectroscopic methods to identify elemental composition, functional groups and molecular weight distributions.
2. Ultra high resolution mass spectrometry to establish the number of compounds present and to establish molecular formulas.
3. Data analysis (van Krevelen analysis, Kendrick analysis, unsaturation analysis and homologous series analysis) that allow visualisation and interpretation of the tremendously complex data.
4. Formulation of one or several structural and mechanistic hypotheses for the mixture of components under consideration.
5. Critical evaluation of the structural hypothesis by tandem LC-MS and direct infusion tandem MS. It should be noted that, despite the enormous power of tandem MS a structural hypothesis is required prior to a meaningful design of tandem MS experiments and data interpretation.
More importantly we have characterised thearubigins isolated from fifteen commercial teas by LC-MS and direct infusion tandem MS. In the process, we have confirmed the structure of around 45 previously assigned major TR components by tandem LC-MS. More importantly, we have tested our newly developed mechanistic and structural hypothesis for thearubigins structure. All the data obtained are consistent with the hypothesis previously formulated—the evidence is strong and in some cases compelling that a significant portion of the thearubigins are indeed poly-hydroxylated dimers of catechins that are in redox equilibrium with their quinone counterparts. We originally proposed that oxygenation arose by nucleophilic addition of water to a quinone and now expand this to include nucleophilic addition of hydrogen peroxide. The alternative dicarboxylic acid hypothesis could not be confirmed
This evidence comes from a careful investigation of tandem MS spectra, in which fragments expected to arise from homologous series of such compounds, are indeed observed. Thus, in this contribution we have suggested and confirmed, within the restriction of the technologically possible, the structures of more than 150 new thearubigin components. The methodology introduced will in the future allow a further confirmation of many of the 1500 molecular formulas assigned in the thearubigins so far. Fifty years after their discovery the structure and mechanism of formation of at least a significant part of the thearubigins has been unravelled
We have shown that black tea must be considered as the ultimate master of creating chemical diversity by turning only a handful of starting materials (the catechins) in the presence of two reagents (water and oxygen) into a myriad of thousands of structurally distinct reaction products. This structural diversity is programmed into the functional groups of simple tea polyphenols helping nature to achieve this enormous chemical diversity surpassing any complexity previously observed in nature.
Notes and references
- S. Poulter, Daily mail online, dailymail.co.uk, 27th June 2008.
- Price 2007, FAO newsroom 2007, http://www.fao.org/news/newsroom-home/en/.
- A. E. Bradfield and M. Penney, Journal of the Society of Chemistry and Industry, 1944, 63, 306–310 Search PubMed.
- E. A. H. Roberts and M. Myers, J. Sci. Food Agric., 1959, 10, 167–179 CrossRef CAS.
- E. A. H. Roberts., Economic importance of flavanoid substances: tea fermentation, in The Chemistry of Flavanoid Compounds, ed. T. A. Geissman, Pergamon Press, Oxford, 1962, pp. 468–512 Search PubMed.
- A. J. Charlton, A. L. Davis, D. P. Jones, J. R. Lewis, A. P. Davies, E. Haslam and M. P. Williamson, J. Chem. Soc., Perkin Trans. 2, 2000, 317–322 RSC.
- R. Jaiswal, T. Sovdat and N. Kuhnert, J. Agric. Food Chem., 2010, 58, 5471–5484 CrossRef CAS.
- E. A. H. Roberts, J. Sci. Food Agric., 1958, 9, 381–390 CrossRef CAS.
- M. E. Harbowy and D. A. Balentine, Crit. Rev. Plant Sci., 1997, 16, 569–581.
- E. Haslam, Phytochemistry, 2003, 64, 61–73 CrossRef CAS.
- E. J. Gardener, C. H. S. Ruxton and A. R. Leeds, Eur. J. Clin. Nutrition, 2006, 1–16 Search PubMed.
- N. Kuhnert, Arch. Biochem. Biophys., 2010, 501, 37–51 CrossRef CAS.
- N. Kuhnert, J. W. Drynan, J. Obuchowicz, M. Witt and M. N. Clifford, Rapid Commun. Mass Spectrom., 2010 Search PubMed RCM-10-0370.R1, manuscript in press.
- N. Kuhnert, M. N. Clifford and A.-G. Radenac, Tetrahedron Lett., 2001, 42, 9261–9264 CrossRef CAS.
- J. W. Drynan, J. Obuchowicz, M. N. Clifford and N. Kuhnert, Nat. Prod. Rep., 2010, 27, 417–462 RSC.
- F. Hashimoto, G.-I. Nonaka and I. Nishioka, Chem.Pharm.Bull., 1992, 40, 1383–1389 CAS.
- Y. Takino and H. Imagawa, Agric.Biol.Chem., 1963, 27, 666–667 CAS.
- In future studies we intend to employ enzymic and electrochemical oxidation of pure flavanols and simple mixtures (for example EC and EGC) as previously employed in our laboratories but this time to monitor by LC-MS n. See e.g. S. C. Opie, M. N. Clifford and A. Robertson, J. Sci. Food Agric., 1995, 67, 501–505 Search PubMed.
- S. de Pascual-Teresa and J. C. Rivas-Gonzalo, Application of LC–MS for the identification of polyphenols, in Methods in Polyphenol Analysis, ed. C. Santos-Buelga and G. Williamson, Royal Society of Chemistry, Cambridge, 2003, pp. 48–62 Search PubMed.
- F. Cuyckens and M. Claeys, J. Mass Spectrom., 2004, 39, 1–15 CrossRef CAS.
- M. N. Clifford, S. Stoupi and N. Kuhnert, J. Agric. Food Chem., 2007, 55, 2797–2807 CrossRef CAS.
- M. N. Clifford, Z. Wang and N. Kuhnert, Phytochem. Anal., 2006, 17, 384–393 CrossRef CAS.
- P. J. Mulder, C. J. van Platerink, W. Schuyl and J. J. M. van Amelsvoort, J. Chromatogr., B: Biomed. Sci. Appl., 2001, 760, 271–279 CrossRef CAS.
- N. Subramanian, P. Venkatesh, S. Ganguli and V. P. Sinkar, J. Agric. Food Chem., 1999, 47, 2571–2578 CrossRef CAS.
- Z. Matsuo, T. Tanaka and I. Kouno, Tetrahedron, 2006, 62, 4774–4783 CrossRef.
- E. A. H. Roberts, J. Sci. Food Agric., 1958, 9, 381–390 CrossRef CAS.
- C. A. Hughey, R. P. Rodgers and A. G. Marshall, Anal. Chem., 2002, 74, 4145–4149 CrossRef CAS.
- R. L. Sleighterr and P. Hatcher, J. Mass Spectrom., 2007, 42, 559–574 CrossRef CAS.
- Z. G. Wu, R. P. Rodgers and A. G. Marshall, Anal. Chem., 2004, 76, 2511–2516 CrossRef CAS.
- T. Tanaka, C. Mine and I. Kouno, Tetrahedron, 2002, 58, 8851–8856 CrossRef CAS.
- M. N. Clifford, J. Kirkpatrick, N. Kuhnert, H. Roozendaal and P. R. Salgado, Food Chem., 2008, 106, 379–385 CrossRef CAS.
Footnote |
| † Electronic supplementary information (ESI) available: Supplementary tables, structures of polyphenols, and chromatograms. See DOI: 10.1039/c0fo00066c |
| This journal is © The Royal Society of Chemistry 2010 |
