Electrolytic manganese dioxide (EMD): a perspective on worldwide production, reserves and its role in electrochemistry
Avijit Biswal
abc,
Bankim Chandra Tripathy
bc,
Kali Sanjay
bc,
Tondepu Subbaiah
bcd and
Manickam Minakshi
*a
aSchool of Engineering and Information Technology, Murdoch University, Murdoch, WA 6150, Australia. E-mail: minakshi@murdoch.edu.au; Tel: +61 8 9360 2017
bCSIR, Institute of Minerals and Materials Technology, Bhubaneswar 751013, India
cAcademy of Scientific and Innovative Research, Training and Development Complex, Chennai 600 113, India
dK. L. University, Green Fields, Vaddeswaram-522502, Guntur (Dt), A.P., India
First published on 29th June 2015
Abstract
Electrolytic manganese dioxide (EMD) is the critical component of the cathode material in modern alkaline, lithium, and sodium batteries including electrochemical capacitors and hydrogen production. In terms of environmental and cost considerations, EMD is likely to remain the preferred energy material for the future generation, as it has been in recent decades. Diminishing fossil fuels and increasing oil prices have created the need to derive energy from sustainable sources. The energy storage device from alternative and inexpensive sources, such as low grade manganese ores, has a niche in the renewable energy and portable electronics market. Despite vast manganese sources along with the current activity in producing modified EMD materials from secondary sources, to a surprise, India mostly imports EMD to meet its demand. Keeping this in view, a comprehensive review has been prepared on the synthesis, physical and electrochemical characterization of EMD produced from synthetic solutions and secondary sources. This review summarizes the available EMD sources in the world including Indian deposits and the recent investigations of fundamental advances in understanding the electrochemical mechanism involved in aqueous rechargeable batteries and electrochemical capacitors, thus leading to an improved energy storage performance, which is essential for their long term use in storing renewable energy supply.
1. Introduction
With the increasing growth in population and improvement in living standards, the human demand for energy, which underpins the contemporary lifestyle, has also increased. The growth in demand is greatest for oil and gas but these cause global warming. Currently, about 87% of total global use of primary energy is based on fossil fuels.1 However, due to the limited reserves of fossil fuels, demand for new energy materials as well as energy storage devices is developing, and hence the search for alternative energy resources. Many of the available renewable sources (solar and wind) are intermittent and the energy supply may not match the energy demand. Hence, storage is needed to enable energy to be stored for use when it is needed at a later time. Among the various energy storage devices, alkaline rechargeable batteries have become the ultimate choice for energy storage systems in the renewable energy storage, portable electronics and electrical transport systems markets.2 Thus continuous research and development efforts are underway to produce an economically viable, eco-friendly energy storage device from secondary sources. Synthesis of energy materials from secondary (i.e., waste) sources is highly significant, as by these means waste materials may be effectively utilized and recycled. Alkaline batteries generally use electrolytic manganese dioxide (EMD), which has wide application in the primary battery market. Extensive research is going on to make this system rechargeable which could be possible by either ex situ or in situ doping of various additives, surfactants and metal ions.3–38 Although a review article has been published by Rethinaraj and Visvanathan39 on the preparation and characterisation of manganese dioxide, but that was limited to the advantages and disadvantages of different manganese salts as electrolyte. Surprisingly, until now, an updated review on the recent developments in EMD has not been available.EMD is one of the widely used cathode materials for alkaline batteries and lithium manganese primary batteries and supercapacitors. Since 1990s, it has also become very popular in lithium, sodium and magnesium-ion rechargeable batteries. Its low production cost, environmental compatibility, high redox potential, high rate capability, better relative performance over a wide temperature range, and long storage life developed intense interest for this material despite its limitations in achieving theoretical power density and practical rechargeability.22,40–44 Being an environmentally benign and relatively inexpensive material manganese dioxide has been in high demand as a cathode material for energy storage when compared to other metal oxide counterparts such as nickel45 and cobalt-oxides.46
Manganese dioxides used in energy storage devices are broadly classified into three groups according to their origin – natural manganese dioxide (NMD), chemical manganese dioxide (CMD), and electrolytic manganese dioxide (EMD).41 Natural manganese dioxide (NMD) has been used in the standard (Leclanche) cells. But in alkaline, lithium and other modern batteries, synthetic manganese dioxide with improved properties is required. Commercial alkaline cells use EMD rather than CMD or NMD because of its higher manganese content, and its greater purity. Hence, electrochemical preparation of manganese dioxide has become a general trend to produce high quality manganese dioxide. Electrochemical deposition methods are known to be superior to chemical synthesis methods, as control over the properties of the deposited material is possible.
MnO2 has been predominantly used as a cathode material in alkaline battery industries and recently its usage exceeded about 230![[thin space (1/6-em)]](https://www.rsc.org/images/entities/char_2009.gif) 000 metric tons per annum with an annual growth rate in excess of 9.6%.47 In India, annual commercial EMD production comes 7500 tonnes only which is far low. Most of the EMD required in India is met through import. In view of the increasing demand of EMD and continuing research and development (R & D) for improving its electrolytic properties, the present review is prepared to obtain the state-of-art of EMD. This review outlines the basic working principles, including the structure and function of EMD, the ores & secondary sources from which EMD can be produced, present worldwide EMD production, electrochemistry underlying EMD synthesis and the research efforts made for different methods of preparation. The physicochemical and electrochemical characterization of EMD is also reviewed. The effect of various dopants and post treatment processes on the morphology and electrolytic behaviour of EMD has been discussed. The use of EMD in hydrogen generation is briefly discussed to give an insight to the readers that this material has potential in diversified areas beyond energy storage applications.
000 metric tons per annum with an annual growth rate in excess of 9.6%.47 In India, annual commercial EMD production comes 7500 tonnes only which is far low. Most of the EMD required in India is met through import. In view of the increasing demand of EMD and continuing research and development (R & D) for improving its electrolytic properties, the present review is prepared to obtain the state-of-art of EMD. This review outlines the basic working principles, including the structure and function of EMD, the ores & secondary sources from which EMD can be produced, present worldwide EMD production, electrochemistry underlying EMD synthesis and the research efforts made for different methods of preparation. The physicochemical and electrochemical characterization of EMD is also reviewed. The effect of various dopants and post treatment processes on the morphology and electrolytic behaviour of EMD has been discussed. The use of EMD in hydrogen generation is briefly discussed to give an insight to the readers that this material has potential in diversified areas beyond energy storage applications.
1.1 Crystal structure of EMD
Manganese(IV) oxide (MnO2) is an inorganic compound and is a non-poisonous black powder which occurs naturally as the mineral pyrolusite, a main ore of manganese. It has the rutile type unit cell (Fig. 1). It has a molecular weight of 86.93 g mol−1, density of 5.026 × 10³ kg m−3, bulk density 1.7–2.5 g cm−3 and surface area in the range of 30–60 m2 g−1. MnO2 exhibits a very rich electrochemistry due to the multiple valence states of Mn and is an attractive material because of the diversity of its crystalline structure.48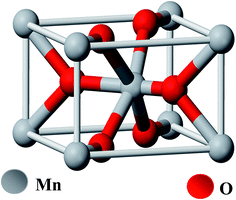 | ||
| Fig. 1 Ball-and-stick model of pyrolusite unit cell (oxygen atoms are colored red, manganese atoms are grey). | ||
Among the various polymorphs of MnO2, such as α-, β-, γ-, ε-, and δ-MnO2, the β-modification is the least active form where-as the γ form is much more active both chemically and electrochemically.49 γ-MnO2 (also called Nsutite MnO2) is the most suited material for battery applications and it can be prepared both chemically and electrochemically. However, γ-MnO2 produced by electrochemical methods shows better performance over the chemically-produced material.50 The crystal structure of EMD closely related to the β-, ε-, and γ-polymorphs of MnO2, all comprised of a hexagonally close packed lattice of O2− anions with the Mn4+ cations filling one-half the octahedral sites in the oxygen lattice.51
The difference in the above polymorphs lies in the arrangement of the Mn4+ within the octahedral sites. In both forms, the [MnO6] octahedrons link to other [MnO6] octahedrons so as to produce [MnO6] chains parallel to the c-axis and forms tunnels between these chains.52 [MnO6] units of pyrolusite form (1 × 1) tunnels, whereas, the [MnO6] octahedral units of ramsdellite form (1 × 2) tunnels.53 The Nsutite (γ-MnO2) is an irregular intergrowth of both ramsdellite and pyrolusite.54 It is claimed that the γ-MnO2 polymorph contains ramsdellite basic structure with varying amounts of pyrolusite intergrowth with micro twinning defects.50 Fig. 2 shows the basic building blocks of γ-MnO2 along with the pyrolusite and ramsdellite tunnel structures. Hence, the EMD crystallites vary in terms of crystallite domain sizes, microstructural defects, and morphology.
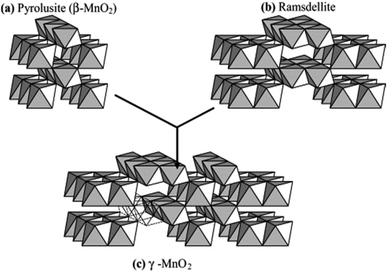 | ||
| Fig. 2 Basic building blocks of the γ-MnO2 structure in which (a) pyrolusite (β-MnO2) and (b) ramsdellite have been microscopically intergrown to produce (c) γ-MnO2 (reproduced from ref. 48 with the permission of Elsevier). | ||
2. Production of EMD from ores and secondary sources: a worldwide production, reserves including Indian deposits
EMD is generally produced from high-grade (50% Mn) manganese ore. Medium or low grade ore can also be used depending on the impurities present in it. Apart from the above, various Mn bearing secondary sources are also used for EMD production. Manganese ore (in terms of metal content), predominantly consists of pyrolusite or cryptomelane. South Africa owns rich deposits of manganese ore when compared to other countries in the world, as seen in, Fig. 3. The total reserves of manganese ore in South Africa have been estimated at 150 million tonnes, which is a world reserve of about 25% (shown in Fig. 3) while Ukraine has 140 million tonnes. Australia and Brazil possesses roughly 15% of the world's reserve of manganese ore. Reserves of ore were found to be relatively low in Gabon whereas countries like India and China are almost identical. Although countries like South Africa, other African countries, South America, Mexico and India are considered as major exporters of manganese ore, other than South Africa, the remaining countries are not considered as major producers of EMD; rather, China, US and Japan are regarded as the major producers of EMD. South Africa is self-sustainable in this respect, exporting manganese ores, producing EMD and making a major contribution to world EMD production. As per the recent survey,55 out of 465![[thin space (1/6-em)]](https://www.rsc.org/images/entities/char_2009.gif) 900 metric tons of EMD produced by the whole world in a year, China alone contributes about 64.02% and is well ahead of US (13.5%), Japan (7.13%), South Africa (6.48%), Greece (4.97%), Spain (2.38%) etc. (shown in Fig. 4). The share of India on the production front is rather low (0.22%). Worse even is that, India imports a major requirement of EMD from China, South Africa, and Australia and even from Ireland.
900 metric tons of EMD produced by the whole world in a year, China alone contributes about 64.02% and is well ahead of US (13.5%), Japan (7.13%), South Africa (6.48%), Greece (4.97%), Spain (2.38%) etc. (shown in Fig. 4). The share of India on the production front is rather low (0.22%). Worse even is that, India imports a major requirement of EMD from China, South Africa, and Australia and even from Ireland.
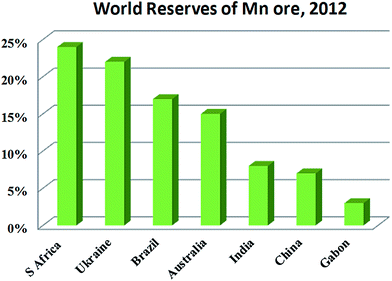 | ||
| Fig. 3 World reserves of manganese ore in terms of metal content (replotted using the data of U. S. Geological Survey Mineral Commodity Summaries, USGS 2015). | ||
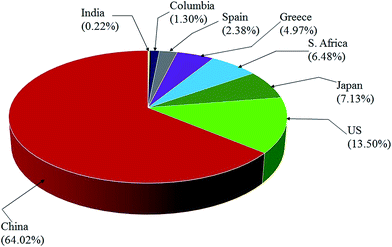 | ||
| Fig. 4 Pie chart showing the world EMD production capacity by country (replotted using the data from ref. 55). | ||
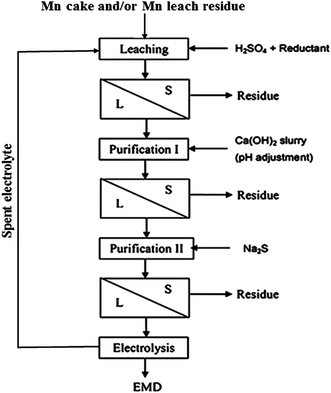
India has vast deposits of low, medium and high grade manganese ores, but the minerals do not occur in the form in which they are primarily required to function as effective depolarizer in the dry cell batteries. Indian deposits mostly occur as pyrolusite, cryptomelane, psilomelane and manganite along with hematite, goethite, limonite, silica, phosphorus and potassium as impurities. None of these ores are suitable for direct use in the battery as natural depolarizer. India has no deposit of ramsdellite or natural γ-MnO2 and rhodochrosite (MnCO3). The latter does not require pre-reduction or calcination for further processing to produce EMD. Actually, EMD is produced from the ore through various stages. The different stages involved in the production of EMD from an ore are shown in Fig. 5 in the form of a flow chart.
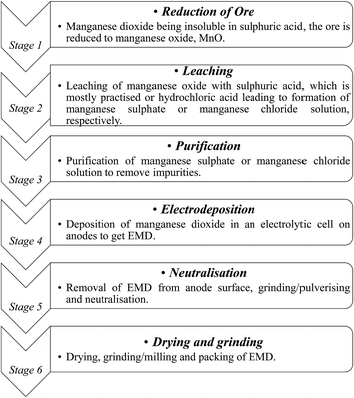 | ||
| Fig. 5 Flow sheet showing various stages involved during the pilot scale production of commercial EMD from its raw material. | ||
EMD can be produced from natural manganese ores during its processing.56 The ore was first calcined at 700–950 °C in an oxidizing atmosphere which was then leached at 70–100 °C using spent electrolyte containing H2SO4 and MnSO4, and then filtered. The residue was washed with water and dried to obtain activated MnO2 as a by-product. The filtrate was then electrolyzed to obtain EMD. In a similar manner, it can be produced from a pyrolusite ore (MnO2 88.71, Fe 1.11, Al2O3 0.7, SiO2 0.5%)57 by roasting at 800 °C for 1.5 h followed by leaching the roasted sample with spent electrolyte containing 50 g L−1 H2SO4 at 80 °C for 3 h which was then filtered to obtain a leach liquor containing MnSO4 used for the preparation of EMD. Very similar process was also adopted by Taylor58 for the production of EMD from MnO2 or MnCO3 ore. Numerous reports are available on the synthesis of γ-MnO2 (EMD) from various manganese ores.59–61 The rapidly growing demand for manganese has made it increasingly important to develop processes for economic recovery of manganese from low-grade manganese ores and secondary sources,62 however very scanty information is available in this area. In order to fulfill the escalating demand of EMD for energy storage applications against the rapid consumption of primary resources, the recovery of Mn as EMD from secondary resources is very highly important.
Attempts have been taken to produce EMD from secondary sources such as spent household battery materials,63,64 manganiferous materials such as anode mud,65 Mn cake, Mn leach residue,66–68 Cobalt Manganese Bromide (CMB) spent catalyst sludge69 etc. High-quality EMD were manufactured and developed by HiTech Energy Ltd70,71 from low grade Mn ores and Mn-waste sources by treating the source in a low-dithionate acid leach process for alkaline battery market. Simultaneous deposition of zinc and manganese dioxide have been carried out from the leach liquor generated from spent house hold alkaline batteries containing 21 wt% Zn and 45 wt% Mn with some impurities such as K, Fe, Pb etc. The spent battery material was leached in 0.7% sulphuric acid at 70 °C temperature for 4 h which resulted in 40% manganese extraction with complete dissolution of zinc.63 Nguyen64 also carried out similar work by treating a mixture of a waste material consisting of spent batteries and other electronic components with acidic solvent comprising tetra fluoro boric acid, and preferably a reducing agent and boric acid and then subjected to electrolysis in which zinc metal and manganese dioxide get deposited on the cathode and anode respectively. Manganese cake and leach residue are the side products obtained from Mn nodule processing. Manganese nodule, abundantly available on the ocean floor is a potential source for manganese. One of the CSIR labs (Institute of Minerals and Materials Technology) in India has developed and pilot-tested a hydrometallurgical process to recover Cu, Ni and Co from manganese nodules.72,73 These nodules were initially subjected to crushing and grinding. The ground nodule was then taken for ammonia–ammonium sulphate–SO2 leaching (Fig. 6) followed by solid liquid separation.
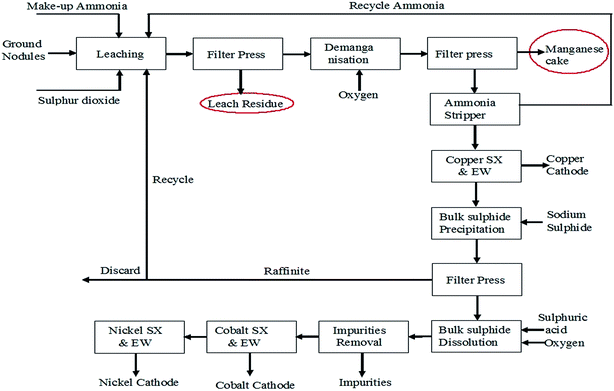 | ||
| Fig. 6 Process flow sheet for poly-metallic nodule processing to recover copper, nickel and cobalt (replotted from ref. 73). | ||
The residue obtained in this step was treated as the manganese leach residue or low grade ore. Manganese cake – a precipitated oxide of manganese – was produced during the demanganization step, i.e. removal of residual Mn(II) from ammoniacal leach liquor by oxidizing under oxygen over pressure. The main objective of processing the seabed manganese nodules was to recover the valuable metals such as copper, nickel and cobalt leaving behind the leach residue and the manganese cake as wastes. However, as these waste materials contain appreciable concentrations of manganese in them, recovering manganese values had improved the overall economy of nodule processing technology. Hence, attempts have also been made previously to recover manganese values from the purified acidic leach liquors of cakes and residues by electrolysis to produce manganese dioxides and testing their suitability for rechargeable batteries.36–38,66–68 The process flow sheet for production of EMD from the above discussed secondary ores was shown in Fig. 7. The process involved leaching of the Mn cake/residue followed by solid–liquid separation with two stages of purification such as Fe removal in stage I purification and removal of Cu, Ni, Co, Zn in stage II purification involving solid liquid separation in each stage, then the final purified solution goes for electrodeposition of MnO2.
Although various attempts have been taken to produce EMD in India but still India imports major requirements of EMD from China, S. Africa and Australia. Also the quantity of import (metric tonnes, MT) increases from the year 2011 to the year 2013 (Fig. 8). This reflects the need of EMD in India.
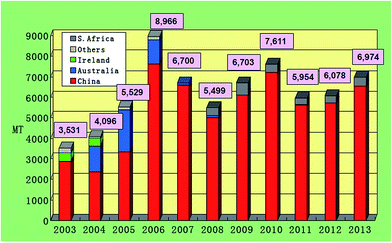 | ||
| Fig. 8 Chart showing EMD imports of India by country (extracted from ref. 55). | ||
2.1 Worldwide scenario of EMD growth
EMD was introduced to battery producers in 1918. Currently 40 billion primary manganese dry cells are produced all over the world, out of which 18 billion are alkaline batteries which consumed around 185![[thin space (1/6-em)]](https://www.rsc.org/images/entities/char_2009.gif) 000 tpa of EMD in 2008.74 Alkaline batteries are recording a growth rate exceeding 2% per annum in developed countries with an average growth of 3% per annum worldwide. EMD is also used extensively in lithium manganese secondary batteries. The growth rate is in excess of 10% per annum for primary lithium batteries. Half a billion lithium manganese version secondary (rechargeable) batteries are produced per annum with an annual growth rate of 20%, due to the demand in manganese versions of the lithium ion batteries for hardware tools and appliances. Further the demand is boosted due to its use in hybrid electric vehicles (HEV). The annual consumption of EMD in alkaline batteries has grown steadily over recent years reaching an estimated 225
000 tpa of EMD in 2008.74 Alkaline batteries are recording a growth rate exceeding 2% per annum in developed countries with an average growth of 3% per annum worldwide. EMD is also used extensively in lithium manganese secondary batteries. The growth rate is in excess of 10% per annum for primary lithium batteries. Half a billion lithium manganese version secondary (rechargeable) batteries are produced per annum with an annual growth rate of 20%, due to the demand in manganese versions of the lithium ion batteries for hardware tools and appliances. Further the demand is boosted due to its use in hybrid electric vehicles (HEV). The annual consumption of EMD in alkaline batteries has grown steadily over recent years reaching an estimated 225![[thin space (1/6-em)]](https://www.rsc.org/images/entities/char_2009.gif) 000 tpa of EMD by 2010 and it is estimated that there will be demand of alkaline grade EMD in excess of 390
000 tpa of EMD by 2010 and it is estimated that there will be demand of alkaline grade EMD in excess of 390![[thin space (1/6-em)]](https://www.rsc.org/images/entities/char_2009.gif) 000 MT per annum by the year 2017.74 Also another report by Mesa Minerals suggests that EMD in alkaline battery format has captured 54% of the disposal battery market by 2007, and is heading towards a share of 80% by 2020 (Fig. 9).75 All these studies confirm that the importance of EMD and its need in Indian market. To this end, this perspective aids the energy/materials researchers to focus on improving the production of EMD.
000 MT per annum by the year 2017.74 Also another report by Mesa Minerals suggests that EMD in alkaline battery format has captured 54% of the disposal battery market by 2007, and is heading towards a share of 80% by 2020 (Fig. 9).75 All these studies confirm that the importance of EMD and its need in Indian market. To this end, this perspective aids the energy/materials researchers to focus on improving the production of EMD.
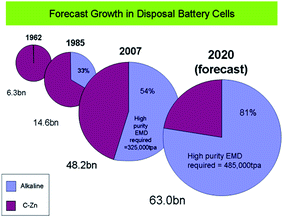 | ||
| Fig. 9 Forecast growth of EMD disposal battery cells (extracted from ref. 75). | ||
3. Synthesis of EMD in lab scale
3.1 Electrochemistry of EMD
EMD (γ-MnO2) can be prepared from the direct electrolysis of an aqueous bath of manganese sulfate and sulphuric acid. The electrochemical deposition of MnO2 on an inert electrode from an electrolyte containing Mn2+ occurs as per the reaction (1) noted below.76–78| Anode: Mn2+ + 2H2O → MnO2 + 4H+ + 2e− | (1) |
| Cathode: 2H+ + 2e− → H2 | (2) |
| Overall reaction: Mn2+ + 2H2O → MnO2 + H2 + 2H+ | (3) |
After electrolysis, massive deposit of EMD formed on the anode surface is removed mechanically, ground, washed, neutralized and then dried before being taken for testing to find out its suitability as battery material.
There are numerous literatures reporting synthesis of EMD from aqueous solutions claiming the products on the anode are mostly either in amorphous hydrated form or in low crystalline γ-MnO2 form.79–82 A limited number of papers, have focused on the deposition mechanism of MnO2-based materials.78,83–87 The manganese dioxide electrodeposition mechanism has been illustrated to follow two possible pathways, dependent upon the concentration of acid in the manganese sulphate solution.78,83,88–90 The two pathways have been designated as (a) low acid (∼0.1 M) (Scheme 1) and (b) high acid (∼5 M H2SO4) (Scheme 2). Thus, regarding the anodic formation of pure MnO2, the following two schemes have been proposed.78,84,87
Electrodeposition begins with the diffusion of Mn2+ ions to the surface of electrode, irrespective of the acidity of solution, which is followed by the oxidation to Mn3+. The Mn3+ ions generated are hydrolyzed to MnOOH in low acidic or neutral solution. MnOOH accumulated at the electrode surface can be oxidized to MnO2. This scheme is preferable for Mn3+ species that are unstable in solution. On the other hand, in highly acidic solution, the Mn3+ ions disproportionate rapidly into Mn2+ and Mn4+ ions, then which were hydrolyzed to MnO2. In both cases, the rate determining step has been identified as transfer of Mn2+ ions in solution toward the electrode surface.
In a similar way, Clarke et al.78 proposed two schemes by conducting rotating disc electrode (RDE) and rotating ring disc electrode (RRDE) voltammetric studies on the electrodeposition of manganese dioxide. They reported that in high acid (>1 M) solutions, almost all of the electrogenerated Mn3+ goes into solution leading to MnO2 precipitation possibly due to disproportionation reaction by Mn3+–Mn3+ collision. However, with low acid (<1 M) manganese sulphate baths, formation of very little Mn3+ followed by its hydrolysis and subsequent precipitation to MnOOH heading for its oxidation to MnO2 through solid state reaction is the designated path. The reaction schemes for both low and high acid mechanistic path are shown below.
Low acid path (<1 M)
| [Mn(H2O)6]2+ ↔ [Mn(H2O)6]ads2+ | (12) |
| [Mn(H2O)6]ads2+ → [Mn(H2O)6]ads3+ + e− | (13) |
 | (14) |
| MnOOH → MnO2 + H+ + e− (slow) | (15) |
High acid path (>1 M)
| [Mn(H2O)6]2+ ↔ [Mn(H2O)6]ads2+ | (16) |
| [Mn(H2O)6]ads2+ → [Mn(H2O)6]ads3+ + e− | (17) |
| [Mn(H2O)6]ads3+ → [Mn(H2O)6]3+ | (18) |
| 2[Mn(H2O)6]3+ → [Mn(H2O)6]2+ + [Mn(H2O)6]4+ (slow) | (19) |
| [Mn(H2O)6]4+ → → MnO2 (fast) | (20) |
3.2 Synthetic conditions
Electrodeposition of manganese dioxide has been strongly influenced by various factors such as electrolyte, current density (CD), types of electrodes (anode and cathode), the bath temperature of the electrolyte, type of current (direct current or pulse current) and the pH of the electrolyte.Usually EMD is prepared from manganese sulfate–sulphuric acid bath.36–38,66–68,76,91–102 Apart from sulphate bath, EMD can also be produced from chloride bath.25,104–107 The CD of 50–300 A m−2 and a bath temperature of 80–98 °C are maintained during electrolysis. Higher CD of 500–1000 A m−2 can also be applied for EMD synthesis within 1.5–3 h, with sulphuric acid concentration of 0.5–1.5 mol L−1.96 Devenney et al.97 carried out parallel and series electrochemical deposition experiments to produce EMD from electrolytes under varied concentrations of manganese (0.15–1.8 mol L−1) and acid (0.05–0.5 mol L−1) at different anodic current densities (25–100 A m−2) on titanium electrodes. The optimized conditions were found to be 0.59 mol L−1 Mn(II), 0.17 M H2SO4 and anodic CD of 62.5 A m−2 leading to the best performing EMD. Grainy EMD was deposited98 at a high current density of 3000 A m−2 from a sulphate bath of 0.9 mol L−1 Mn(II) and 2.5 mol L−1 sulphuric acid.
During anodic deposition, selection of anodes also plays a vital role in determining the current efficiency (CE), energy consumption (EC) and quality of the deposited material. Anodes having good mechanical strength, low corrosion rate, low deposition potential and better electrical contact are suitable for EMD production.99 Based on Preisler's99 observation Ti seems to be a very attractive anode material and has been used for EMD deposition by many researchers.25,97,99,106,108–110 The selection of suitable anode material for the deposition of EMD has been briefly highlighted by Rethinaraj and Visvanathan.108 The authors discussed the nature of the anode material which is responsible for its service life and the electrolytic parameters for the purity of EMD. The concept of passivation of Ti substrate in an anodic environment during the preparation of EMD has been briefly presented. It has also been mentioned that the behaviour of titanium as anode material depends upon the judicious combination of physical, chemical and electrochemical treatments. EMD was also successfully deposited on pure lead.109 Kebadze et al.111 synthesized EMD on fibrous carbon electrodes as cathodes and anodes and observed that use of these electrodes improved process parameters (materials consumption, current density, specific electric power) for the electro-synthesis of MnO2. Absence of admixtures of metallic electrode materials for electrolytic deposition of MnO2 improved its quality as a cathode material for Zn–MnO2 power system with an alkaline electrolyte. Recent studies112 showed that the energy consumption can be strongly reduced by varying the cathode substrate during electrodeposition of EMD. In this study a new eco-friendly energy saving method was adopted just by replacing the traditional cathodes with a Pt/C gas diffusion electrode (GDE). The corresponding anode used in this study was Ti based Ti–Mn alloy. This method was able to minimize the energy consumption and release of toxic acid mist during electrodeposition of EMD. Effect of lead based anode materials on the EMD deposition process was also examined in our previous work.103 It was observed that pure lead would be the good choice among other lead based dopant anode materials and titanium based anode materials owing to its cost effectiveness and anodic passivation problem that occurred in case of titanium anodes.
The physical as well as electrochemical properties of EMD can be strongly influenced by the bath temperature from which it gets deposited. Mauthoor et al.113 varied the bath temperature between 90 to 108 °C. They report 9% higher discharge capacity of EMD when deposited from a bath having 95–108 °C than that of 90–95 °C. However on increasing the temperature beyond 105 °C, the discharge capacity decreased slightly. Ghaemi et al.114 in his doctoral work has found that EMD produced at a low bath temperature of 60 °C showed inferior capacity than the EMDs produced at a bath temperature of 96–98 °C. Later, investigation was also carried out by Ghaemi et al.115 on a wide range of temperature from 60–120 °C. The author found that high temperature of the bath leads to the formation of EMDs with high crystalline grade and consequently more structural hardness with better electrochemical performance. EMD produced from low temperature bath leads to the frail EMD.
Preisler100 discussed the suspension bath process (SBP) in which addition of solid particles of manganese oxides to the electrolyte bath allows the anodic current density to be increased to values more than twice that used in the conventional EMD processes. Analysis of deposition conditions and properties of the SBP-EMD showed that the SBP-EMD resembled EMD which has been deposited at very low current densities i.e. lower than the current density used. This pseudo low current density causes adsorption of the suspended particles on the anode surface, thereby promoting dendritic crystal growth on the adsorbed particles thus increasing the real anode surface area by up to a factor of ten. A thermal-modulated electrodeposition technique was proposed by Ghaemi et al.109 for enhancing the physico-chemical characteristics of EMD. Synthesis was carried out on the basis of non-isothermal electrode heating at ambient pressure. Both Ti and Pb substrates were heated continuously during the anodic deposition processes in boiling sulphuric acid solutions at constant deposition parameters with a varied temperature range of 98–150 °C. Graphite was also taken as another anode substrate for this investigation. At optimized anode temperatures (120–135 °C), both series of products displayed enhanced charge–discharge performance. This was consistent with the compact surface morphologies which were obtained for thin layers of EMD deposited on graphite substrates. Kononov et al.116 also synthesized EMD on a heated anode. He reported that raising the anode temperature (during synthesis) resulted in the formation of mostly γ-modification of EMD. As a result, the specific energy of a chemical power cell increased. pH of the electrolytic bath had remarkable effect on the crystal structure, particle size, porosity, and the electrochemical performance of the EMD produced.102,117–119 Studies revealed that α/γ-MnO2 electrodeposited at pH 2 exhibited good electrochemical performance, and the α-MnO2 displayed very stable cycling behaviour117 and EMD deposited at pH 6, performed well in electrochemical capacitor applications.118 Nano-tailoring of EMD in different morphological varieties such as nano-grains, nano-rods, nano-spheres, nano-columns, and nano-cavities can also be possible by adjusting pH.119 In this study during EMD deposition the stability of the passive layer, which is formed by an oxygen-containing intermediate Mn(III) species is strongly depended to acidity of electrolyte, affected the characteristics of EMD such as the nano-structure morphology, type of isotherm, the hysteresis behavior, the specific surface area, and crystal structure. As a result of which γ-EMD was obtained as a main product with α-EMD and β-EMD as side-products at low and high pH respectively. Apart from the conventional direct current (DC) electrodeposition methods, Adelkhani et al.120 also able to synthesize EMD using optimum conditions of pulse current electrodeposition (PCD) at lower bath temperature of 80 °C. The produced EMD showed better performance in terms of its cycle life.
(a) Ex situ method
Ex situ mixing basically refers to mechanical mixing of dopant with MnO2 material which can be termed as physically modified MnO2 (PM-MnO2).
(b) In situ method
In situ mixing refers to the addition of dopants into the electrolytic cell during electrodeposition normally termed as in situ modified EMD.
3.2.1.1 Ex situ modified EMD.
Titanium-based dopants. Anatase TiO2 is added to the EMD cathode by 0.1 to 5 wt% of the total (weight) wt of the cathode with graphite powder during the pellet preparation.3 Addition of small amounts of the anatase crystal structure of TiO2 to the cathode active material of conventional primary Zn/MnO2 alkaline cells increases the discharge capacity of such cells at high and medium drain rates. Incorporation of small amounts of TiB2 and TiS2 or TiB2 and Bi2O3 additives into EMD by physical mixing has been reported by Raghuveer and Manthiram.4,5 This material was prepared by mixing 75 wt% of modified EMD with TiB2, TiS2, Bi2O3 + TiB2, or Bi2O3 + TiS2 additive with 20 wt% graphite and 5 wt% polytetrafluoroethylene (PTFE) as binder in a mortar and pestle, followed by rolling the mixture into thin sheets. Both the TiB2 and TiS2 additives are found to offer better cyclability at higher number of cycles. Similarly EMD modified with 0.5–2 wt% of TiB2 in the presence and absence of Bi2O3 improved the cyclability of EMD just after the capacity drop between first and second cycle. Effect of TiB2 (ref. 7) and TiS2 (ref. 6) as additives in the EMD cathode was also investigated with varying the amount by 1, 3 and 5 wt%. The incorporation of small amounts of TiB2 and TiS2 additives into MnO2 were found to improve the battery performance. The undoped EMD showed (in Fig. 10A) higher discharge and charge voltage profiles than the doped samples but the degree of active material utilization is quite high for the battery containing multiple additives (Bi2O3 and TiS2) in it. The discharge capacities for the undoped EMD and doped EMD comprising 5 wt% Bi2O3, 5 wt% TiS2, and 3 wt% Bi2O3 + 2 wt% TiS2 are calculated to be 155, 170, 200 and 240 mA h g−1 respectively. The electrochemical performance indicates that the addition of small amounts of multiple additive lead to a significant improvement in the energy storage capacity compared to the individual additives. The role of these multiple additives has been reported6,7 to delay the dissolution of Mn3+ ions thereby inhibiting the formation of unwanted rechargeable products (like MnOOH, Mn(OH)2 or δ-MnOOH) during discharge. The cyclability data, Fig. 10(B), ascertains all the alkaline cells are rechargeable but the EMD containing multiple additives holds higher capacity 200 mA h g−1 even after 25 cycles and retaining excellent energy storage. This suggests that EMD containing Bi2O3 + TiS2 additives can be a potential candidate for aqueous rechargeable batteries.
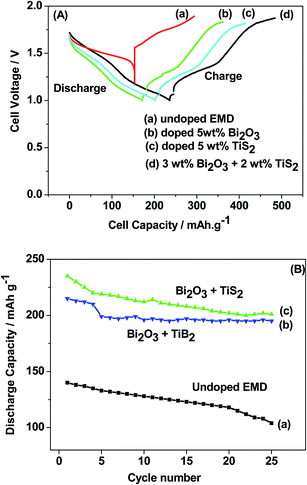 | ||
| Fig. 10 (A) Galvanostatic discharge–charge curves and (B) cycling stability of Zn|LiOH|EMD battery in the absence and presence of additives in saturated LiOH electrolyte. | ||
Tin and lithium based dopants. In continuation to Ti-based dopants, tin and lithium have also been commonly used. Addition of a tin dioxide (SnO2) additive to the manganese dioxide cathode has been investigated.121 The cathode is prepared by optimized amount of mixture comprised of MnO2, the SnO2 and the graphite to obtain a homogeneous mixture. The modified EMD cathode was found to increase the service life of Zn/MnO2 alkaline batteries. LiMn2O4 nanoparticles were synthesised by inserting Li into EMD in an aqueous medium with glucose as a mild reductant in open air followed by calcination at 750–800 °C.122 This material showed superior discharge rate and stable cycle behaviour. Bowden et al.123 also prepared lithium doped EMD (LiEMD) by adding solid lithium hydroxide to a suspension of EMD by distilled water, followed by pH adjustment. Then after overnight stay, the solution was filtered and dried at 110 °C then heated at 350 °C to produce LiEMD. LiEMD is found to be easily discharged and has a capacity slightly less than that of heat treated EMD (HEMD) but discharges at a higher voltage and in a reversible manner suggesting better service on high drain discharge.
Bismuth based dopants. Several investigations have been carried out8–13 to study the effect and utility of bismuth based dopants on improvement of discharge capacity and cycle life stability of EMD. However for the first time this important breakthrough was made14–16 by incorporating significant amount (>5 wt%) of Bi2O3 in to chemically modified, physically modified manganese dioxide and also γ-manganese dioxide showing the importance of bismuth in the rechargeability of EMD. Fig. 11a shows the typical cyclic voltammogram (CV) for the undoped EMD and Bi2O3 doped EMD. The active material was cycled between the potentials +0.6 and −0.6 V at a scan rate of 5 mV s−1. Initially, the scan started at the 0.6 V region in the cathodic direction and then reversing back to the starting point. As can be seen in Fig. 11a, the redox peaks for undoped EMD are not well resolved, indicating that in an aqueous LiOH as the electrolyte the faradaic reaction is difficult under the given scan conditions but interestingly, it becomes electrochemically active in the presence of Bi ions in the EMD (MnO2 structure). The reduction and oxidation peak for Bi-doped EMD is seen at −0.28 V and +0.27 V with a peak separation of about 0.55 V. Galvanostatic charge–discharge measurements conducted between 1.0 to 2.0 (vs. metallic Zn) at a current density of 0.5 mA cm−2 to further evaluate the properties of cyclability for practical applications. As shown in Fig. 11b, it can be observed that Bi-added samples are more reversible and sustains for multiple cycles. The discharge battery capacity of the Bi doped EMD after 100 cycles showed 100 mA h g−1 while the undoped EMD showed a low storage capability of 60 mA h g−1 after 40 cycles.
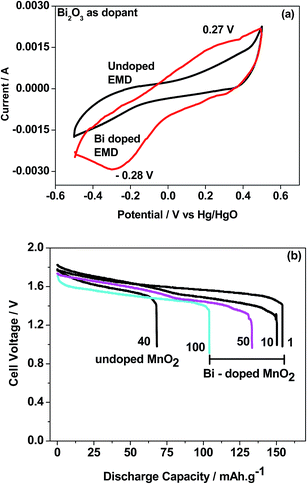 | ||
| Fig. 11 (a) Cyclic voltammogram (CV) and (b) galvanostatic charge–discharge curves of undoped and Bi added MnO2 (cycle numbers are indicated in the figure). | ||
High purity Ag3BiOx was prepared and doped into manganese dioxide at various ratios to improve the discharge performance and rechargeability by Wenjian et al.8 Raghuveer and Manthiram9 investigated the effect of semiconducting BaBiO3 and metallic Ba0.6K0.4BiO3 additives on the rechargeability of EMD cathodes in alkaline cells and concluded that both BaBiO3 and Ba0.6K0.4BiO3 additives lead to better cyclability compared to the low binary oxide Bi2O3. Pan et al.10 examined the electrochemical characteristic of manganese dioxide doped with NaBiO3. They found that MnO2 electrode doped with NaBiO3 (6%) possessed remarkably higher discharge voltage with higher discharge capacity and better reversibility when compared to pure MnO2 electrode or Bi2O3 doped MnO2 electrodes. Minakshi12 has investigated the electrochemical performance of Bi2O3-doped MnO2 in zinc-alkaline battery containing aqueous LiOH and found that the doped MnO2 cathode (electrolyte pH 10.5) showed superior performance over the previously reported11 MnO2 cathode (electrolyte pH 12).
Alkaline earth and rare earth metal oxides/ions based dopants. Alkaline earth metal oxides such as BaO, CaO, MgO strongly influence the electrochemical behaviour of the EMD in a Zn–MnO2 battery in LiOH electrolyte.17 Incorporation of BaO or MgO was found to result in higher discharge capacity (265 and 195 mA h g−1) and longer cycle life by reducing the access of Zn ions to the MnO2. The cycling behavior of these additives has been compared with undoped EMD and the results are shown in Fig. 12. The alkaline earth oxide added EMD especially BaO or MgO was found to result in significantly improved initial discharge capacity to that of undoped EMD. However, the BaO doped EMD loses its capacity quickly (to 106 mA h g−1) upon cycling and approached the value similar to that of additive free cathode after 25 cycles. In the case of MgO doped cell retains the cyclability to 140 mA h g−1 after 25 cycles and improved the cell capacity to 25%. This demonstrates that alkaline-earth oxides have role on the electrochemical behavior of the MnO2 cathode but not in similar mechanism to that of observed for a range of other additives (TiB2; TiS2; Bi2O3) in that the formation of non-electroactive forms of rechargeable products are suppressed. Attempt was also taken to investigate the effect of rare earth oxide such as CeO2 on the electrochemical behaviour of EMD.18,19 Minakshi et al.18,19 reported that 2 and 5 wt% of the CeO2 additive in the manganese dioxide (MnO2) cathode enhanced the performance of the cell in terms of capacity and resistance to capacity fade with cycling of a cell having zinc anode and an aqueous saturated lithium hydroxide solution as the electrolyte. The results revealed that the undesirable oxygen evolution reaction could be suppressed in presence of CeO2, which improves the columbic efficiency and provides a greater driving force to convert the discharge product back into active MnO2. It was found that CeO2 modified EMD showed improved performance by increasing the capacity from second discharge cycle onwards, which was attributed to the stabilizing effect imparted by CeO2 on MnO2 crystal lattice during discharge by suppressing the capacity fade and thus increasing the oxygen evolution potential.
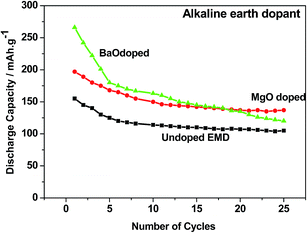 | ||
| Fig. 12 Cycling profile of EMD cathode containing additive-free, MgO and BaO (2 wt%) additives in a Zn-EMD type MnO2 battery. | ||
3.2.1.2 In situ method.
Titanium-based dopants. Binder et al.20 have reported that Ti(IV) was very useful in stabilizing the structure of EMD. They doped Ti(IV) ions into the EMD matrix via in situ i.e. during anodic deposition of EMD from an acidic solution of manganese sulphate. Zhou et al.21 produced EMD samples doped with Ti(IV) by electrolyzing MnSO4–H2SO4 solutions with titanium compound as an additive. Jantscher et al.22 reported in situ doping of titanium ions by adding tetra-n-butoxy titanium to the electrolytic bath. The titanium doped EMD exhibited superior charge retention and rechargeability when compared to the titanium-free samples. Nartey et al.23 produced titanium-doped EMD by adding organo-titanium compounds such as tetra-n-propoxytitanium (Ti(OC3H7)4), tetra-n-butoxytitanium (Ti(OC4H9)) and titanium-oxysulphate (TiO(SO4)) to acidified aqueous solutions of manganese sulfate during anodic deposition. The doped EMD samples performed well in comparison with TOSOH-Hellas GH-S commercial grade EMD.
Metal ions as the dopants. Electrodeposition of manganese dioxide is very sensitive to the presence of various metallic (inorganic) impurities. For example, the influence of potassium ion on the deposition as well as the chemistry of EMD was investigated by Kao et al.124 They reported that higher acid concentrations/current densities decreased the amount of incorporated K+. The effect of incorporation of metal ions (Ni2+, Zn2+, Co2+, Cu2+, Fe2+, Pb2+) in EMD during its preparation from manganese sulphate–sulphuric acid bath was investigated by Tamura et al.24 The studies demonstrated that these ions incorporated into the EMD matrix and the behaviour of EMD was a function of the kind of metal ions used and its concentration. Castledine and Conway125 have studied the effect of in situ addition of Bi3+ during electrodeposition of MnO2 films. The study suggested that bismuth may assist the nucleation and growth process assisted with formation of Mn(OH)2. Tong and Lian126 in their study found that when graphite, Ti, and Ti–Mn alloy anodes were used during electrodeposition of manganese dioxide from MnCl2/HCl electrolyte in the presence of Ti(IV), Bi(III), Pb(II), Ni(II), and Ti(III) ions, the anode potential of the graphite was reduced while the Ti–Mn alloy anode resisted passivation. However, the Ti anode got seriously poisoned by Pb(II) ions and got passivated rapidly. Doping of Ti ions caused the discharge capacity to be increased. EMD doped with Bi(III), Ti(IV), or Ni(II) ions stabilized the structure of MnO2 to some extent during charge–discharge cycles. Similarly, Kolosnitsyn et al.25 studied the effect of Ca2+, Mg2+, Fe2+, Al3+ ions on EMD deposition from manganese chloride–hydrochloric acid bath and found that calcium and magnesium ions had no adverse effect on the electrodeposition process however iron and aluminium ions deteriorates the electrolysis process. In an another study Bodoardo et al.127 found that Al containing MnO2 powders show a higher discharging capacity and seem to ensure a higher cyclability. Sokolsky et al.128 when studied the effect of Co2+ ions during the electrodeposition of manganese dioxide from fluoride bath they found that cobalt has strong effect on the phase and morphology of EMD. Different physical and electrochemical properties of EMD was observed when deposited from manganese sulphate–sulphuric acid bath containing Ca2+, Mg2+ and Na+.67 The result revealed that EMD deposited from the bath containing Mg2+ ion have better cyclic stability than that of EMD deposited from Na containing bath.
Addition of Ce as CeSO4 in the electrolytic bath affects the deposition of γ-MnO2 causing apparent increase in the porosity and manganese vacancies population.26 This was explained on the basis that during electrodeposition of manganese dioxide, co-deposition of Ce(III) took place which did not get into the MnO2 lattice due to its larger size compared to Mn4+ or Mn3+. This would ultimately lead to an increase in manganese vacancies in the lattice. This effect, in addition to the large amount of micro twinning approaching 100% and the appreciable decrease in de Wolff defect, lead to an easier release of structural water and lower activation energy. This helped the Ce added EMD sample to show better electrochemical property.
Nanosized γ/α EMD was prepared from chloride bath of MnCl2 (ref. 129) and the effect of additives such as MgCl2 and HCl on its crystal structure was investigated. As per the results, MgCl2 helped in increasing the crystallinity of EMD produced from MnCl2 solution where as HCl (2 mol L−1 HCl in 0.05 mol L−1 MnCl2) helped in depositing α-MnO2 as well as increasing the surface area of EMD.
Surfactants as dopants during EMD synthesis. Surfactants play a significant role in modifying the growth pattern (and hence the physicochemical properties) of MnO2 through adsorption on its surface.32 Adsorption of surfactants on the surface influences the kinetics of electron transfer through blocking of active sites, and also affects electrostatic interactions between electroactive species in the electrolytic bath. Consequently, addition of organic surfactants to the electrolytic bath affects the morphology and mechanical properties of electrochemically deposited material, leading to altered electrochemical behavior of materials. Many researchers have reported the use of surfactants during preparation of materials for battery applications.27–33 Ghaemi et al.27 have reported that as-prepared EMD was unsuitable for rechargeable battery application. But when EMD was prepared in the presence of t-octyl phenoxy polyethoxy ethanol (Triton X-100), the charge–discharge cycle behavior was improved. Devaraj and Munichandraiah29 reported that Triton X-100 resulted in an increase in specific capacitance of an energy storage device which they referred to as could be due to strong adsorption of the surfactant. EMDs prepared in the presence of cetyl trimethyl ammonium bromide (CTAB) or sodium n-dodecyl benzene sulfonate (SDBS) were reported to be suitable for battery applications.28 Liu et al.130 synthesized EMD material with nano-fibrous morphology employing a non-ionic surfactant namely Brij 56. The nanoporous/nanocrystalline EMD material effectively accommodates the structural transformation during lithium insertion and avoids deleterious morphological changes as observed in battery materials composed of large particles. And hence, the material modified with Brij 56 as surfactant exhibited outstanding cycling stability in addition to better electrochemical performance. The influence of anionic surfactant such as sodium dodecyl sulphate (SDS) on the supercapacitive behavior of EMD was studied by Suhasini34 and Zhang et al.35 They reported that addition of suitable amount of SDS changed the morphologies, reduced the particle size, and increased the specific surface area as well as the electrochemical behaviour of the MnO2 samples.
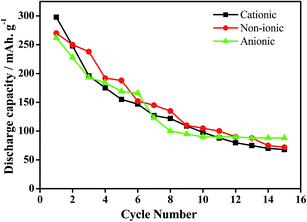
In our earlier works, we have discussed the effect of series of cationic36 non-ionic37 and anionic38 surfactants on the physicochemical as well as electrochemical activity of EMD. It was observed that EMD deposited from a bath containing cationic surfactants such as quaternary ammonium salts tetra ethyl ammonium bromide (TEAB), tetra propyl ammonium bromide (TPAB), tetra butyl ammonium bromide (TBAB) were found to be suitable in increasing the current efficiency (CE) and decreasing the energy consumption (EC) of the EMD deposition process. The presence of non-ionic surfactants (Triton X-100 and Tween 20) enhances the electrochemical activity of EMD, not only by modifying the structure but also by increasing the BET surface area and porosity of the EMD samples. EMD doped with surfactants have good cycle life in spite of a decrease in initial discharge capacity, relative to surfactant-free EMD. Optimum concentration of surfactant must be essential for the positive consequences in the performance and behaviour of the EMD. A unique observation of potassium intercalation was identified through TEM imaging and RBS analysis (not shown here), and the extent being greater for TX-100 as the surfactant.37 Anionic surfactants (sodium octyl sulphate, sodium dodecyl sulphate and sodium tetra decyl sulphate) strongly influenced EMD crystal morphology. The morphology of the electrodeposited manganese dioxide (EMD) particles, in the absence and presence of anionic surfactants showed, preferential adsorption of a surfactant will delay the relative growth rates of MnO2 particles. The presence of sodium tetradecyl sulfate (STS) as surfactant during EMD deposition efficiently promotes both ion and electron transport in the host MnO2 matrix due to its nanostructured deposition, forming a highly porous structure. Fig. 13 shows the cycling performance of Zn-EMD cells modified with surfactants. The enhanced energy storage properties of the STS based EMD deposition exhibiting nano aggregate particles (shown in Section 4; Fig. 16c) efficiently enhance the ion transport from the electrolyte to the host EMD particles.38 Electrochemical studies of the electrodeposited EMD in the presence of STS as a surfactant indicate it is a potential candidate for use as electrode material in alkaline rechargeable batteries.38
3.3 EMD composite
Attempts have been made by different researchers to produce EMD composites, nano EMD, EMD nano wires etc. which can be used not only in primary batteries but also in lithium rechargeable batteries. Cyclic voltammetry and chronoamperometry techniques have been used to synthesize these materials.MnO2 nanowire arrays electrodeposited in anodic aluminum oxide (AAO) as template on Ti/Si substrate131 and heat-treated at 200 °C showed ideal capacitive behavior and its relevant details have been given in Section 5.4. Lee et al.132 have reported the electrochemical characteristics of manganese oxide/carbon composite as a cathode material for Li/MnO2 secondary batteries. EMD was prepared from a simulated leaching solution of spent alkaline batteries using a modified cyclone cell. EMD/C composite was heat-treated at 400 °C after high-energy mechanical milling. The heat treatment resulted in better electrochemical performance than that of pure EMD in terms of cyclability and capacity fading. Cyclic voltammetric technique has been employed for the electro deposition of MnO2 nano wires133 and needle-like manganese oxide (α-MnO2) nanofibers134 on carbon nano tube (CNT) paper and conductive carbon fibre (CF) respectively for electrochemical energy storage devices. The results revealed that the intercalation of proton into the MnO2 structure was more pronounced in aqueous electrolyte than in organic solvent. Chronoamperometry technique was used by Bahloul et al.135 for synthesising new composite cathode material by electrodepositing polybithiophene on EMD material in 0.01 MPBTh/0.1 M LiClO4/CH3CN at an oxidation potential of 1.1 V vs. saturated calomel electrode (SCE) for 20 min. The charge–discharge study, cyclic voltammetry, impedance spectroscopy, FTIR spectroscopy, and magnetic measurements revealed that the blend formed from the above two material showed very good discharge capacity and can act as an active material for Zn/γ-MnO2 cells. Chou et al.44 synthesised γ-MnO2 films with carambola-like nanoflakes by the combination of potentiostatic and cyclic voltammetric electrodeposition techniques, which were used in primary batteries. Thin films of electrodeposited manganese dioxide was prepared by Cross et al.84 from manganese sulphate and sulphuric acid baths which demonstrated excellent fast redox reactions and found suitable for storage applications. John et al.136 deposited EMD conformal films galvanostatically at 200–1000 A m−2 using a large surface area Pt mesh as counter electrode with a saturated HgSO4 standard reference electrode, saturated mercurous sulfate electrode (SMSE), onto planar Ti and 3D reticulated vitreous carbon (RVC) substrates. The electrodeposited films were heat treated at 400 °C for 5 hours to remove water from the EMD films and allowed for the reversible insertion and extraction of lithium. Nanostructures on-chip micro batteries were fabricated by Kim et al.137 in which a vertical array of MnO2 nanowires were grown on SiO2/Si substrates by anodic electrodeposition. The EMD nanowires having high surface area showed 150 mA h g−1 discharge capacity in multiple cycles which could be used as cathode material for lithium rechargeable batteries. MnOx thin films of two different variety ions were deposited by Xiao and Xu138 on graphite substrate by pulse current deposition and galvanostatic techniques. One of them (pulsed current) exhibited the characteristics phases of Mn3O4 showing a lower voltammetric charge and the other one (galvanostatic) showed the presence of Mn3O4 and MnOOH phases giving twice the amount than its counterpart. Chronoamperometry technique was used by Dupont et al.139 to deposit manganese dioxide thin film on platinum electrodes. They revealed an increase in surface area of the electrode due to the increase in current during deposition. Wu et al.140 prepared LiNi0.05Mn1.95O4 powders from manganese tetroxide (MTO) and EMD separately and found that both the materials had typical cubic structures and uniform particle sizes. However, they differ in their specific capacities, coulombic efficiencies and cycling performances. The LiNi0.05Mn1.95O4 powders prepared from MTO and EMD showed capacity retentions of 98.3 and 86.6% respectively after 30 cycles.
4. Characterizations of EMD
Depending on the experimental conditions, nature of additives used, and post treatment processes employed, the physicochemical as well as electrochemical characteristics of the electrolytic manganese dioxide would vary. Characterizations of EMD are very important to evaluate its suitability for energy storage materials. The capability of storing energy depends both on physical and electrochemical properties of the EMD material. Thus to evaluate the quality of the EMD prepared in various ways it is very important to characterise it extensively. As evidenced from the literature there are numerous ways by which EMD can be prepared. However it is also very important to evaluate its physicochemical and electrochemical properties to standardise it.Various physicochemical characterisation techniques such as X-ray diffraction (XRD), scanning electron microscopy (SEM)/field emission scanning electron microscopy (FESEM), Thermal analysis (TG & DTA), Transmission electron microscopy (TEM), BET (Brunauer, Emmett, Teller) surface area analysis, Fourier transform infrared spectroscopy (FTIR), electron energy loss spectroscopy (EELS), secondary ion mass spectrometry (SIMS) etc. and electrochemical characterisation techniques such as charge–discharge behaviour, cyclic voltammetry, chronoamperometry, impedance measurements etc. have been employed to evaluate the suitability of the battery materials that's been reviewed here. Importance of these techniques in characterising EMD have been discussed in detail below. However before individualising the characterisation of EMD in both doped and undoped part, the XRD, FTIR plots and SEM image of EMD (γ-MnO2) (Fig. 14) were presented for some of our samples to get more clear picture of EMD.
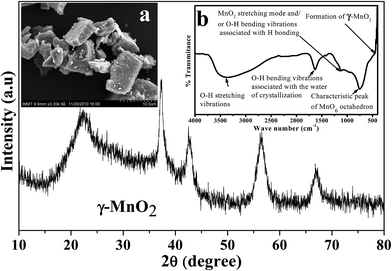 | ||
| Fig. 14 X-ray diffraction of EMD (γ-MnO2). Insets (left) show scanning electron micrograph, and (right) FTIR plot of EMD. | ||
4.1 Undoped EMD
EMD generally contain γ-phase and/or mixture of γ-MnO2 and ε-MnO2. XRD is the most useful technique to identify the phase formed in EMD, however other techniques have also been employed to support this. The presence of γ-MnO2 as a major component in EMD has been demonstrated by both XRD and TEM studies.141,142 Investigation carried out by Simon et al.51 showed only ε-MnO2 phase in XRD studies where as, TEM study showed γ-MnO2 phase as well. According to Rietveld refinement results of EMD, XRD patterns indicated that EMD could be adequately described using both γ-MnO2 and ε-MnO2 phases with an occasional occurrence of pyrolusite (β-MnO2). It was also proposed that the ε-MnO2 structure observed in both TEM and XRD was only a signature of disordered manganese occupancy of the long range hexagonal oxygen framework and not a discrete phase, and the EMD material predominately composed of short range ordered γ-MnO2. Minakshi et al.143 discussed the TEM characterization of EMD in order to show the Li intercalation mechanism. The valence state determination using electron energy loss spectroscopy (EELS) and lattice imaging by TEM confirmed that reduction of Mn occurred as a result of Li intercalation. Secondary ion mass spectrometry (SIMS) depth profile analysis supported the lithium intercalation mechanism. EMD showed γ-phase when produced from a bath temperature of 120 °C (ref. 115) in support of the observation that high temperature gives high crystallisation grade and consequently more structural hardness thus exhibiting better performance in its electrical charge–discharge properties. SEM/FESEM studies are the most powerful tools to identify the surface morphology of the produced materials. Various investigations66,91,92,98,102,117–119,144 have been carried out using this technique. FESEM images of electrodeposited EMD, from our previous studies,68 showed (Fig. 15a) significant difference in their morphologies between the EMD produced from synthetic manganese sulphate solutions and that obtained from secondary sources such as Mn cake and Mn leach residue/ore. EMD obtained from secondary sources showed spindle shaped morphology with netlike structure possessing higher surface area than that of EMD obtained from synthetic solution having anisotropic star shaped structure. A similar trend has been observed (Fig. 15b) for these samples when analyzed through TEM technique. The morphology observed for synthetic solution (rice like grains) differs from that seen for secondary sources (fibrous like structure). Current density has a marked effect on the current efficiency and energy consumption of EMD, and in addition it plays a crucial role in modification of the crystal structure of EMD. XRD revealed that the EMD obtained at a current density of 500–1000 A m−2 correspond to the γ-polymorph, and the γ-polymorph was clearly pronounced at 1000 A m−2.96 However from XRD, laser particle size analysis and SEM, it was observed that grainy EMD deposited at 3000 A m−2 consisted of γ-MnO2 with an orthorhombic lattice structure and had a spherical appearance with a narrow particle size distribution having an average particle diameter of 7.237 μm.98 Dura and Almeida144 reported that the nucleation and growth of EMD on titanium substrate is strongly influenced by bath temperature, electrode potential/current density and sulphuric acid concentration. Highest surface area of 168.8 m2 g−1 was found to be obtained at a bath temperature of 65 °C with a current density of 80 A m−2 where as the lowest surface area of 51.8 m2 g−1 was obtained at a bath temperature of 90 °C with a current density of 40 A m−2.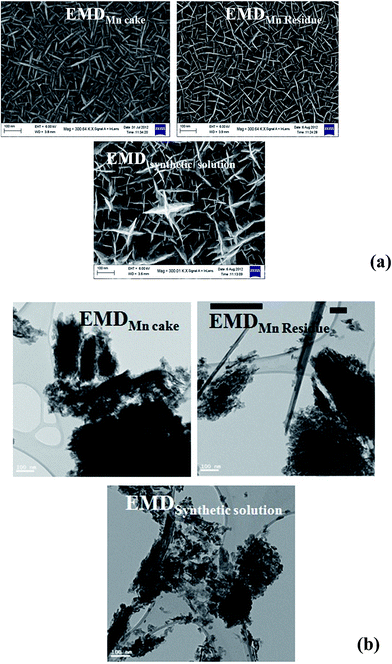 | ||
| Fig. 15 (a) Field emission scanning electron micrographs (FESEM) and (b) transmission electron micrographs of various EMD samples obtained from secondary Mn sources and synthetic solution (FESEM reproduced from ref. 68 with the permission of Springer). | ||
Infrared spectroscopy is a complimentary technique that assists to evaluate the changes in structural bonding in the inorganic EMD material. Various researchers have used this technique to determine the presence of OH− group, the distortion of MnO6 octahedra and H2O molecules that may be present as bound water within the crystal structure.145–149 Narita and Okabe145 discussed the formation and some properties of hydrous manganese dioxide. They also reported that hydrous manganese dioxide had the greater chemical reactivity. Fernandes et al.146 investigated the infrared spectra of chemically precipitated manganese dioxide and predicted that H2O molecules could be present as bound water within the crystal structure showing OH− stretching and bending vibration at different frequency range. Ruetschi147 also found that the different OH vibration modes were due to the associated molecules of water of crystallizations. Fitzpatrick et al.148 investigated the study of H+ insertion into EMD and found that sharp change in integrated areas of regions of the spectra were associated with OH− bond formation. Ananth et al.149 studied the electrochemical activity of γ-MnO2 polymorph and the distortion of the MnO6 octahedra associated with it. They found that electrochemical activity is independent of the constitutional water content however it influences the lattice structure. The distortion of the MnO6 octahedra is larger for the samples showing better battery performances, which was due to the presence of water. This was also supported by the crystallographic structure.
Qu150 investigated the porosity of EMD and studied the ionic diffusion rate and the electrochemically accessible surface area of the cathode by means of AC impedance technique. EMD with a considerable volume of large pores was found to be beneficial not only for high-rate discharge, but also for the cathode process during cell manufacturing.
4.2 Doped EMD
Dopants have no significant effect on the crystal structure/phase of EMD. Dopants when added with an objective of increasing the electrochemical activity, affect the surface morphologies. Some dopants increase the electrochemical activity of EMD by delaying the formation of birnessite (δ-MnO2) and from there on slow conversion to hausmannite (Mn3O4) phases during charge–discharge.XRD studies showed a characteristic diffraction pattern of γ-MnO2 for Ti doped EMD20,126 or an α-MnO2 phase (containing potassium) as a minor component along with the usual γ-MnO2 in presence of potassium ion.124 X-ray diffraction data supported by the observations from current voltage profiles gave the evidence that the better cyclability in the presence of BaBiO3 and Ba0.6K0.4BiO3 additives was due to the suppression of birnessite and hausmannite phases and a shifting of the second-electron capacity of Mn to higher potentials.9 XRD and FTIR spectroscopy confirmed that Bi2O3 enhanced the Li intercalation mechanism preventing the formation of the unwanted product in Bi2O3-doped EMD.12 XRD of alkaline earth metal doped EMD17 before and after discharging showed that during discharge, part of manganese was reduced to various oxy-hydroxides and lithium was also intercalated into the MnO2 structure to form LixMnO2. The peaks corresponding to the new phases in the BaO and MgO modified discharged cathode was higher in intensity indicating that the manganese was reduced to a larger extent, resulting in higher discharge capacity, as was evident in the cycling behavior. The presence of manganese oxides and hydroxides as the secondary compounds in the discharged product indicated that the role of alkaline earth oxide additives did not suppress the non-electro active compounds.6,7,11 SEM and Energy Dispersive X-ray spectroscopy (EDX) studies on EMD were reported by Matsuki et al.91,92 SEM of these deposits showed that EMD obtained from manganese sulphate and sulphuric acid bath at 95 °C, had fibrous microstructure in the presence of hydrochloric acid. With the increasing amount of hydrochloric acid up to about 0.1 M the crystal size of EMD has reported91 to become greater. XRD studies suggested that EMD showed predominantly a γ-MnO2 phase in presence of HCl and HNO3.
Incorporation of metal ions in the electrolytic bath has a strong influence on the crystal structure of EMD. The increase in surface area of EMD is discussed to be due to the suppression of the growth of EMD at the adsorbed foreign ion (such as Ni2+, Zn2+, Co2+, Cu2+, Fe2+, Pb2+) sites during its deposition that resulting in smaller EMD particles. Similarly, among Ca2+, Mg2+, Fe2+ and Al3+ ions25 there was no adverse effect of calcium and magnesium ions on the quality of manganese dioxide being formed, where as the presence of iron and aluminium ions in the electrolyte noticeably caused a deterioration of the product quality. However, Bodoardo et al.127 reported that aluminum improved the quality and uniformity of the contact between the manganese dioxide surface and graphite, by causing some morphological changes, thereby increasing the conductance and the amount of manganese dioxide available for the reduction. Addition of Ce as CeSO4 (ref. 26) and cobalt as cobalt sulphate128 in the electrolytic bath indicates that Ce affects the deposition of γ-MnO2 causing apparent increase in the porosity. EMD in presence of cobalt showed needle-like morphology having ramsdellite structure with significant content of hydroxide groups.
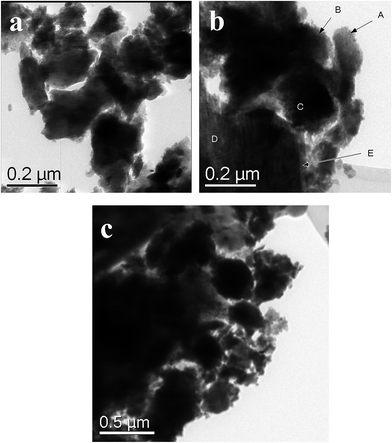
In situ surfactant-modified EMD samples have been significantly differentiated from the unmodified (surfactant free) EMD samples from their surface morphologies through the help of SEM/FESEM or TEM analysis.27,29,32,34,36–38 EMD modified with TX-100, CTAB and SDBS at an optimum critical micelle concentration (cmc) value (above cmc value) showed surface morphology consists of small needle-like fibres for TX and CTAB and a distribution of various sizes of smaller particles with each particle consists of not well developed needle like crystallites loosely packed together for SDBS surfactant.27 As reported by Suhasini34 MnO2 thin film deposited in presence of optimum concentration of sodium lauryl sulphate (SLS) as the surfactant possess greater porosity, and hence surface area, in comparison to the films prepared in the absence of surfactant. In our previous works,37,38 we have also reported the nanostructure morphology of EMD when deposited from a bath containing non-ionic surfactants Triton X-100 (TX-100) and Tween-20 (Tween-20)37 and anionic surfactants such as sodium octyl sulphate (SOS), sodium dodecyl sulphate (SDS), and sodium tetradecyl sulphate (STS).38 EMD deposited in presence of TX-100 and Tw-20 showed porous structure with fibrous-and spike like growth of EMD for the former and spherical nanoparticles in the range of 300 nm with an agglomerated form for the later one respectively at their optimum concentration. However it is interesting to note that, in presence of variety of anionic surfactants such as SOS and SDS, tube-like, narrow needle-like EMD particles were observed at their optimum concentration. Whereas, EMD obtained in the case of STS, it showed quite different morphology (as seen in Fig. 16) such as nano-sized rod-type clusters/grains with sizes in the range of 10–20 nm and nano-sized petal-like structures (not shown) for different concentrations of the surfactant. Thus the presence of all these anionic surfactants resulted in very highly porous nano materials.
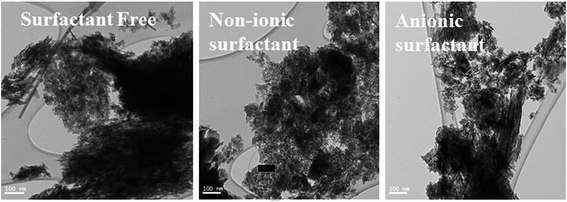 | ||
| Fig. 16 Transmission electron micrographs of synthesized EMD (a) surfactant free, (b) non-ionic surfactant (Triton) and (c) anionic surfactant (STS) added samples. | ||
4.3 Treated EMD
Three major post treatment methods were reported for enhancing the performance of EMD which are mechanical, thermal and chemical treatment.Mechanical treatment involves the influence of mechanical activation of EMD for Zn–MnO2 electrochemical system which leads to an increase in the specific capacity of manganese dioxide by 20–45% (ref. 151) due to partial re-crystallization of inert impurities into an electrically active form. XRD studies141,142 revealed the presence of some hydrated forms of tetravalent manganese, the imperfect crystallinity of the product, as well as existing impurities.
Thermal treatment involves the thermal characterization of EMD by the help of thermogravimetric (TG) and differential thermal analysis (DTA). In this study the EMD sample was heat treated in the temperature range of 20–1000 °C. Lee et al.152 has reported the association of three different types of water molecules with γ-MnO2. Type I water, corresponding to physisorbed molecular water, is removed below 110 °C. Type II water, dissociatively chemisorbed and strongly bound micropore water, is removed below 270 °C. Type III water is present as hydroxyl groups in the interior of the lattice and is removed around 300 °C. This is followed by the weight loss in the temperature ranges between 400–600 °C and 600–900 °C, which may be attributed to the formation of Mn2O3 and Mn3O4, respectively.153–155 The decomposition reactions attributed to the formation of Mn2O3 and Mn3O4 respectively were according to the following equations:
| 2MnO2 → Mn2O3 + 0.5O2 | (21) |
| 3Mn2O3 → 2Mn3O4 + 0.5O2 | (22) |
The amount of water loss from the material is largely determined by the chemical composition and morphology of the material. The investigation lead to a better understanding in this crucial area of battery material preparation and will aid in optimising the heat treatment processes that in turn can improve the overall performance of manganese dioxide as a cathode material in Li/MnO2 primary cells. The thermal behavior of γ-MnO2 (ref. 156 and 157) showed that synthetic γ-MnO2/EMD includes structural domains of ramsdellite and pyrolusite varieties, and that heat-treatment up to 400 °C or elevated temperature lead to the progressive transformation of ramsdellite domains into pyrolusite domain, or with γ-MnO2 (orthorhombic unit cell) to β-MnO2 (tetragonal unit cell). The differential scanning calorimetry (DSC) characterisation of EMD and effect of heat treatment on the morphology, phase and surface area of EMD along with the water loss was discussed by Liu et al.130 and Dose and Donne158 respectively. The electrochemical performance of the HEMD samples showed a retention of the γ-MnO2 structure at various discharge rates and high surface area for the sample heat treated at 250 °C, and extensive structural conversion and micro-pore closure in the case of the 350 °C material that lead to higher capacity and power output.158 Dose et al.48 discussed the post effect of heat treated manganese dioxide when it undergoes reduction in non-aqueous media. The results showed that LiMn2O4 phase was formed due to insertion of lithium ion into the HEMD and as a result, slight increase in the surface area was observed.
Chemical pretreatments were carried out159,160 to the EMD samples prior to testing of their electrochemical behaviour. Ghaemi et al.159 treated the less electrochemically active manganese dioxide with methane subsequent to sulphuric acid digestion to improve its electrochemical activity which was eventually destroyed after discharge cycling process. It was found that with a concentration of 1.5 M acid, digested at 60 °C, the chemically prepared manganese dioxide (CMD) or EMD after the treatment typically showed more stability in cycling and higher discharge capacity. The XRD studies showed formation of γ-MnO2 and β-MnO2 phases after digestion at 60 °C and 98 °C respectively. The effect of pretreatment (including acid treatment, presintering and impregnating with chromic acid salt) of EMD samples on the performance of LiMn2O4 was investigated by Zhao et al.160 The inorganic impurities of the EMD could be removed remarkably with the acid treatment followed by presintering to remove the adsorbed water and organic impurities. Presintering increase the pore sizes and hence the number of active reaction sites. At this stage, impregnation of Cr in EMD formed more homogeneous compound (LiCr0.05Mn1.95O4) that resulted in better structural capacity and capacity retention.
5. EMD and its energy storage applications
Evaluation of electrochemical behaviour of EMD is of utmost importance for its battery and energy storage applications. Electrochemical activity of EMD can be basically assessed by galvanostatic (charge–discharge) and potentiostatic (cyclic voltammetry) techniques. However chronoamperometry and impedance analysis can also be employed in most of the cases along with the above mentioned techniques.For electrochemical testing of EMD, discharge and charge experiments were carried out to evaluate the performance of EMD for battery applications. The theoretical discharge capacity of EMD is 308 mA h g−1 corresponding to its one-electron discharge step. The research efforts have always been aimed towards achieving higher discharge capacities as close as possible to the theoretical value. In the case of EMD aimed for secondary battery applications, then discharging–charging cycling is the primary objective along with improved discharge capacity in each cycle. Further, cyclic-voltammetry study has also been carried out to identify the mechanisms involved during discharge–charge (electron transfer) processes. The following sections will briefly discuss the outcome of various electrochemical studies involved in this material until now. Various factors such as particle size,161 porosity,150 crystal structure, morphology,27,28,30,31,36–38,130,134,137,162 etc. affect the discharge performance and cyclic stability of EMD. It was found that EMD with finer particle size, mesoporous surface, γ-phase with nano structured morphology enhances the discharge capacity and cyclic behaviour. Electrolyte used for charge–discharge study has a significant effect on the discharge performance and cyclic behaviour of the EMD material. Basically two different media (non-aqueous and aqueous) have been discussed for the primary and rechargeable battery system.
5.1 Non-aqueous media
Initially to test the redox behaviour of EMD in lithium non aqueous cells, the EMD material has to be heat treated as it contains large amounts of water. Ohzuku et al.163–165 investigated the electrochemistry of EMD in non aqueous electrolyte. The heat treated EMD samples (250 °C or 400 °C) resulted in the insertion of lithium ion into a solid matrix without destroying the core structure of EMD in the organic electrolyte LiClO4 in propylene carbonate (PC)–tetrahydrofuran (THF) 1![[thin space (1/6-em)]](https://www.rsc.org/images/entities/char_2009.gif) :
:![[thin space (1/6-em)]](https://www.rsc.org/images/entities/char_2009.gif) 1 mixture. The product formed after deep discharge (LixMnO2) was tested by XRD and found that the core structures were unaffected regardless of the HEMDs used. Heat treated mixed EMD (EMD mixed with LiNO3) at 300–500 °C when tested in non aqueous electrolyte such as 1 M LiClO4 or 1 M LiAsF6 in 1,3-dioxolane and 1 M LiAsF6 in 3
1 mixture. The product formed after deep discharge (LixMnO2) was tested by XRD and found that the core structures were unaffected regardless of the HEMDs used. Heat treated mixed EMD (EMD mixed with LiNO3) at 300–500 °C when tested in non aqueous electrolyte such as 1 M LiClO4 or 1 M LiAsF6 in 1,3-dioxolane and 1 M LiAsF6 in 3![[thin space (1/6-em)]](https://www.rsc.org/images/entities/char_2009.gif) :
:![[thin space (1/6-em)]](https://www.rsc.org/images/entities/char_2009.gif) 1 mixture of dimethyl carbonate–ethylene carbonate, resulted in lithium intercalation into the EMD latice.166 Discharge characteristics of EMD with a variety of non aqueous solvents containing lithium salts as electrolyte were also investigated by Kim et al.167 A typical discharge characteristics of the EMD in a lithium battery containing a range of non-aqueous solvents is depicted in Fig. 17. The performance revealed that EMD showed good discharge capacity for LiPF6 electrolyte, however, the difference is marginal between LiPF6 and LiBF4 electrolytes. Where as, the discharge performance was poor with the LiCF3SO3 electrolyte due to its high interfacial resistance. In the non-aqueous lithium cells during discharge, lithium ions are inserted in to the vacant sites while the Mn4+ ions are replaced by Mn3+ ions, which explains the electrochemical behaviour of γ-MnO2 associated with the discharge of Li–MnO2 battery exhibiting high storage capacity of 185 mA h g−1. Due to stringent safety conditions and instability of non-aqueous solvents as electrolyte at higher temperature, research has also been focussed towards environmentally friendly aqueous cells. The electrochemical reaction for non-aqueous lithium cells is generally as follows:
1 mixture of dimethyl carbonate–ethylene carbonate, resulted in lithium intercalation into the EMD latice.166 Discharge characteristics of EMD with a variety of non aqueous solvents containing lithium salts as electrolyte were also investigated by Kim et al.167 A typical discharge characteristics of the EMD in a lithium battery containing a range of non-aqueous solvents is depicted in Fig. 17. The performance revealed that EMD showed good discharge capacity for LiPF6 electrolyte, however, the difference is marginal between LiPF6 and LiBF4 electrolytes. Where as, the discharge performance was poor with the LiCF3SO3 electrolyte due to its high interfacial resistance. In the non-aqueous lithium cells during discharge, lithium ions are inserted in to the vacant sites while the Mn4+ ions are replaced by Mn3+ ions, which explains the electrochemical behaviour of γ-MnO2 associated with the discharge of Li–MnO2 battery exhibiting high storage capacity of 185 mA h g−1. Due to stringent safety conditions and instability of non-aqueous solvents as electrolyte at higher temperature, research has also been focussed towards environmentally friendly aqueous cells. The electrochemical reaction for non-aqueous lithium cells is generally as follows:| MnO2 + Li+ + e− ⇄ LiMnO2 | (23) |
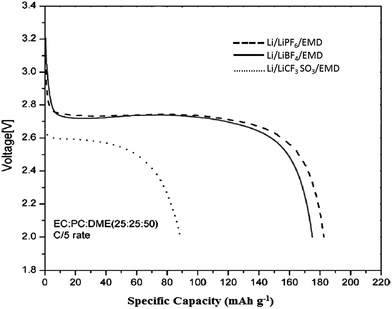 | ||
| Fig. 17 Discharge characteristics of LiMnO2 cells based on EMD as a precursor in a range of non-aqueous electrolytes (reproduced from ref. 167 with the permission of Elsevier). | ||
5.2 Aqueous media
Aqueous media comprised of several different electrolyte systems but in this review we have limited to only hydroxide media.(a) KOH system.
(b) LiOH and NaOH system.
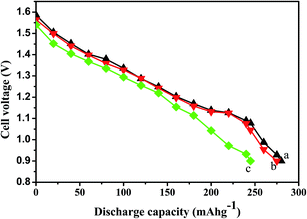 | ||
| Fig. 18 Plots showing the discharge capacities of the EMD samples obtained from (a) EMDMn cake, (b) EMDleach residue, and (c) EMDsynthetic (reproduced from ref. 68 by permission of Springer). | ||
Besides the testing of EMD for primary batteries, various types of doping also carried out to improve the discharge behavior and rechargeability of EMD in KOH electrolyte. On addition of the anatase TiO2 to the EMD cathode3 a 5% improvement in useful service life is typically obtained at high drain rates (3.9 Ω load) and a 4% improvement in useful service life is typically obtained at medium drain rates (10 Ω load). Addition of SnO2 to EMD122 was also helpful in significantly increasing the service life of Zn/MnO2 alkaline batteries using KOH electrolyte. Although KOH electrolyte was limited to primary batteries due to the limitation of only protonation rather than the insertion of potassium ion for rechargeability due to the bigger size of potassium. However, based on the previous reported studies rechargeability of modified EMD can also be possible by using KOH electrolyte4,5,8,9,13,36–38,125,186,187 although it is not completely established. In situ modified EMD film by bismuth ion showed good charge–discharge behaviour in KOH electrolyte.125 The role of included Bi species was to promote the discharge and recharge mechanism of the heterogeneous pathway. Raghuveer and Manthiram9 investigated the rechargeability of EMD in KOH with the addition of 1–5 wt% BaBiO3 and Ba0.6K0.4BiO3. The result revealed that the initial capacity significantly increases by 1 wt% of the additive without affecting much to the cyclability, however on addition of 2 or 5 wt% BaBiO3 or Ba0.6K0.4BiO3 improves the capacity retention significantly than that of the undoped EMD. Later on investigations were also carried out in KOH electrolyte with Ag3BiOx modified EMD,8 TiB2, TiS2 doped EMD,4 TiB2 and Bi2O3 modified EMD,5 NaBiO3 doped EMD,10 and BaSO4 modified EMD cathodes used for RAM batteries.186 The results revealed that the discharge capacity as well as rechargeability have improved considerably in the one electron regime compared to that of the undoped EMD. The discharge–charge cycle of Zn–MnO2 alkaline cell containing KOH electrolyte showed that the redox mechanism involves a K+ ion insertion/surface film formation on the host framework structure of the positive electrode material, MnO2 (as reported by several researchers) and this process is not fully reversible. Wang et al.13 was able to achieve a discharge capacity of 481 mA h g−1 with good cycle life upto 115 cycles in KOH electrolyte. We have reported the discharge capacity and cycle behaviour of surfactant modified EMD in KOH electrolyte. EMD modified with cationic surfactants36 non-ionic surfactants37 and with anionic surfactants38 showed stable cyclic behaviour after few initial cycles (10 cycle onwards). However the potassium intercalation behaviour was observed for the EMD modified by non-ionic surfactant TX-100 via KOH electrolyte.37 EMD deposited in presence of tetraethyl ammonium bromide showed the best initial discharge capacity of 298 mA h g−1 in compared to the EMD when deposited from a surfactant free bath having 240 mA h g−1 discharge capacity.36
Lithium, due to its small size was able to take part in the intercalation into the EMD surface, making it a rechargeable one. However a clear picture of LiOH electrolyte for Zn/MnO2 batteries (using EMD cathode) came into focus by the work of Minakshi et al.191,192 The authors reported that battery with aqueous LiOH electrolyte showed superior behaviour over traditional battery that uses aqueous KOH due to lithium intercalation into manganese dioxide (γ-MnO2) during the discharge phase of the battery. Further, they reported that chemically prepared battery grade manganese dioxide had a higher open circuit voltage (OCV) and gets discharged at higher voltages as compared to EMD. Although both materials produced lithium intercalated manganese dioxide (LixMnO2) phase during discharge, EMD showed more stability to discharge–charge cycling than the chemical grade. However with the help of cyclic voltammetry it was confirmed that the reduction of MnO2 in LiOH is reversible which differs from the mechanism of reduction/oxidation of the same material in aqueous KOH electrolyte. The difference in the mechanism through which reduction/oxidation of MnO2 occurs can be explained in terms of the relative ionic sizes of Li+ and K+ ions. The Li+ ions being comparable in size to Mn4+ could be intercalated into the octahedral structure of γ-MnO2.143 Lithium-proton exchange can take place in EMD with aqueous media leading to complete replacement of surface and vacancy protons by lithium without affecting groutite (Mn3+) protons substantially, which makes the lithiated EMD a useful cathode material in lithium batteries due to its high working voltage.193 As lithium in the MnO2 lattice stabilizes the ramsdellite structure at higher temperatures, LiMn4O8 can be used as an interesting rechargeable cathode material for lithium batteries with a capacity around 210 mA h g−1 and a working voltage of about 2.9 V. Further investigations stated that the presence of small amounts (1, 3 and 5 wt%) of titanium disulphide (TiS2)6 or titanium diboride (TiB2)7 or bismuth oxide additive11,12 or cerium dioxide (CeO2)18 or alkaline-earth oxide additives such as barium oxide (BaO), calcium oxide (CaO), or magnesium oxide (MgO)17 in EMD cathode versus Zn anode using aqueous lithium hydroxide electrolyte showed enhanced electrochemical behavior having intercalation kinetics. Presence of TiS2 (3 wt%) in the MnO2 cathode improved the discharge capacity from 150 to 270 mA h g−1 and presence of TiB2 (≤3 wt%) improved the discharge capacity from 150 to 220 mA h g−1 with good cycle life stability. The incorporation of bismuth into MnO2 in the LiOH cell at pH 12 was found to result in significantly longer cycle life, compared with cells using undoped MnO2. Bismuth oxide was added in 3, 6 and 10 wt% to the physically admixture of the EMD cathode. The Bi-doped (6 wt%) sample showed significant improvement in the discharge behaviour while retaining the discharge capacity over 100 cycles compared with the undoped material. The undoped cell had a discharge capacity of just 70 mA h g−1 at the 40th cycle reflecting a loss of 55% in efficiency, whereas, the Bi-doped sample had a capacity of 130 mA h g−1 at the 50th cycle and 105 mA h g−1 at the 100th cycle corresponding to a capacity retention of 70%. But the Bi-doped (10 wt%) cathode showed a limited discharge capacity of 150 mA h g−1.11 However further changing the pH of the electrolyte from 12 to 10.5,12 10 wt% Bi doped EMD could be able to retain more than 80% of its initial capacity after 10 cycles with simultaneous increase in its initial discharge capacity from 150–215 mA h g−1. The discharge capacity of EMD has been greatly improved from 155 to 190 mA h g−1 on addition of CeO2, from the second discharge cycle onwards with the reduction of the capacity fade upon subsequent cycling. Among the alkaline earth oxides, BaO or MgO17 additives found to result in significantly higher discharge capacity and longer cycle life, compared with the battery using CaO additive or undoped MnO2. The role of these additives in the MnO2 cathode is found not to suppress the formation of non-rechargeable products, but rather to reduce the access of Zn ions to the MnO2 resulting in the formation of hetaerolite like products.194 Minakshi et al.195 also investigated the intercalation mechanism of the zinc–manganese dioxide (Zn–MnO2) electrochemical cell in two different electrolytes (LiOH and KOH) and found that only LiOH showed intercalation behaviour and hence it could be the most suitable electrolyte for alkaline rechargeable battery applications. Later, Minakshi196 also investigated the rechargeability of EMD using Sn anode in aq. LiOH electrolyte. Sn–MnO2 aqueous rechargeable battery showed a discharge capacity of 110 mA h g−1, and was increased to 150 mA h g−1 on addition of 1 wt% of MgO. Sn–MnO2 battery retains about 87% rechargeability in comparison with Zn–MnO2 battery retaining 50% of the rechargeability after the 50th cycle. EMD modified with the surfactant namely Brij 56 showed high discharge capacity of 320 mA h g−1 in comparison to surfactant free EMD with a reversible discharge capacity of 218 mA h g−1 at a discharge rate of C/6 (ref. 197) in LiOH electrolyte.
Attempts have also been made using NaOH electrolyte to study charge–discharge behaviour of EMD.198,199 The MnO2 cathode using NaOH electrolyte was found to be safe, efficient on short-term purposes and cost effective with a reversible capacity of 220 mA h g−1. The reported aqueous battery is found to be reversible during the one electron reduction and with the increase in degree of reduction.
Apart from the KOH, LiOH, and NaOH electrolytes several investigations have also been carried out by using ZnSO4 as the electrolyte,200–202 Li2SO4 electrolyte203,204 or Na2SO4 electrolyte.131,204 Promising results were found when using zinc sulphate as the electrolyte for the charge–discharge study of Zn/MnO2 cell, and reported that this cell can be rechargeable upto 20–30 cycles. The charge–discharge products are characterised by XRD and found that the γ-phase was recovered by charging. The key electrochemical process involved in the Li2SO4 containing cell appears to be proton insertion, being similar to the well known alkaline manganese cell using KOH as an electrolyte.203 MnO2 nanowire array thin films deposited on Ti/Si substrate showed excellent behaviour in 0.5 M Na2SO4 aqueous electrolyte for electrochemical capacitor131 which is detailed in the Section 5.4.
The charge–discharge behaviour of Zn–MnO2 cell in different electrolyte such as KOH, NaOH and LiOH was compared in Fig. 19. It was clearly observed from the behavior that the discharge curves for the cell containing different electrolytes KOH, NaOH and LiOH behave differently from each other with different discharge capacities of 330, 225 and 148 mA h g−1 respectively for KOH, NaOH and LiOH electrolyte with a cut-off voltage of 1 V for all the cells.187,195,196 The discharge voltage for the LiOH containing cell was higher, with a mid-potential of 1.6 V. For the KOH containing cell, the shape of the discharge curve is characterized by an initial drop in voltage (from 1.55 to 1.45 V) followed by a reasonably constant voltage (1.4 V) regime, which finally underwent a sharp fall to 1.0 V, quite similar to NaOH also. The cell voltages for NaOH and KOH were about 0.2 V below as compared to LiOH cell, however, the decrease in cell potential during discharge was slower comprising 36% excess of energy storage in case of NaOH. The observed lower voltage for NaOH cell is due to the cathodic effect, the energy gained from inserting Na into a host MnO2 structure was lower than that for inserting Li from LiOH cell. An important observation in case of KOH cell was that, KOH cell has the utilization of the active material to 100% of the 1 electron capacity and over 15% of the 2 electron reduction capacity, leading overall to 330 mA h g−1 in comparison to that of NaOH cell which has 73% of the active material utilization of the 1 electron capacity. The LiOH cell had a low utilization of the active material (MnO2), of just over 50% of the theoretical 1 electron capacity.
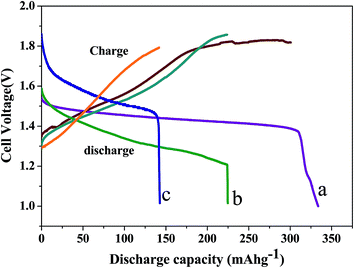 | ||
| Fig. 19 Typical initial discharge-charge behavior of MnO2 cathode in: (a) KOH, (b) NaOH and (c) LiOH electrolyte (replotted using the data from ref. 187, 195 and 198). | ||
This could be limited by the Zn anode or may be attributed to some different mechanism.28 The reason explained by Ong et al.205 is the fact that Na tend to form weaker bonds with O than Li and would depend strongly on the local environment in the MnO2 crystal. However, the weaker Na–O bonding206 had a lower diffusion barrier for Na+ to intercalate in MnO2 than the Li+ in the LiOH cell and hence the higher capacity.
Minakshi and Mitchell,202 investigated the redox behaviour of EMD in Li2SO4 and compared with LiOH. Fig. 20 showed that the discharge curve for the cell with Li2SO4 is quite different from that of the LiOH cell with different voltage profiles. Despite the close similarities in the OCV of 1.75 and 1.83 V for Li2SO4 and LiOH cells respectively, the two cells deviate from the outset of the discharge process. The decrease in cell potential was higher when Li2SO4 was the electrolyte. Below 1.3 V, the drop in potential was not smooth which indicates that the Mn4+/2+ transitions are impeded may be due to hydrogen evolution.207 The flat discharge voltage region at about 1.5 V corresponds to the Mn4+/3+ redox reactions,6 and this was not observed in the Li2SO4-containing cell. On recharging, the process is reversible for the LiOH containing cell with a coulombic efficiency of 92%. The Li2SO4 containing cell was unable to be recharged. The reason behind to the difference in behavior was clearly explained by Minakshi et al.191 It was due the formation of lithium carbonate (Li2CO3) in the LiOH containing cell in the presence of atmospheric CO2. This layer coats the MnO2 particles and may act as a barrier for protons while permitting lithium ion insertion in LiOH electrolyte forming lithium intercalated MnO2. The carbonate layer does not form in the Li2SO4 electrolyte, so protons diffuse into MnO2 with a low voltage profile while forming a non-rechargeable product of manganese-oxy-hydroxides. However Bi doped MnO2 was able to overcome this disability.
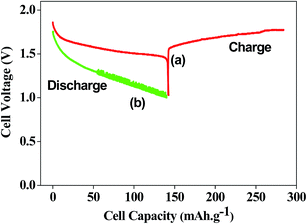 | ||
| Fig. 20 Typical first discharge–charge behavior of MnO2 cathode in (a) saturated LiOH and (b) 1 M Li2SO4 electrolyte (replotted using the data from ref. 203). | ||
To give a clear picture of the redox behavior Zn/MnO2 cell in different electrolyte from the point of cyclic voltammetry (CV), we have redrawn some of our CV plots (previous work). Fig. 21–23 showed the individual cyclic voltammograms of EMD in cells containing KOH, LiOH and NaOH electrolytes whereas Fig. 24 and 25 showed the graphs that are compared between KOH and LiOH, NaOH and LiOH respectively. As can be seen in all the figures the cyclic voltammetry (CV) profile consists of one reduction peak (C1) and its corresponding oxidation peak (A1). Similar to the galvanostatic charge–discharge behavior discussed earlier in this section, the CVs of MnO2 in different electrolytes are quite different. In the presence of the LiOH electrolyte the reduction peak is at −475 mV, and the reduction peak in the cell with the KOH electrolyte occurs at −585 mV. The corresponding anodic peak for the LiOH electrolyte is at −150 mV and for the KOH electrolyte is at −135 mV. The difference seen in the anodic potential for KOH electrolyte can be explained in terms of the oxidation of Mn3O4 to a variety of Mn3+ intermediates like γ-Mn2O3, γ-MnOOH, and β-MnOOH. The potential difference between C1 and A1 is also quite large for the KOH electrolyte (ΔEP = 450 mV), suggesting that the reaction is not reversible, while that for the LiOH electrolyte (ΔEP = 325 mV) is much lower. The ratio of the area under peaks C1 and A1 for LiOH is 0.70, suggesting that the redox reaction is 70% reversible. The behavior of MnO2 in aqueous NaOH can be compared to that in aqueous LiOH electrolyte under all identical conditions except with reference electrode Hg/HgO. The CV's of MnO2 in the two electrolytes are quite different (Fig. 25), reduction peaks (C1) in NaOH and LiOH observed at −390 mV and at −285 mV respectively. However during oxidation, no significant difference was observed in anodic potential for those two electrolytes, The reason has been explained earlier6,11 was that the cathodic peak for LiOH was assigned to lithium-intercalated MnO2 phase in addition to a variety of Mn3+ intermediates (MnOOH, Mn2O3 or Mn3O4) were formed through proton insertion11 and the corresponding anodic peak was the reverse of this reaction to a formation of MnO2 phase. A small shoulder (A2) at 29 mV seen for LiOH electrolyte is assigned to δ-MnOOH phase suggesting that the process is not completely reversible. For NaOH electrolyte, reversible sodium insertion and extraction can be possible. During reduction, a peak shift of around 105 mV was observed at more negative potential implying the bigger size of sodium ions are difficult to intercalate208 than extracting from the host MnO2 as the oxidation peaks have occurred at quite similar regions for both the electrolytes with a difference of only 14 mV. During the reverse anodic sweep oxidation peak A1 at −55 mV was observed for NaOH indicating that the process is reversible. Small shoulders at around 20 and 120 mV are also seen but they are not well-defined as observed for Li counterpart. This implies δ-MnOOH and other Mn3+ non-rechargeable products that are not readily formed, promote the NaOH cell to have enhanced electrochemical behavior.
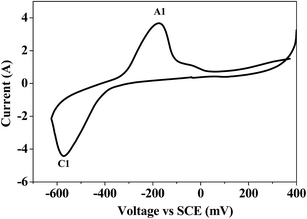 | ||
| Fig. 21 Cyclic voltammogram (CV) of MnO2 in saturated aqueous solution of KOH electrolyte (scan rate: 25 μV s−1, voltage limit: 400 to −600 mV and back) (replotted using the data from ref. 195). | ||
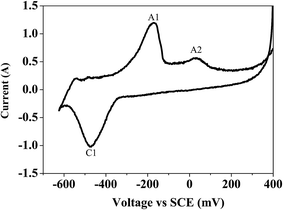 | ||
| Fig. 22 Cyclic voltammogram (CV) of MnO2 in saturated aqueous solution of LiOH electrolyte (scan rate: 25 μV s−1, voltage limit: 400 to −600 mV and back) (replotted using the data from ref. 195). | ||
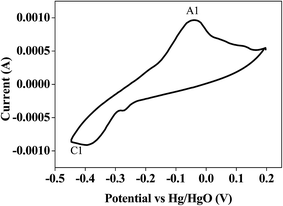 | ||
| Fig. 23 Cyclic voltammogram of MnO2 electrode using aqueous 7 M NaOH (scan rate: 25 μV s−1; potential limit: 0.2 to −0.45 V and back) (replotted using the data from ref. 198). | ||
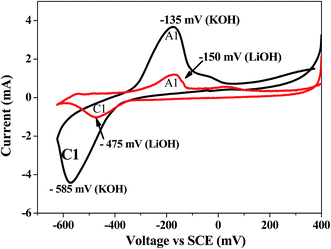 | ||
| Fig. 24 Cyclic voltammogram (CV) of MnO2 in saturated aqueous solution of KOH or LiOH electrolyte for the potential scanned at 25 μV s−1 from 400 to −600 mV and back (replotted using the data from ref. 195). | ||
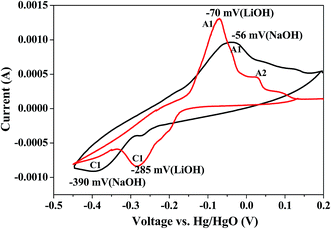 | ||
| Fig. 25 Typical cyclic voltammogram (CV) behavior of MnO2 cathode in saturated LiOH electrolyte and NaOH electrolyte at a scan rate of 5 mV s−1 (replotted using the data from ref. 197). | ||
The effect of replacing alkali cations in the aqueous electrolyte KOH with LiOH and then NaOH in the Zn/EMD cell has been determined by carrying out discharge cycles on three identical cells, using three different electrolytes, one with 5 M KOH (named KOH cell), 5 M LiOH (named LiOH cell) and the other 5 M NaOH (named NaOH cell), under identical conditions. The results for the cycling stability for all the cells are shown in Fig. 26. The discharge capacity and the energy retention for the cell with NaOH are apparently higher than the LiOH and KOH counterparts. The cycling performance for KOH cell, rapid loss in initial capacity, is quite different from that of the LiOH and NaOH cell, could be due to the proton and larger K+ ion insertion that led to highly irreversible. The discharge capacity of the MnO2 cathode for the NaOH cell was 225 mA h g−1 (300 W h kg−1) compared to 150 mA h g−1 (210 W h kg−1) for the LiOH cell, 200 mA h g−1 (220 W h kg−1) for the KOH cell using a 1 V cut-off voltage. Most of the work relating alkaline rechargeable batteries reported in the literature4,5,14,15,42 are based on proton insertion. It had been referred that alkaline potassium hydroxide electrolyte is not part of the reaction and only the cathode (EMD) and anode (metallic zinc) are consumed during discharge process. In contrary to this, we found potassium ions (K+) from the electrolyte are consumed through intercalation process in addition to protons (H+).187 TEM images in Fig. 27(a) and (b) show the contrast in discharged EMD in KOH electrolyte and the points marked in those regions refers to Mn and K indicating the presence of K in MnO2. A very similar morphology is observed for charged EMD electrode as well, suggesting that K+ ions are not reverted back, hence a quick decline in discharge capacity is seen for KOH in Fig. 26. The available capacity for KOH cell after 25 cycles is merely 40 mA h g−1. This makes the KOH cell as highly non-rechargeable, while the Li and Na from LiOH and NaOH electrolytes intercalate the right size of their cations which is comparable to that of Mn4+ in MnO2 and this process is reversible. Hence, the LiOH and NaOH cells can be termed as “aqueous rechargeable batteries”.
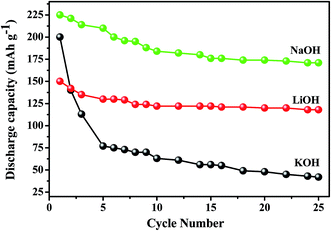 | ||
| Fig. 26 Typical cyclic behavior of MnO2 cathode in KOH, LiOH electrolyte and NaOH electrolyte (replotted using the data from ref. 197). | ||
5.3 Plausible electrochemical reactions of EMD in aqueous cells
The electrochemical reaction for aqueous cells were discussed below. The discharge reactions in rechargeable alkaline MnO2/Zn cells are mostly the same as in the primary cell.42 The cell reactions can be simplified as:| (i) At cathode: 2MnO2 + H2O + 2e− → Mn2O3 + 2OH− | (24) |
| (ii) At anode: Zn + 2OH− → ZnO + H2O + 2e− | (25) |
| (iii) Overall: Zn + 2MnO2 → ZnO + Mn2O3 | (26) |
The basic difference of a primary cell than that of the rechargeable (secondary) cell is only the first electron of the manganese dioxide is allowed to be discharged. The discharge of the second electron leads to formation of soluble Mn(II) species. The first electron discharge proceeds via the homogeneous proton-insertion path and tetravalent manganese dioxide is formally reduced to MnO1.5 i.e.:
| MnO2 + H2O + e− → MnOOH + OH− | (27) |
The reactions involved during the charge–discharge study of EMD in alkaline electrolyte are discussed earlier in Section 5.1. However the details of redox reaction observed from cyclic voltammetry study are explained as follows.
There are usually two or three cathodic peaks observed in the discharging process. These are:
| (A) Step 1: MnO2 + H2O + e− → MnOOH + OH− | (28) |
| Step 2: MnOOH + H2O + e− → Mn(OH)2 + OH− | (29) |
Step 1 is a one-electron homogeneous reduction in solid phase and step 2 is a one-electron reduction resulting in a differently structured Mn(OH)2.
| (B) Step 1: MnO2 + H2O + e− → MnOOH + OH− | (30) |
| (C) Step 2: MnO2 + 2H2O + 2OH− + e− → [Mn(OH)6]3− | (31) |
| (D) Step 3: [Mn(OH)6]3− + e− → Mn(OH)2 + 4OH− | (32) |
Step 1 of path B is identical to that of reaction path A. After a certain depth of discharge (DOD), in step 2, a heterogeneous one-electron reduction yields a soluble Mn(III)-hydroxocomplex. Finally in step 3, this complex is reduced to Mn(II) and Mn(OH)2 is precipitated. About 30% reduction of γ-MnO2 occurs in step 1 and only this reaction remains chemically reversible. For the doped samples, there is an enhancement of reaction path B in the sequence of discharge reactions. So, titanium doping of EMD enhances cycle life performance of the alkaline manganese dioxide cell. Again, the performance of the doped material seems to be dependent upon the nature of the dopant.4 Wenjian et al.8 carried out cyclic voltammetry studies and found that the doped MnO2 electrode had two reduction peaks, greater than that of pure MnO2 electrode. This indicated that Ag3BiOx-EMD electrode had much higher electrochemical activity than undoped EMD electrode. According to Binder et al.20 the presence of Ti4+ affected the electrode by changing the discharge mechanism. It seems that the presence of Ti4+ ions inhibited the homogeneous reduction and favored the heterogeneous path. The influence of metal ions such as ferrous ion209 on the anodic deposition of EMD or doping of Cu2+ and Co2+ into MnO2 using cyclic voltammetry210 was also reported. The presence of ferrous ion did not affect the EMD preparation significantly. Similarly, presence of various dopants was beneficial as the EMD storage capability was improved in presence of these ions. Prasad and Miura162 deposited nanostructured and amorphous EMD in an electrolyte medium of 0.5 M H2SO4 along with 0.5 M MnSO4·5H2O potentiodynamically with different scan rates (50 and 200 mV s−1). The nano EMD samples deposited on stainless steel electrodes were characterized by cyclic voltammetry (CV) in 0.1 M Na2SO4. Specific capacitance (SC) as high as 482 F g−1 was obtained with EMD deposited at a higher scan rate of 200 mV s−1. The observation showed that SC of EMD increased by increasing the scan rate of deposition indicating higher power characteristics of the material. The studies also demonstrated the long cycle-life and stability of nano EMD.
Discharge capacities of EMD samples obtained under different experimental conditions are given in Table 1.
| Sample (electrolyte used) | Discharge capacity (mA h g−1) | Reference(s) |
|---|---|---|
| a NB: EMDMC: EMD produced from manganese cake; EMDLR: EMD produced from manganese leach residue. | ||
| EMD (theoretical) | 308 | |
| EMD (LiOH) | 162 | 91 |
| Commercial BGM | 165 | 188 |
| Composite dimensional manganese oxide (CDMO) | 200 | |
| Lithiated EMD (LiMnO4) | 210 | 189 |
| Ag3BiOx-EMD | 135 (10 cycles) | 8 |
| NaBiO3-EMD (KOH) | 180 (10 cycles) | 10 |
| TiB2-EMD (KOH) | ∼175 | 4 |
| TiS2-EMD (KOH) | ∼200 | 5 |
| Brij 56-EMD (LiOH) | 218 (surfactant free) | 196 |
| 320 (in presence of surfactant) | ||
| LiMn4O8 from EMD | 210 | 193 |
| TiS2-EMD (LiOH) | 150 to 270 | 6 |
| TiB2-EMD (LiOH) | 150 to 220 | 7 |
| Bi2O3 doped EMD (LiOH) | 130 (at 50th cycle) | 11 |
| 105 (at 100th cycle) | ||
| EMD nano wire | 150 in multiple cycles | 137 |
| Undoped EMD | 140 | 12 |
| Bi2O3-EMD (LiOH) | 215 | |
| CeO2-EMD (LiOH) | 155 to 190 (in the 2nd cycle) | 18 and 19 |
| EMD unmodified | 110 | 195 |
| EMD modified with 1% MgO (LiOH electrolyte vs. Sn anode) | 150 | |
| EMD (KOH) | 330 | 195 |
| EMD (NaOH) | 225 | 198 |
| EMD (LiOH) | 148 | 187 |
| Composite dimensional manganese oxide, CDMO | 200 | 118 and 188 |
| CeO2-EMD (LiOH) | 155 to 190 (from 2nd cycle) | 17 |
| Ag4Bi2O5-EMD | 481 | 13 |
| EMD | 240 (gradual loss in discharge capacity within 6–8th cycles) | 36 |
| TEAB-EMD | 298 | |
| TPAB-EMD | 278 | |
| TBAB-EMD (KOH) | 275 | |
| Stable cycle behavior from 10th cycle onwards | ||
| TX-100-EMDMC (KOH) | 275 | 37 |
| Stable cycle behavior from 10th cycle onwards | ||
| EMDLR | 267 (cycle capacity upto 12th cycles only) | 38 |
| SOS-EMDLR | 275 | |
| SDS-EMDLR | 265 | |
| STS-EMDLR (KOH) | 262 | |
| Stable cycle behavior from 10th cycle onwards for modified EMD | ||
5.4 EMD for aqueous electrochemical capacitors
Supercapacitors are another form of important electrochemical energy conversion and storage devices. It has attracted more attention because of its advantages such as fast charging and discharging, long life span, simple principle and high power density compared with rechargeable batteries and traditional dielectric capacitors. Electrochemical capacitors, also called supercapacitors, store energy using either ion adsorption (electrochemical double layer capacitors) or fast surface redox reactions (pseudo-capacitors). It is very well known that EMD is one of the most suitable material for electrochemical capacitor/supercapacitor applications. Various research work have been carried out to study the role of modified and unmodified MnO2 based capacitor for energy storage application. However considering the aim of this review, only EMD based capacitors have been highlighted here.Chou et al.44 potentiostatically electrodeposited γ-MnO2 (EMD) film showing a specific capacitance of 240 F g−1 at the current density of 1 mA cm−2. The process involved EMD coated nickel sheet as working electrode with high surface carbon rod as counter electrode vs. saturated calomel electrode (SCE) as reference electrode in 0.1 M Na2SO4 electrolyte. In another study, heat treated thin film of MnO2 nanowire array showed ideal capacitive behaviour with specific capacitance up to 254 F g−1 in 0.5 M Na2SO4 electrolyte suggesting a potential use of this material for electrochemical capacitor.131 Successively, Chou et al.133 reported that MnO2 nanowire/CNT composite paper (MNCCP) produced by potentiostatic technique exhibiting high specific capacitance of 167 F g−1 at a current density of 77 mA g−1 and was able to retain about 88% of initial capacitance even after 3000 cycles. The system comprised of MNCCP as the working electrode with a Pt foil as the counter electrode and SCE as reference electrode in 0.1 M Na2SO4 solution. The enhanced electrochemical performance of the composite electrode was due to the highly conductive, flexible CNT paper substrate for capacitor electrode, and the nanowire morphology of MnO2, which enable the contact of the electrolyte with the active materials. Needle structured α-MnO2 (derived from EMD) deposited on conductive carbon fibre (CF) showed good capacitive behaviour with specific capacitance of 432 and 305 F g−1 at current densities of 5 and 40 A g−1 respectively in 1 M Na2SO4 aqueous electrolyte. It is explained that the carbon fibres offered more electronic conductive paths for fast electron conduction. Thin films of manganese dioxide showed significantly higher capacitance of about 2000 F g−1 in 0.5 M Na2SO4 electrolyte at a scan rate of 5 mV s−1.84 From the above investigations it is clear that Na2SO4 was used as the suitable electrolyte for capacitance measurement. However apart from sodium sulphate, potassium chloride and lithium sulphate were also used for capacitance measurement. Xiao et al.138 investigated the capacitive behaviour of EMDs deposited by galvanostatic and pulse current techniques. MnO2 deposited by galvanostatic method showed a capacitance of 160 F g−1 while by pulse current exhibited 252 F g−1 in 3 M KCl electrolyte at the scanning rate of 10 mV s−1. The interesting fact of their study was the capacity retention, 31% and 56% for EMD deposited by galvanostatic and pulse current method respectively. Jafta et al.211,212 investigated the capacitive behaviour of two different nanocomposites of α-MnO2 (derived from EMD) which are surfactant (SDS) modified, one with multiwalled carbon nanotubes (MWCNT)211 and other with graphene oxide (GO)212 respectively, as the low-cost asymmetric electrochemical capacitors. α-MnO2/MWCNT showed specific capacitance of 170 F g−1 while α-MnO2/GO nanocomposite exhibited 280 F g−1 both tested at a current density of 0.5 A g−1 in 1 M Li2SO4 electrolyte.
Consequently, we have tested EMD material in 2 M NaOH solution. A typical charge–discharge characteristic of the EMD positive electrode in aqueous capacitor is depicted in Fig. 28. The EMD (single) electrode is cycled between the voltage limits of −0.4 to 0.45 (vs. Hg/HgO) at a current density of 0.5 A g−1 to evaluate the properties of aqueous capacitor. As shown in Fig. 28(a), it can be observed that there are two voltage plateaus around +0.4 and −0.3 regions during charge and discharge processes. The specific capacitance of the Bi doped EMD showed 350 F g−1 while the undoped EMD showed a low capacitance of 275 F g−1 at the current density of 0.5 mA cm−2. The specific capacitance of the hybrid cell comprising EMD vs. activated carbon (Fig. 28(b)) cycled between 0.2 and 1.6 V showed a very good reversibility. It is clearly seen that Bi doped EMD exhibits higher capacitance through longer charge and discharge time.
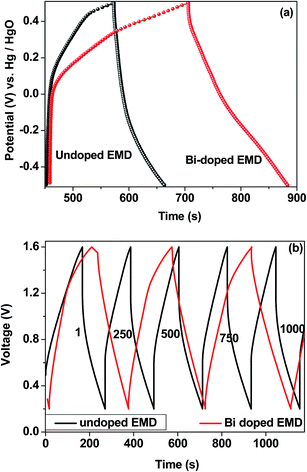 | ||
| Fig. 28 Galvanostatic charge–discharge curves of (a) single (EMD) electrode and (b) EMD vs. activated carbon hybrid aqueous asymmetric capacitor. Cycle numbers are indicated in the (b). | ||
6. EMD as efficient catalyst for OER
Electrolysis may not be the most effective approach to acquire hydrogen, yet it is one of the least demanding and inexpensive approaches to “homebrew” hydrogen and suitable for large scale production. As a fuel, hydrogen generates electricity and environmental friendly H2O as by-product. Thus, hydrogen could address both energy and fresh water supply issues. The overall reaction for water electrolysis can be separated into hydrogen and oxygen evolution reactions. The oxygen evolution reaction (OER) mechanism primarily depends on the catalyst material used, its electrostatic potential and the electrolyte involved. The rutile-types oxides of ruthenium oxide (RuO2) and iridium oxide (IrO2) show the lowest OER overpotential, however these non-platinum system (oxides) suffer from poor chemical stability in alkaline media. Other metal oxides such as PbO2, Co3O4, NiCo2O4 have also been developed and reported. Among all these materials reported, modified EMD-catalysts have been found to improve the catalytic activity for oxygen reduction. The geometric and electronic factors of the starting “electrolytic manganese dioxide (EMD) material” are modified by Dario et al.213 to enhance its electrochemical activity, in particular to overpotential and Tafel slope, towards the oxygen evolution reaction. The obtained values are depicted in Fig. 29 and found to be comparable to the commercially available dimensionally stable anode (DSA). This has been achieved while using different dopants (such as Mo, W, V or Co separately) as additives during electrodeposition of MnO2. These results conclude that with enhanced active surface area and lower water content in the EMD has excellent electro catalytic activity and good stability for OER and may be of great potential in electrochemical water splitting.7. Future outlook
Despite enormous scientific efforts to produce high quality pure EMD214 for rechargeable batteries and high capacitance electrochemical capacitors along with the search of synthetic techniques, adding surfactants in the electrolytic cell during electrodeposition, including additives as dopants but still the long-term cyclability of EMD is a challenge due to various unsolved snags until now, which must be addressed in the coming future in order to corroborate the commercially viable, eco-friendly material EMD. Apart from the modification of the EMD material, future research may also focus on the issues like suitability of the anode, conductivity issues related with EMD, enhancing rechargeability and lower energy density problems in rechargeable alkaline batteries and supercapacitors. A few on-going research works in lithiated EMD give a new perception for this material. For an instance, engineers at the university of Illinois have able to build a prototype EMD battery that can be rechargeable up to 90% within two minutes with future challenge of developing batteries for electric vehicles that can withstand such high current rate. Similar to this, manganese based battery produced by Stanford researchers that capitalizes on the difference in salinity between fresh and salt water to generate electricity has future challenge of replacing the currently used expensive silver anodes. Therefore, demand for these batteries is driving upwards as there is more potential of this material to be used in electric vehicles. These technologies not only have the potential to further drive the manganese demand, but also change the way we live. This is revolutionizing the manganese oxide sector and creating investment opportunities in this area.215 Most importantly these technologies will create more drive for the researchers and scientists to explore new and sustainable secondary manganese sources for future energy storage and conversion.8. Concluding remarks
We have summarized the current review regarding the relatively well known electrolytic manganese dioxide (EMD) material but with current updates on worldwide research and explored their applications in energy storage system. The literature can be concluded as:The current review focussed on recent work done on the modification of EMD while adding various metal ions, additives and surfactants through ex situ and in situ doping and examined its suitability towards various energy storage applications. Efforts made to synthesize EMD from ores and secondary sources have also discussed.
A comparative discussion has been provided in this review which clearly debated the behaviour of EMD in non-aqueous and aqueous solvents, and also differentiates electrochemical activity of EMD with respect to different aqueous solvents such as KOH, LiOH and NaOH. Although high reversibility is a matter of concern for electrolytic manganese dioxide, however, by opting the suitable synthetic techniques, doping, and/or altering the solvent used for its electrochemical activity, improved performance could be achieved. Due to this, commercially viable material EMD is a matter of great importance since few decades and also will be a matter of interest for the future research. In the course of diminishing of fossil fuels and climate change, the process for the preparation of EMD from various low grade ores and secondaries will open a new horizon for the effective utilization of the wastes for the production of novel energy materials. The current perspective will provide a pathway for the energy researchers to increase the R&D activities that may result in high production of EMD.
Acknowledgements
This research was supported under ARC's Discovery Projects funding scheme (DP1092543). The views expressed herein are those of the authors and are not necessarily those of the Australian Research Council. This research used equipment funded by the Australian Research Council (ARC) – Linkage, Infrastructure, Equipment and Facilities (LIEF) grant LE120100104 located at the UoW Electron Microscopy Centre. One of the authors (AB) acknowledges ministry of earth science (MOES), India.References
- http://www.worldwatch.org/fossil-fuels-dominate-primary-energy-consumption-1, accessed on 25 June, 2015.
- U. Kohler, C. Antonius and P. Bauerlein, J. Power Sources, 2004, 127, 45 CrossRef CAS PubMed
.
- J. E. Mieczkowzka and P. S. Markfort, US Pat. 5,342,712, 1993
.
- V. Raghuveer and A. Manthiram, J. Power Sources, 2006, 159, 1468 CrossRef CAS PubMed
.
- V. Raghuveer and A. Manthiram, J. Power Sources, 2006, 163, 598 CrossRef CAS PubMed
.
- M. Minakshi, P. Singh, D. R. G. Mitchell, T. B. Issa and K. Prince, Electrochim. Acta, 2007, 52, 7007 CrossRef CAS PubMed
.
- M. Minakshi, D. R. G. Mitchell and K. Prince, Solid State Ionics, 2008, 179, 355 CrossRef CAS PubMed
.
- Y. Wenjian, L. Juan and Z. Xiaogang, Int. J. Electrochem. Sci., 2006, 1, 181 Search PubMed
.
- V. Raghuveer and A. Manthiram, Electrochem. Commun., 2005, 7, 1329 CrossRef CAS PubMed
.
- J. Pan, Y. Sun, P. Wan, Z. Wang and X. Liu, Electrochim. Acta, 2006, 51, 3118 CrossRef CAS PubMed
.
- M. Minakshi and D. R. G. Mitchell, Electrochim. Acta, 2008, 53, 6323 CrossRef CAS PubMed
.
- M. Minakshi, J. Solid State Electrochem., 2009, 13, 1209 CrossRef CAS
.
- Q. Wang, J. Pan, Y. Sun and Z. Wang, J. Power Sources, 2012, 199, 355 CrossRef CAS PubMed
.
- Y. F. Yao, N. Gupta and H. S. Wroblowa, J. Electroanal. Chem., 1987, 223, 107 CrossRef CAS
.
- H. S. Wroblowa and N. Gupta, J. Electroanal. Chem., 1987, 238, 98 CrossRef
.
- M. A. Dzieciuch, N. Gupta and H. S. Wroblowa, J. Electrochem. Soc., 1988, 135, 2415 CrossRef CAS PubMed
.
- M. Minakshi, Ind. Eng. Chem. Res., 2011, 50, 8792 CrossRef CAS
.
- M. Minakshi, D. R. G. Mitchell, M. L. Carter, D. Appadoo and K. Nallathamby, Electrochim. Acta, 2009, 54, 3244 CrossRef CAS PubMed
.
- M. Minakshi, K. Nallathamby and D. R. G. Mitchell, J. Alloys Compd., 2009, 479, 87 CrossRef CAS PubMed
.
- L. Binder, W. Jantscher, F. Hofer and G. Kothleitner, J. Power Sources, 1998, 70, 1 CrossRef CAS
.
- Z. Zhou, Q. Zhang and F. S. D. Xuebao, J. Beijing Univ. Chem. Technol., 1990, 3, 59 Search PubMed
.
- W. Jantscher, L. Binder, D. A. Fiedler, R. Andreaus and K. Kordesch, J. Power Sources, 1999, 79, 9 CrossRef CAS
.
- V. K. Nartey, L. Binder and A. Huber, J. Power Sources, 2000, 87, 205 CrossRef CAS
.
- H. Tamura, K. Ishizeki, M. Nagayama and R. Furuichi, J. Electrochem. Soc., 1994, 141, 2035 CrossRef CAS PubMed
.
- V. S. Kolosnitsyn, E. A. Minnikhanova, E. V. Karaseva, Y. K. Dmitriev and M. M. Muratov, Russ. J. Appl. Chem., 2005, 78, 737 CrossRef CAS PubMed
.
- H. M. Abbas, K. S. Abu-El-Sherbini, M. H. Askar and A. M. Hashim, J. Mater. Sci. Technol., 2001, 17, 351 CAS
.
- M. Ghaemi, L. Khosravi-Frad and J. Neshati, J. Power Sources, 2005, 141, 340 CrossRef CAS PubMed
.
- R. K. Ghavami, Z. Rafiei and S. M. Tabatabaei, J. Power Sources, 2007, 164, 934 CrossRef CAS PubMed
.
- S. Devaraj and N. Munichandraiah, J. Electrochem. Soc., 2007, 154, A901 CrossRef CAS PubMed
.
- R. Jiang, T. Huang, J. Liu, J. H. Zhuang and A. Yu, Electrochim. Acta, 2009, 54, 3047 CrossRef CAS PubMed
.
- Y. Li, H. Xie, J. Wang and L. Chen, Mater. Lett., 2011, 65, 403 CrossRef CAS PubMed
.
- B. Suhasini and A. C. Hegde, J. Electroanal. Chem., 2012, 676, 35 CrossRef PubMed
.
- H. Zhang, Y. Wang, C. Liu and H. Jiang, J. Alloys Compd., 2012, 517, 1–8 CrossRef CAS PubMed
.
- B. Suhasini, J. Electroanal. Chem., 2013, 690, 13 CrossRef PubMed
.
- H. Zhang, J. Gu, Y. Jiang, J. Zhao, X. Zhang and C. Wang, J. Solid State Electrochem., 2014, 18, 235 CrossRef CAS
.
- A. Biswal, B. C. Tripathy, T. Subbaiah, D. Meyrick and M. Minakshi, J. Solid State Electrochem., 2013, 17, 1349 CrossRef CAS PubMed
.
- A. Biswal, B. C. Tripathy, T. Subbaiah, D. Meyrick, M. Ionescu and M. Minakshi, Metallurgical and Materials Transactions E, 2014, 1, 226 CrossRef PubMed
.
- A. Biswal, B. C. Tripathy, T. Subbaiah, D. Meyrick and M. Minakshi, J. Electrochem. Soc., 2015, 162, A30 CrossRef CAS PubMed
.
- J. P. Rethinaraj and S. Visvanathan, J. Power Sources, 1993, 42, 335 CrossRef CAS
.
- A. Urfer, G. A. Lawrance and D. A. J. Swinkels, J. Appl. Electrochem., 1997, 27, 667 CrossRef CAS
.
- K. V. Kordesch, in Batteries, ed. K. V. Kordesch, Manganese dioxide, P.241, Marcel Dekker, New York, 1974, vol. 1 Search PubMed
.
- K. V. Kordesch and M. Welssenbacher, J. Power Sources, 1994, 51, 61 CrossRef CAS
.
- E. Machefaux, L. I. Hill and D. Guyomard, ECS, 2003, 204th Meeting, Abstract #365.
- S. Chou, F. Cheng and J. Chen, J. Power Sources, 2006, 162, 727 CrossRef CAS PubMed
.
- J. M. Jiaqin, Y. L. Jiao, Y. Mao, T. Wang, X. Duan, J. Lian and W. Zheng, CrystEngComm, 2012, 14, 453 RSC
.
- Y. Wang and Q. Z. Qin, J. Electrochem. Soc., 2002, 149, A873 CrossRef CAS PubMed
.
- P. S. D. Brito, S. Patricio, L. F. Rodrigues and C. A. C. Sequeria, Surf. Coat. Technol., 2012, 206, 3036 CrossRef CAS PubMed
.
- W. M. Dose, J. Lehr and S. W. Donne, Mater. Res. Bull., 2012, 47, 1827 CrossRef CAS PubMed
.
- M. M. Thackeray, Prog. Solid State Chem., 1997, 25, 1 CrossRef CAS
.
- Y. Chabre and J. Pannetier, Prog. Solid State Chem., 1995, 23, 1 CrossRef CAS
.
- D. E. Simon, R. W. Morton and J. J. Gislason, International Centre for Diffraction Data 2004, Adv. X-Ray Anal., 2004, 47, 267 CAS
.
- R. G. Burns, in Battery Material Symposium, 1, Brussels, ed. A. Kozawa and M. Nagayama, IBA, Cleveland, Ohio, 1983, p. 341 Search PubMed
.
- A. Bystrom, Acta Chem. Scand., 1949, 3, 163 CrossRef CAS PubMed
.
- S. Turner, Ph.D thesis, Arizona State Univ., Tempe, 1982
.
- L. Tongqing, 2013, China National Friendship Association of EMD Producers CITIC Dameng Mining Industries Ltd., IMI's 10th EPD China Conference, 5th International Forum of Mn Electrolytic Products, March 29, 2013, Guiyang, China.
- N. Dhananjayan, S. C. Aush, P. L. SenGupta and P. K. Sinha, Battery Mater. Symp., [Proc.], 1987, 3, 101 CAS
.
- S. C. Aush, P. K. Sinha and P. L. Sengupta, NML Tech. J., 1990, 32, 40 CAS
.
- T. Taylor, 1993, Electrolytic manganese dioxide production by Australian Manganese Company Limited, Newcastle, Australasian Mining and Metallurgy, Clunies Ross House, Victoria, Australia 2 (Monograph No.19), pp. 1237–1238.
- J. M. M. Paixdo, J. C. Amaral, L. E. Memoria and L. R. Freitas, Hydrometallurgy, 1995, 39, 215 CrossRef
.
- A. G. Kholmogorov, A. M. Zhyzhaev, U. S. Kononov, G. A. Moiseeva and G. L. Pashkov, Hydrometallurgy, 2000, 56, 1 CrossRef CAS
.
- A. M. A. Hashem, K. S. Abou-El-Sherbini, S. Zein-El-Abedin and H. Abbas, J. Mater. Sci. Technol., 2006, 22, 9 Search PubMed
.
- W. Zhang and Y. C. Chu, Hydrometallurgy, 2007, 89, 137 CrossRef CAS PubMed
.
- C. C. B. M. de Souza and J. A. S. Tenorio, J. Power Sources, 2004, 136, 191 CrossRef CAS PubMed
.
- T. T. Nguyen, US Pat. 4992149, 1991
.
- R. Raghavan and R. N. Upadhyay, Hydrometallurgy, 1999, 51, 207 CrossRef CAS
.
- A. Biswal, K. Sanjay, M. K. Ghosh, T. Subbaiah and B. K. Mishra, Hydrometallurgy, 2011, 110, 44 CrossRef CAS PubMed
.
- A. Biswal, B. Dash, B. C. Tripathy, T. Subbaiah, S. M. Shin, K. Sanjay and B. K. Mishra, Hydrometallurgy, 2013, 140, 151 CrossRef CAS PubMed
.
- A. Biswal, B. C. Tripathy, K. Sanjay, D. Meyrick, T. Subbaiah and M. Minakshi, J. Solid State Electrochem., 2013, 17, 3191 CrossRef CAS
.
- A. Biswal, S. Mahakud, B. Sandhyarani, B. Dash, C. K. Sarangi, K. Sanjay, B. C. Tripathy, T. Subbaiah, I. N. Bhattacharaya, S. H. Joo, S. M. Shin and K. H. Park, Hydrometallurgy, 2015, 152, 159 CrossRef CAS PubMed
.
- C. Ward, C. Y. Cheng and M. D. Urbani, Manganese - from waste to high-tech material, Publications of the Australasian Institute of Mining and Metallurgy, 2/2004, 2004, pp. 241–246 Search PubMed
.
- C. B. Ward, WO Patent No. 2005012582, 2005
.
- R. P. Das and S. Anand, Proc. of the Second Ocean Mining Symposium, ISOPE, Seoul, 1997, p. 165 Search PubMed
.
- N. K. Mittal and P. K. Sen, Miner. Eng., 2003, 16, 865 CrossRef CAS
.
- http://www.asx.com.au/asxpdf/20100224/pdf/31nwd59sg94y93.pdf, accessed on 25 June 2015.
- http://mesaminerals.com.au/prospects/emd-market-context, accessed on 25 June 2015.
- A. Kozawa, in Electrochemistry of manganese dioxide, ed. K. V. Kordesh, Batteries Manganese Dioxide, 1974, vol. 1, p. 504 Search PubMed
.
- C. B. Ward, A. I. Walker and A. R. Taylor, Prog. Batteries Battery Mater., 1992, 11, 40 CAS
.
- C. J. Clarke, G. J. Browning and S. W. Donne, Electrochim. Acta, 2006, 51, 5773 CrossRef CAS PubMed
.
- J. Wei, N. Nagarajan and I. Zhitomirsky, J. Mater. Process. Technol., 2007, 186, 356 CrossRef CAS PubMed
.
- H. Xia, W. Xiao, M. O. Lai and L. Lu, Funct. Mater. Lett., 2009, 02, 13 CrossRef CAS
.
- J. N. Broughton and M. J. Brett, Electrochim. Acta, 2005, 50, 4814 CrossRef CAS PubMed
.
- C. C. Hu and T. W. Tsou, Electrochim. Acta, 2002, 47, 3523 CrossRef CAS
.
- M. Fleischmann, H. R. Thirsk and I. M. Tordesillas, Trans. Faraday Soc., 1962, 58, 1865 RSC
.
- A. Cross, A. Morel, A. Cormie, C. Tony and H. S. Donne, J. Power Sources, 2011, 196, 7847 CrossRef CAS PubMed
.
- M. M. E. Duarte, A. S. Pilla and C. E. Mayer, J. Appl. Electrochem., 2003, 33, 387 CrossRef CAS
.
- C. C. Hu, P. Y. Chuang and Y. T. Wu, J. Electrochem. Soc., 2005, 152, C723 CrossRef PubMed
.
- N. L. Gruet, S. Peulon, A. Lacroix and A. Chaussé, Electrochim. Acta, 2008, 53, 7281 CrossRef PubMed
.
- W. H. Kao and V. J. Weibel, J. Appl. Electrochem., 1992, 22, 21 CrossRef CAS
.
- R. L. Paul and A. Cartwright, J. Electroanal. Chem. Interfacial Electrochem., 1986, 201, 113 CrossRef CAS
.
- R. L. Paul and A. Cartwright, J. Electroanal. Chem. Interfacial Electrochem., 1986, 201, 123 CrossRef CAS
.
- K. Matsuki, T. Endo and H. Kamada, Electrochim. Acta, 1984, 29, 983 CrossRef CAS
.
- K. Matsuki, T. Endo and H. Kamada, Electrochim. Acta, 1985, 30, 1329 CrossRef CAS
.
- S. Rodrigues, N. Munichandraiah and A. K. Shukla, J. Appl. Electrochem., 1998, 28, 1235 CrossRef CAS
.
- J. Farris and S. Martin, 2004, Department of Materials Science and Engineering, Michigan Technological University, MY 3110 Technical Report, 2004, April 28.
- O. G. Tsiklauri, T. A. Marsagishvili, G. S. Tsurtsumiya, S. A. Kirillov and D. I. Dzanashvili, Russ. J. Electrochem., 2008, 44, 1299 CrossRef CAS
.
- P. N. Naguman, Russian Journal of Non-Ferrous Metals, 2009, 50, 13–16 CrossRef
.
- M. Devenney, S. W. Donne and S. Gorer, J. Appl. Electrochem., 2004, 34, 643 CrossRef CAS
.
- H. J. Guo, B. Q. Zhu, X. H. Li, X. M. Zhang, Z. W. Wang, W. J. Peng and L. P. Liu, J. Cent. South Univ. Technol., 2005, 12, 667 CrossRef CAS PubMed
.
- E. Preisler, J. Appl. Electrochem., 1989, 19, 559 CrossRef CAS
.
- E. Preisler, J. Appl. Electrochem., 1989, 19, 540 CrossRef CAS
.
- H. Adelkhani and M. Ghaemi, Solid State Ionics, 2008, 179, 2278 CrossRef CAS PubMed
.
- H. Adelkhani, M. Ghaemi and M. Ruzbehani, J. Electrochem. Soc., 2011, 6, 123 CAS
.
- A. Biswal, B. C. Tripathy, A. Singh, K. Sanjay, T. Subbaiah and B. K. Mishra, International conference of Hydrometallurgy, Victoria BC, Canada, II, 183, June 22–25, 2014 Search PubMed
.
- J. P. Rethinaraj, S. C. Chockalingam, S. Kulandaisamy and S. Visvanathan, Hydrometallurgy, 1993, 34, 119 CrossRef CAS
.
- S. C. Chockalingam, R. J. Prabhakar, S. Kulandaisamy and S. Visnanthan, Indian J. Chem., 1997, 36A, 683 CAS
.
- V. S. Kolosnitsyn, E. A. Minnikhanova, E. V. Karaseva, Y. K. Dmitriev and M. M. Muratov, Russ. J. Appl. Chem., 2005, 78, 891 CrossRef CAS PubMed
.
- Q. Guohong, W. Hui, G. Qian, Hu. Yuhua, Y. Dan and L. Fan, Ionics, 2011, 17, 209 CrossRef
.
- J. P. Rethinaraj and S. Visvanathan, Mater. Chem. Phys., 1991, 27, 337 CrossRef CAS
.
- M. Ghaemi, R. K. Ghavami, L. Khosravi-Fard and M. Z. Kassaee, J. Power Sources, 2004, 125, 256 CrossRef CAS PubMed
.
- S. V. Skopov, S. S. Naboichenko and L. I. Galkova, Russian Journal of Non-Ferrous Metals, 2009, 50, 20 CrossRef
.
- Z. M. Kebadze, L. S. Kakuriya and K. T. Ugrelidze, Russ. J. Appl. Chem., 2008, 81, 1953 CrossRef CAS
.
- J. Tang, H. M. Meng and L. L. Huang, RSC Adv., 2014, 4, 16512 RSC
.
- M. Mauthoor, A. W. Bryson and E. K. Crud Well, Prog. Batteries Battery Mater., 1997, 16, 105 CAS
.
- M. Ghaemi, Doctoral dissertation, TU Graz, Austria, 1995
.
- M. Ghaemi, Z. Biglari and L. Binder, J. Power Sources, 2001, 102, 29 CrossRef CAS
.
- Y. S. Kononov, G. L. Pashkov, V. V. Patrushev, A. G. Kholmogorov and V. P. Plekhanov, Russ. J. Appl. Chem., 2007, 80, 340 CrossRef
.
- H. Adelkhani and M. Ghaemi, J. Alloys Compd., 2009, 481, 446 CrossRef CAS PubMed
.
- H. Adelkhani, J. Electrochem. Soc., 2009, 156, A791 CrossRef CAS PubMed
.
- H. Adelkhani, Appl. Surf. Sci., 2012, 258, 6232 CrossRef CAS PubMed
.
- H. Adelkhani, M. Ghaemi and S. M. Jafari, J. Power Sources, 2007, 163, 1091 CrossRef CAS PubMed
.
- W. M. Swierbut and J. C. Nardi, US Pat. 5,501,924, 1996
.
- V. Ganesh Kumar, J. S. Ganaraj, S. Ben-David, D. M. Pickup, E. R. H. Van-Eck, A. Gedanken and D. Aurbach, Chem. Mater., 2003, 15, 4211 CrossRef
.
- W. Bowden, C. P. Grey, S. Hackney, F. Wang, Y. Paik, N. Iltchev and R. Sirotina, J. Power Sources, 2006, 153, 265 CrossRef CAS PubMed
.
- W. H. Kao, V. J. Weibel and M. J. Root, J. Electrochem. Soc., 1992, 139, 1223 CrossRef CAS PubMed
.
- C. G. Castledine and B. E. Conway, J. Appl. Electrochem., 1995, 25, 707 CrossRef
.
- Q. Tong and J. Lian, J. Electrochem. Soc., 1997, 144, 4110 CrossRef CAS PubMed
.
- S. Bodoardo, N. Penazzi, P. Spinelli and M. Arrabito, J. Power Sources, 2001, 94, 194 CrossRef CAS
.
- G. V. Sokolsky, S. V. Ivanov, N. D. Ivanova, Y. I. Boldurev, O. V. Kobulinskaya and M. V. Demchenko, Proceedings of the International Workshop Oxide Materials for Electronic Engineering, Acta Physicapolonica Lviv, 2009, 117, 86.
- G. H. Qiu, H. Wen, Q. Guo, Y. H. Hu, D. Yang and F. Liu, Ionics, 2011, 17, 209 CrossRef CAS
.
- B. Liu, P. S. Thomas, A. S. Ray, R. P. Williams and S. W. Donne, J. Therm. Anal. Calorim., 2007, 88, 177 CrossRef CAS
.
- C. L. Xu, S. J. Baoa, L. B. Kong, H. Li and H. L. Li, J. Solid State Chem., 2006, 179, 1351 CrossRef CAS PubMed
.
- J. Lee, J. M. Lee, Y. Sukeun, S. O. Kim, J. S. Sohn, K. I. Rhee and H. J. Sohn, J. Power Sources, 2008, 183, 325 CrossRef CAS PubMed
.
- S. Chou, J. Z. Wang, S. Y. Chew, H. Liu and S. X. Dou, Electrochem. Commun., 2008, 10, 1724 CrossRef CAS PubMed
.
- M. S. Wu, Z. S. Guo and J. J. Jow, J. Phys. Chem. C, 2010, 114, 21861 CAS
.
- A. Bahloul, B. Nessark, N. E. Chelali, H. Groult, A. Mauger and C. M. Julien, Solid State Ionics, 2011, 204, 53 CrossRef PubMed
.
- P. Johns, M. Roberts and J. Owen, J. Mater. Chem., 2011, 21, 10153 RSC
.
- J. H. Kim, T. Ayalasomayajula, V. Gona and C. Daniel, J. Power Sources, 2008, 183, 366 CrossRef CAS PubMed
.
- F. Xiao and Y. Xu, Int. J. Electrochem. Sci., 2012, 7, 7440 CAS
.
- M. Dupont, A. F. Hollenkamp and S. W. Donne, Electrochim. Acta, 2013, 104, 140 CrossRef CAS PubMed
.
- X. M. Wu, J. L. Liu, S. Chen, F. R. Mai and C. A. Li, Ionics, 2012, 18, 579 CrossRef CAS
.
- S. M. Davis, W. L. Bowden and T. C. Richards, J. Power Sources, 2005, 139, 342 CrossRef CAS PubMed
.
- W. M. Dose and S. W. Donne, Mater. Sci. Eng., B, 2011, 176, 1169 CrossRef CAS PubMed
.
- M. Minakshi, D. R. G. Mitchell and P. Singh, Electrochim. Acta, 2007, 52, 3294 CrossRef PubMed
.
- A. J. B. Dura and I. C. F. Almeida, Mater. Sci. Forum, 2008, 570, 114 CrossRef
.
- E. Narita and T. Okabe, Bull. Chem. Soc. Jpn., 1980, 53, 525 CrossRef CAS
.
- J. B. Fernandes, B. D. Desai and V. N. K. Dalal, Electrochim. Acta, 1983, 28, 309–315 CrossRef CAS
.
- P. Ruetschi, J. Electrochem. Soc., 1984, 131, 2737 CrossRef CAS PubMed
.
- J. Fitzpatrick, L. A. H. Maclean, D. A. J. Swinkels and F. L. Tye, J. Appl. Electrochem., 1997, 27, 243 CrossRef CAS
.
- M. V. Ananth, S. Pethkar and K. Dakshinamuthi, J. Power Sources, 1998, 75, 278 CrossRef CAS
.
- D. Qu, J. Power Sources, 2006, 156, 692 CrossRef CAS PubMed
.
- Y. S. Kononov, A. M. Zhizhaev and V. V. Patrushev, Russ. J. Appl. Chem., 2003, 76, 1011 CrossRef CAS
.
- J. A. Lee, C. E. Newnham, F. S. Stone and F. L. Tye, J. Colloid Interface Sci., 1973, 45, 289 CrossRef CAS
.
- J. P. Brenet and P. Faber, Symposium. I.S.E. Batteries Marcoussis, France, 1995 Search PubMed
.
- J. H. Sharp and D. M. Tinsley, J. Therm. Anal., 1971, 3, 43 CrossRef
.
- J. B. Fernandes, B. D. Desai and V. N. K. Dalal, Electrochim. Acta, 1985, 29, 187–193 CrossRef
.
- F. Petit, J. Durr, M. Lenglet and B. Hannoyer, Mater. Res. Bull., 1993, 28, 959 CrossRef CAS
.
- J. B. Arnott, R. P. Williams, A. G. Pandolfo and S. W. Donne, J. Power Sources, 2007, 165, 581 CrossRef CAS PubMed
.
- W. M. Dose and S. W. Donne, J. Electrochem. Soc., 2011, 158, A905 CrossRef CAS PubMed
.
- M. Ghaemi, A. Gholami and R. B. Moghaddam, Electrochim. Acta, 2008, 53, 3250 CrossRef CAS PubMed
.
- Y. Zhao, Q. Jiang, W. Wang, K. Du and G. Hu, Trans. Nonferrous Met. Soc. China, 2012, 22, 1146 CrossRef CAS
.
- A. Urfer, G. A. Lawrance and D. A. J. Swinkels, J. Appl. Electrochem., 2001, 31, 341 CrossRef CAS
.
- K. R. Prasad and N. Miura, J. Power Sources, 2004, 135, 354 CrossRef CAS PubMed
.
- T. Ohzuku, M. Kitagawa and T. Hirai, J. Electrochem. Soc., 1989, 136, 3169 CrossRef CAS PubMed
.
- T. Ohzuku, M. Kitagawa and T. Hirai, J. Electrochem. Soc., 1990, 137, 40 CrossRef CAS PubMed
.
- T. Ohzuku, M. Kitagawa and T. Hirai, J. Electrochem. Soc., 1990, 137, 769 CrossRef CAS PubMed
.
- E. Levi, E. Zinigrad, H. Teller, M. D. Levi, D. Aurbach, E. Mengeritsky, E. Elster, P. Dan, E. Granot and H. Yamin, J. Electrochem. Soc., 1997, 144, 4133 CrossRef CAS PubMed
.
- H. S. Kim, H. J. Kim, W.-I. Cho, B. W. Cho and J. B. Ju, J. Power Sources, 2002, 112, 660 CrossRef CAS
.
- C. Mondolini, M. Laborde, J. Rioux, E. Andoni and C. Levy-Clement, J. Electrochem. Soc., 1992, 139, 954 CrossRef PubMed
.
- D. Balachandran, D. Morgan and G. Ceder, J. Solid State Chem., 2002, 166, 91 CrossRef CAS
.
- S. W. Donne, G. A. Lawrance and D. A. J. Swinkels, J. Electrochem. Soc., 1997, 144, 2949 CrossRef CAS PubMed
.
- H. Y. Kang and C. C. Liang, J. Electrochem. Soc., 1968, 115, 6 CrossRef CAS PubMed
.
- D. Boden, C. J. Venuto, D. Wisler and R. B. Wylie, J. Electrochem. Soc., 1968, 115, 333 CrossRef CAS PubMed
.
- K. V. Kordesch and A. Kozawa, US Pat. 3945847, 1976
.
- K. V. Kordesch, US Pat. 4091178, 1978
.
- R. Chenelli, J. Gsellmann, G. Kerbler and K. Kordesch, 2nd International Symp. Manganese Dioxide, Extended Abstracts, The Electrochem. Soc., Japan, 1980, p. 57 Search PubMed
.
- A. Kozawa and J. F. Yeager, J. Electrochem. Soc., 1965, 112, 959 CrossRef CAS PubMed
.
- A. Kozawa and R. A. Powers, J. Electrochem. Soc., 1966, 113, 870 CrossRef CAS PubMed
. Crf. A. Kozawa and J. F. Yeager, J. Electrochem. Soc., 1968, 115, 1003 CrossRef PubMed
.
- A. Kozawa and R. A. Powers, Electrochem. Technol., 1967, 5, 535 Search PubMed
, Crf. A. Kozawa and J. F. Yeager, J. Electrochem. Soc., 1968, 115, 1003 CrossRef CAS PubMed
.
- A. Kozawa and R. A. Powers, J. Electrochem. Soc., 1968, 115, 122 CrossRef CAS PubMed
. Crf. A. Kozawa and J. F. Yeager, J. Electrochem. Soc., 1968, 115, 1003 CrossRef PubMed
.
- A. Kozawa and J. F. Yeager, J. Electrochem. Soc., 1968, 115, 1003 CrossRef CAS PubMed
.
- J. McBreen, J. Power Sources, 1975, 5, 525 Search PubMed
. Crf. A. M. Kannan, S. Bhavaraju, F. Prado, M. Manivel Raja and A. Manthiram, J. Electrochem. Soc., 2002, 149, A483 CrossRef CAS PubMed
.
- J. McBreen, Electrochim. Acta, 1975, 20, 221 CrossRef CAS
.
- J. M. Amarilla, F. Tedjar and C. Poinsignon, Electrochim. Acta, 1988, 39, 2321 CrossRef
.
- S. W. Donne, G. A. Lawrance and D. A. J. Swinkels, J. Electrochem. Soc., 1997, 144, 2954 CrossRef CAS PubMed
.
- Y. Shen and K. Kordesch, J. Power Sources, 2000, 87, 162 CrossRef CAS
.
- A. Stani, W. T. Mautner, K. Kordesch and J. Daniel-Ivad, J. Power Sources, 2006, 153, 405 CrossRef CAS PubMed
.
- M. Minakshi, J. Electroanal. Chem., 2008, 616, 99 CrossRef CAS PubMed
.
- T. Nohma, Y. Yamamoto, I. Nakane and N. Furukawa, J. Power Sources, 1992, 39, 51 CrossRef CAS
.
- T. Nohma, S. Yoshimura, K. Nishio, Y. Yamamoto, S. Fukuoka and M. Hara, J. Power Sources, 1996, 58, 205 CrossRef CAS
.
- R. L. Deutscher, T. M. Florence and R. Woods, J. Power Sources, 1995, 55, 41 CrossRef CAS
.
- M. Minakshi, P. Singh, T. B. Issa, S. Thurgate and R. de Marco, J. Power Sources, 2004, 130, 254 CrossRef PubMed
.
- M. Minakshi, P. Singh, T. B. Issa, S. Thurgate and R. de Marco, J. Power Sources, 2004, 138, 319 CrossRef CAS PubMed
.
- W. Bowden, T. Bofinger, F. Zhang, N. Iltchev, R. Sirotina, Y. Paik, H. Chen, C. Grey and S. Hackney, J. Power Sources, 2007, 165, 609 CrossRef CAS PubMed
.
- M. Minakshi, M. Blackford and M. Ionescu, J. Alloys Compd., 2011, 509, 5974 CrossRef CAS PubMed
.
- M. Minakshi, P. Singh, M. Carter and K. Prince, Electrochem. Solid-State Lett., 2008, 11, A145 CrossRef CAS PubMed
.
- M. Minakshi, Electrochem. Solid-State Lett., 2010, 13, A125 CrossRef CAS PubMed
.
- P. Liu, S. H. Lee, Y. Yan, C. E. Tracy and J. A. Turner, J. Power Sources, 2006, 158, 659 CrossRef CAS PubMed
.
- M. Minakshi, Mater. Sci. Eng., B, 2012, 177, 1788 CrossRef CAS PubMed
.
- M. Minakshi and D. Meyrick, Electrochim. Acta, 2013, 101, 66 CrossRef CAS PubMed
.
- T. Yamamoto and T. Shoji, Inorg. Chim. Acta, 1985, 117, L27 CrossRef
.
- T. Shoji, M. Hishinuma and T. Yamamoto, J. Appl. Electrochem., 1988, 18, 521 CrossRef CAS
.
- M. H. Askar, H. Abbas and S. E. Afifi, J. Power Sources, 1994, 48, 303 CrossRef CAS
.
- M. Minakshi and D. R. G. Mitchell, J. Appl. Electrochem., 2009, 39, 1 CrossRef CAS
.
- L. Mai, H. Li, Y. Zhao, L. Xu, X. Xu, Y. Luo, Z. Zhang, W. Ke, C. Niu and Q. Zhang, Sci. Rep., 2013, 3, 1718 Search PubMed
.
- S. P. Ong, V. L. Chevrier, G. Hautier, A. Jain, C. Moore, S. Kim, X. Ma and G. Ceder, Energy Environ. Sci., 2011, 4, 3680 CAS
.
- M. W. Chase, NIST-JANAF Thermochemical Tables, Am. Chem. Soc., New York, 1998, vol. 12 Search PubMed
.
- J. Y. Luo and Y. Y. Xia, Adv. Funct. Mater., 2007, 17, 3877 CrossRef CAS PubMed
.
- J. Gopalakrishnan, Bull. Mater. Sci., 1985, 7, 201 CrossRef CAS
.
- A. S. Pilla, M. M. E. Duarte and C. E. Mayer, J. Electroanal. Chem., 2004, 569, 7 CrossRef CAS PubMed
.
- K. Q. Ding, J. Chin. Chem. Soc., 2008, 55, 543 CrossRef CAS PubMed
.
- C. J. Jafta, F. Nkosi, L. LeRoux, M. A. Kebede, K. Makgopa, M. K. Mathe, N. Manyala, M. Oyama and K. I. Ozoemena, ECS Trans., 2013, 50, 93 CrossRef PubMed
.
- C. J. Jafta, F. Nkosi, L. LeRoux, M. K. Mathe, M. Kebede, K. Makgopa, Y. Song, D. Tong, M. Oyama, N. Manyala, S. Chen and K. I. Ozoemena, Electrochim. Acta, 2013, 110, 228 CrossRef CAS PubMed
.
- D. Delgado, M. Minakshi, G. Senanayake and D.-J. Kim, J. Solid State Electrochem., 2015, 19, 1133 CrossRef CAS PubMed
.
- M. M. Thackeray, M. H. Rossouw, R. J. Gummow, D. C. Liles, K. Pearce, A. de Kock, W. I. F. David and S. Hull, Electrochim. Acta, 1993, 38, 1259 CrossRef CAS
.
- http://www.americanmanganeseinc.com/wpcontent/uploads/2012/07/AMY_Manganese_Final_HR.pdf, accessed on 25 June 2015.
| This journal is © The Royal Society of Chemistry 2015 |


