DOI:
10.1039/C5RA24564H
(Paper)
RSC Adv., 2016,
6, 17204-17214
Photocatalytic degradation of binary mixture of toxic dyes by HKUST-1 MOF and HKUST-1-SBA-15 in a rotating packed bed reactor under blue LED illumination: central composite design optimization†
Received
19th November 2015
, Accepted 20th January 2016
First published on 25th January 2016
Abstract
A new composite of mesoporous materials, HKUST-1 metal organic framework and SBA-15, was synthesized and applied to the simultaneous visible light photodegradation of a binary mixture of safranin O and malachite green. Structural and electronic properties of the samples were characterized by X-ray diffraction (XRD), scanning electron microscopy (SEM), Fourier transform infrared (FTIR), Brunauer–Emmett–Teller (BET), Barrett–Joyner–Halenda (BJH), photoluminescence (PL) and diffuse reflectance spectroscopy (DRS). In the photodegradation process, a rotating packed bed reactor was used to enhance mass transfer and the distribution of irradiance. In the rotating packed bed reactor, by creating a rigorous centrifugal field due to high rotational speed, thick liquid films are converted into thin layers and small droplets, therefore the interfacial area between pollutants and photocatalyst particles increases and mass transfer is improved dramatically. The benefits of visible-light-emitting diodes (LED) compared to UV lamps are economically significant. In the reactor applied here, a blue LED strip with high mechanical flexibility was wrapped around the reactor vessel for uniform irradiance distribution. The influence of the initial dye concentration, rotational speed, solution flow rate, photocatalyst dosage and irradiation time on the photodegradation efficiency and the relationship among these parameters were investigated to find the optimum operational conditions using response surface methodology based on a central composite design (CCD). The results showed that applying HKUST-1-SBA-15 is cost-effective, due to less rotational speed and irradiation times. Investigation on the kinetics of the photodegradation reaction showed that the experimental data follow a pseudo first order reaction, based on the Langmuir–Hinshelwood model.
1. Introduction
Photocatalytic degradation is a clean and green purification technology in the wastewater treatment process.1 Unlike conventional purification methods wherein pollutants are separated or transferred to another phase, in the photodegradation method, pollutants are directly converted to carbon dioxide and water using semiconductors under light irradiation.2 Semiconductors, when exposed to a light source, generate highly reactive radicals such as ˙OH that can destroy pollutants. The activation of the semiconductor depends on its band gap.3 When the band gap is large, a more powerful light source is required to supply energy for photocatalyst activation, resulting in increased operation cost, and the system might not be applicable economically. To activate the large band gap photocatalysts, ultraviolet (UV) irradiation is usually employed; however, UV sources are toxic, which is a great environmental concern, and they also consume a relatively large amount of energy. To overcome these disadvantages, new photocatalysts with narrow band gaps that can be activated in visible light should be used instead. In this study, a new composite of the mesoporous materials, such as HKUST-1 metal organic framework (MOF) and SBA-15, was synthesized as a photocatalyst under blue light irradiation. MOFs have large surface areas in comparison to conventional semiconductors,4–7 and using a blue LED as a source of light is both economical and environmentally safe. A rotating packed bed was innovatively used as a photocatalytic reactor. The continuous flow rotating packed bed reactor was designed for the simultaneous photodegradation of safranin O and malachite green (a binary pollutant mixture) under blue LED illumination. Rotating packed beds employ a powerful centrifugal field and improve mass transfer between phases. Centrifugal force generated by high rotational speed creates a great shear force. Under these conditions, turbulence and micro mixing in a porous bed cause the liquid film to be converted to tiny droplets and thin liquid films, which enhance mass transfer dramatically,8–12 and the large surface area of the packed bed leads to a higher interfacial mass transfer rate. These advantages intensify the solid–liquid mass transfer between the photocatalyst and pollutant solution dramatically. Due to higher interfacial surface area, the rotating photocatalytic packed bed reactor has less physical size and volume than conventional photocatalytic reactors, therefore the capital and operating costs of the process are significantly reduced. The aim of this study is to introduce a novel photocatalytic reactor with high efficiency for the photodegradation process using blue LED illumination. This is a green technology approach that requires less capital and operational costs, in comparison to conventional methods.
2. Experimental
2.1. Materials and apparatus
Reagents and chemicals, including sodium hydroxide, hydrochloric acid and copper(II) nitrate hemipentahydrate, were of the highest purity available, and were purchased from Merck (Darmstadt, Germany). Benzene-1,3,5-tricarboxylic acid was purchase from Sigma Aldrich (America). The solution concentrations were analyzed by UV-vis spectrophotometry (model V-530, Jasco, Japan). The pH was measured using a pH/redox/temperature meter, model AL20pH (AQUALYTIC, Germany). X-ray diffraction (XRD, Philips PW 1800) was recorded using Cu kα radiation (40 kV and 40 mA). The morphologies of the samples were analyzed using scanning electron microscopy (SEM: KYKY-EM3200) under an acceleration voltage of 26 kV. The FT-IR spectra of compounds were obtained on a JASCO-680 instrument in the range of 400–4000 cm−1, using KBr pellets with sample![[thin space (1/6-em)]](https://www.rsc.org/images/entities/char_2009.gif) :
:![[thin space (1/6-em)]](https://www.rsc.org/images/entities/char_2009.gif) KBr ratio of 1
KBr ratio of 1![[thin space (1/6-em)]](https://www.rsc.org/images/entities/char_2009.gif) :
:![[thin space (1/6-em)]](https://www.rsc.org/images/entities/char_2009.gif) 100. DRS spectra were obtained with an Avant spectrophotometer (Avaspec-2048-TEC). Photoluminescence spectroscopy at room temperature was used to determine other optical properties of the samples (PL, Jobin Yvon Horiba HR 800UV, He–Cd laser). The surface area of the material was determined using nitrogen physisorption isotherms on a Micrometrics ASAP 2020 apparatus. Surface area was calculated using the BET method, and the pore size distribution was obtained from the desorption branch of nitrogen isotherms by means of the BJH model.
100. DRS spectra were obtained with an Avant spectrophotometer (Avaspec-2048-TEC). Photoluminescence spectroscopy at room temperature was used to determine other optical properties of the samples (PL, Jobin Yvon Horiba HR 800UV, He–Cd laser). The surface area of the material was determined using nitrogen physisorption isotherms on a Micrometrics ASAP 2020 apparatus. Surface area was calculated using the BET method, and the pore size distribution was obtained from the desorption branch of nitrogen isotherms by means of the BJH model.
2.2. Synthesis of HKUST-1 MOF
HKUST-1 MOF was prepared by an ultrasound-assisted solvothermal method. In summary, benzene-1,3,5-tricarboxylic acid (3.6 mmol) and copper(II) nitrate hemipentahydrate (10 mmol) were sonicated for 1.0 h in 100 mL of solvent consisting of 80 mL dimethylformamide (DMF) and 20 mL ethanol (EtOH) in a glass jar. Subsequently, the mixture was transferred into a Teflon-lined stainless autoclave, sealed and heated at 140 °C for 24 h to yield octahedral crystals. Finally, the solvent was removed, followed by heating in an oven at 100 °C for 12 h to yield a porous material.
2.3. Synthesis of HKUST-1-SBA-15
The HKUST-1-SBA-15 composite was prepared using a step-by-step in situ growth method. A solution consisting of 1,3,5-benzenetricarboxylic acid (3.6 mmol) and Cu (NO3)2·5H2O (10 mmol) dissolved in 100 mL of DMF![[thin space (1/6-em)]](https://www.rsc.org/images/entities/char_2009.gif) :
:![[thin space (1/6-em)]](https://www.rsc.org/images/entities/char_2009.gif) EtOH (5
EtOH (5![[thin space (1/6-em)]](https://www.rsc.org/images/entities/char_2009.gif) :
:![[thin space (1/6-em)]](https://www.rsc.org/images/entities/char_2009.gif) 1 ratio) was added to 0.05 g SBA-15 (the method for the synthesis of SBA-15 is reported in our previous study).13 The suspension was kept for 1.0 h under sonication, which guaranteed complete mixing and fast mass transfer at the solid–liquid interface. Subsequently, the mixture was transferred into a Teflon-lined stainless autoclave, sealed and heated at 140 °C for 24 h. The product was washed with DMF and ethanol and dried in the oven at 100 °C.
1 ratio) was added to 0.05 g SBA-15 (the method for the synthesis of SBA-15 is reported in our previous study).13 The suspension was kept for 1.0 h under sonication, which guaranteed complete mixing and fast mass transfer at the solid–liquid interface. Subsequently, the mixture was transferred into a Teflon-lined stainless autoclave, sealed and heated at 140 °C for 24 h. The product was washed with DMF and ethanol and dried in the oven at 100 °C.
2.4. Feed solution preparation
For each run according to the experimental design, a certain amount of photocatalyst was added to deionized water and mixed well with a stirrer to obtain a homogeneous mixture. The calculated quantity of each dye was dissolved in deionized water to achieve a certain concentration and then added to the abovementioned mixture. To adjust the pH value of the dye solution mixture, 0.1 M HCl and 0.1 M NaOH solutions were added to achieve the desired values. The optimal pH was 6.0, and the concentration range of each dye was 5.0–25 mg L−1.
2.5. Set-up and operation
The schematic diagram (Fig. 1) of the photocatalytic rotating packed bed reveals that the operation is in a continuous flow mode. The main part of the reactor is the rotating porous bed. This bed is made of a wire mesh with high surface area of 800 m2 m−3 and high porosity of 0.9. The porous bed is mounted on a rod connected to a motor that can rotate from 300 rpm to 1700 rpm. Another important section of the reactor is the solution distributor, which is located in center of the bed. The inlet of the distributor has a diameter of 0.25 in., and the outlet of the distributor has 16 holes, with diameter of 0.04 in. During the operation, the pollutant solution (7 liters), including the photocatalyst particles are well mixed in a reservoir tank. An aeration pump is used to supply the required oxygen for the photocatalytic reaction. After being pumped and the flow is set, the solution moves into the distributor, exits the distributor radially with a high velocity, and is sprayed onto the rotating porous bed. Rotation of the bed with high speed generates an intense centrifugal force. The solution collides with the rotating porous bed leading to the formation of droplets and thin layer film. By reduction of the liquid film thickness, mass transfer resistance decreases and mass transfer between photocatalyst particles and dye solution increases. A stationary transparent Plexiglas is installed in the periphery of the rotating section, and with the installation of a strip of blue LED around the Plexiglas, uniform light distribution for activation of the photocatalyst particles is supplied. Around the LED source and reactor housing is an aluminum foil covering, to prevent ray dispersion. Photocatalyst particles are thrown towards the light source with the solution due to the centrifugal force, and penetration of the light on the photocatalyst surface increases. After photodegradation of the dyes in the reactor, the solution flows to the reservoir tank for recycling to achieve maximum efficiency according to the experimental design. Before each run the reactor is operated at a rotational speed of 900 rpm for 30 min under dark conditions, until adsorption–desorption equilibrium is reached. Temperature is maintained at 25 °C. The photodegradation efficiency was calculated using the equation as follows:| |
 | (1) |
where P is the photocatalytic degradation efficiency (%), C0 (mg L−1) and Ct (mg L−1) are the initial and residual concentrations of dyes in solution, respectively.14–17 Temporal UV-vis absorption spectral changes during the photocatalytic degradation using HKUST-1-SBA-15 and HKUST-1 are shown in Fig. 2.
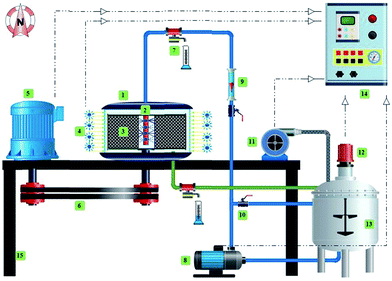 |
| | Fig. 1 Rotating packed bed photocatalytic reactor schematic. (1) Housing; (2) distributor; (3) rotating packed bed; (4) LED strip; (5) motor; (6) belt; (7) sampling point; (8) pump; (9) flowmeter; (10) control valve; (11) aeration pump; (12) stirrer; (13) reservoir tank; (14) control box; and (15) frame. | |
 |
| | Fig. 2 Temporal UV-vis absorption spectral changes during the photocatalytic degradation using HKUST-1-SBA-15 (a) and HKUST-1 (b). | |
3. Central composite design
The number of experiments has an essential role in operational and capital costs. More experiments need more reagents and materials, more analyses and more time. Furthermore, if the experiments are carried out on the industrial scale, there are additional costs imposed on the system. Using experimental design software, less experiments can be carried out. In this study, Design Expert Software (version 7.0.0) was used for experimental design and investigation of the effects of the interactions of essential parameters on the photocatalytic degradation efficiency. Moreover, optimization of the parameter values to reach the maximum efficiency can be obtained using this method. For optimization of the operational parameters, namely, initial SO concentration (X1), initial MG concentration (X2), rotational speed (X3), solution flow rate (X4), photocatalyst dosage (X5) and illumination time (X6), the central composite design under response surface methodology was used, and the responses are percentage photodegradation of SO and MG. To investigate the relation and interaction between the operational parameters and responses, analysis of variance (ANOVA) was applied based on F-test and p-values.18–20 Using this procedure, graphical results of analysis can be achieved. CCD applies a second order polynomial equation to model the interaction of the six independent parameters on the photocatalytic degradation process as follows:21–24| |
 | (2) |
where P is the percentage photocatalytic degradation (predicted response); Xi's and Xj's are the independent parameters including dye concentrations, photocatalyst dosage, irradiation time, rotational speed and solution flow rate; β0 is the model constant parameter; βi is the linear coefficient; βii are the quadratic coefficients and βij are the cross-product coefficients.14,16,17,25,26 For each parameter, five levels (Table 1) were considered. The 42 experimental runs for six parameters and two responses are listed in Table S1† for HKUST-1-SBA-15 and HKKUST-1, respectively.
Table 1 Levels of factors in CCD
| Factors |
Levels |
| Low (−1) |
Central (0) |
High (+1) |
−α |
+α |
| X1: MG concentration (mg L−1) |
10 |
15 |
20 |
5 |
25 |
| X2: SO concentration (mg L−1) |
10 |
15 |
20 |
5 |
25 |
| X3: rotational speed (rpm) |
600 |
800 |
1000 |
400 |
1200 |
| X4: flow rate (L min−1) |
0.2 |
0.3 |
0.4 |
0.1 |
0.5 |
| X5: photocatalyst dosage (g L−1) |
0.15 |
0.2 |
0.25 |
0.1 |
0.3 |
| X6: irradiation time (min) |
45 |
60 |
75 |
30 |
90 |
4. Results and discussion
4.1. Characterization of photocatalysts
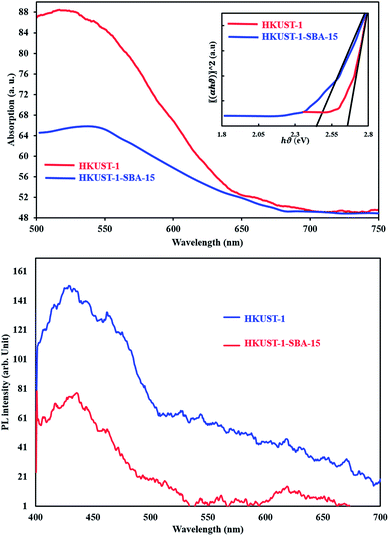
Diffuse reflectance spectroscopy (Fig. 3) was applied to estimate the energy band gap of the samples. The band gap of each sample was estimated using the equation as follows:
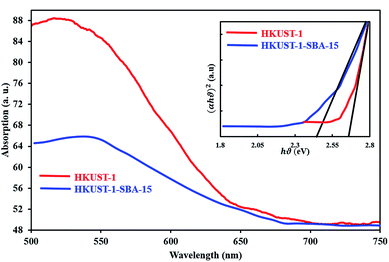 |
| | Fig. 3 DRS of samples and Tauc plot (inset). From extrapolations, the band gaps of materials were obtained. | |
In this equation, α is the absorption coefficient, B is a proportionality constant, ν is the frequency of photons and Eg the absorption band gap. The (αhν)2 versus hν is plotted in (Fig. 3) on the basis of the data obtained. The direct band gap of the sample was estimated from the intercept of the straight line at α = 0, which is found to be 2.63 eV and 2.45 eV for HKKUST-1 and HKUST-1-SBA-15, respectively, indicating that these samples can be activated by blue light.
FTIR spectra of HKUST-1 MOF and HKUST-1-SBA-15 over the range of 500–4000 cm−1 in the solid-state are shown in Fig. 4a. In both spectra, the large broad band over the range of 3000–3400 cm−1 is attributed to the O–H bond stretching of surface active carbon, and the peaks present at around 1100 and 1600 cm−1 correspond to the vibrational and bending modes of H–O–H, respectively. In HKUST-1 FTIR spectrum, the peaks at 1645, 1639 and 1480 cm−1 correspond to the C![[double bond, length as m-dash]](https://www.rsc.org/images/entities/char_e001.gif) O symmetric and asymmetric modes. In the spectra of HKUST-1-SBA-15, the bands around 1080 cm−1 were observed, and were assigned to the stretching and bending vibrations of O–Si–O and Si–O of silanol groups from SBA-15, which are expected to be observed in the spectrum of the HKUST-1-SBA-15.
O symmetric and asymmetric modes. In the spectra of HKUST-1-SBA-15, the bands around 1080 cm−1 were observed, and were assigned to the stretching and bending vibrations of O–Si–O and Si–O of silanol groups from SBA-15, which are expected to be observed in the spectrum of the HKUST-1-SBA-15.
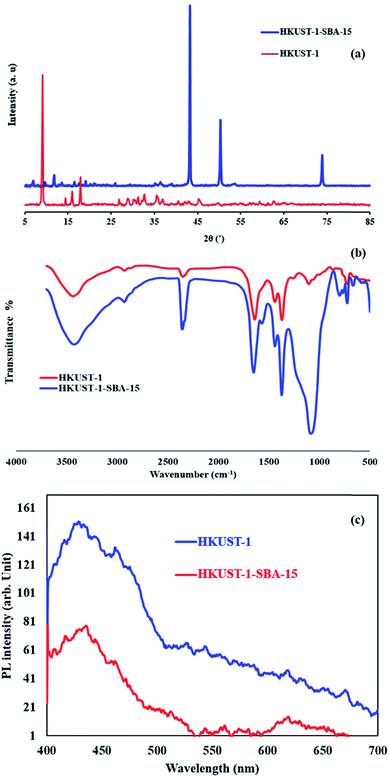 |
| | Fig. 4 XRD pattern (a), FT-IR (b) and PL (c) spectra of the samples. | |
The crystal structure was investigated using XRD. In Fig. 4b, three sharp peaks at 2θ of 44°, 51°and 74° in each XRD pattern match well to the (111), (200) and (220) crystal planes of the pure solid phase copper (PDF card no. 04-0836). Compared with the pure HKUST-1 sample, the intensities of the main diffraction peaks of HKKUST-1 MOF in the composites decreased and other peaks observed in the composite patterns correspond to SiO2 formed in the SBA-15.
Photoluminescence spectroscopy is a useful technique for surveying the separation efficiency of the photogenerated charge carriers in semiconductors; the higher the PL intensity, the larger the probability for charge carrier recombination.27,28 Therefore, a comparison of the PL spectra of HKUST-1 and the HKUST-1-SBA-15 composite at room temperature was carried out and the results are shown in Fig. 4c. HKUST-1 has a broad blue-green emission peak, and the strongest blue emitting peak occurs at wavelength of 430 nm. It was found that the PL emission intensity of the HKUST-1-SBA-15 composite was dramatically weakened compared with HKUST-1, which clearly indicates that the recombination of photogenerated charge carriers between the hybrid orbitals is greatly inhibited by the heterojunction nanostructure. In other words, the coupling of HKUST-1 and SBA-15 is helpful to separate the photogenerated charge carriers. The slower recombination process of photogenerated charges (the lower the PL intensity) can facilitate the enhancement of the photocatalytic activity of the HKUST-1-SBA-15 composite.
The morphology of the resulting crystals of HKUST-1 MOF and HKUST-1-SBA-1 are shown in the SEM micrograph (Fig. 5). The sizes of the octahedral HKUST-1 MOF particles were in the range of 0.1–0.8 μm (Fig. 5a). The SEM image of HKUST-1-SBA-15 (Fig. 5b) shows the porous structure of HKUST-1-SBA-15, which increases its surface area for efficient degradation properties.
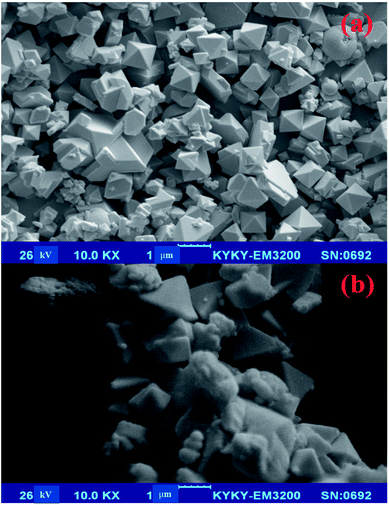 |
| | Fig. 5 SEM images of HKUST-1 (a) and HKUST-1-SBA-15 (b). | |
The textural and physicochemical properties of HKUST-1 MOF and HKUST-1-SBA-15 composites, such as the pore diameter (DBJH), the BET surface area and total pore volume (Vtotal), are given in Table 2. HKUST-1 nitrogen adsorption–desorption measurements showed a BET surface area of 196.89 m2 g−1. This value increased by more than 270% to a final surface area of 531.86 m2 g−1, when the sample was composited with SBA-15 (see Fig. 6 and Table 2). There was also an increase in the BET surface area, the mesoporous volume and average pore diameter after the modification, indicating the composite was successfully prepared. The higher BET surface area, mesoporous volume and average pore diameter of HKUST-1-SBA-15 means the composite can facilitate the enhancement of photocatalytic activity.
Table 2 Information obtained by BET and BJH for the samples
| Sample |
BET surface area (m2 g−1) |
Pore diameter (BJH) (nm) |
Total pore volume (m3 g−1) |
| HKUST-1 |
196.9 |
8.0 |
0.34 |
| SBA-15-HKUST-1 |
531.6 |
7.4 |
0.86 |
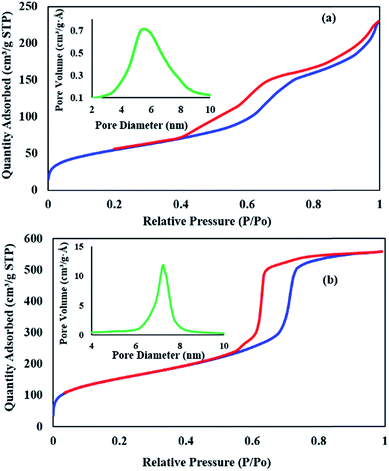 |
| | Fig. 6 Nitrogen adsorption and desorption isotherms for HKUST-1 MOF (a) and SBA-15-HKUST-1 MOF (b) (inset: BJH profile for each sample). | |
4.2. Effect of pH
pH is an important and effective parameter in the photocatalytic degradation of dyes. To study the effect of pH on photodegradation efficiency, solutions with initial pH values ranging from 3.0 to 8.0 were examined. The investigation of photodegradation behavior at different pH values (Fig. 7) shows that the maximum percentage photodegradation was achieved at pH 6. As a result of the neutral photocatalyst surface and the deprotonation of dye molecules, maximum percentage photodegradation was achieved for both dyes at pH = 6, whereas at pH > 6, OH− ions have a great challenge in dye molecule degradation to reach the photocatalyst surface, therefore lower photodegradation is observed. The optimum value of pH was therefore adjusted to 6.
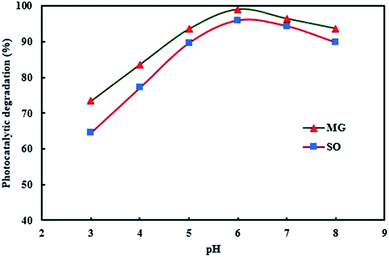 |
| | Fig. 7 Effect of pH on the simultaneous photocatalytic degradation of SO and MG. | |
4.3. Analysis of variance
The significance of each parameter was determined using error functions. These functions were defined by fitting the model to the empirical data. To evaluate the significance of each of the coefficients, the P-value and F-value were used. The P-value less than 0.050 indicates that the model terms are significant.29 Quadratic model terms were evaluated by the P-value with 95% confidence level. The F-values (Tables S2 and S3†) indicate that the model is significant. ANOVA results showed a high coefficient of determination. The R-squared value for the model was found to be 0.99, which is very close to 1. This value indicates that about 99% of the changes in the experimental data can be explained by the quadratic model. Moreover, the lack-of-fit (LOF) of the model should not be significant and ANOVA analysis (Tables S2 and S3†) shows that LOF is insignificant. The experimental results using HKUST-1-SBA-15 were fitted into a quadratic model as shown in the equations as follows:| | |
PMG% = 61.04 − 10.70X1 − 0.59X2 + 10.49X3 + 7.38X4 + 10.35X5 + 6.34X6 + 1.34X1X2 − 1.34X1X3 − 1.15X1X5 − 0.97X1X6 − 0.57X2X3 − 1.30X3X4 − 1.21X3X5 + 2.86X4X5 + 1.94X5X6 + 1.08X12 + 0.42X22 − 3.44X32 − 6.58X42 − 3.55X52 − 1.09X62
| (4) |
| | |
PSO% = 57.96 − 1.25X1 − 9.97X2 + 10.69X3 + 7.38X4 + 11.02X5 + 6.62X6 − 0.38X1X2 − 0.78X1X3 − 0.66X1X4 − 0.56X1X5 − 0.74X1X6 − 0.43X2X3 − 0.60X2X5 − 1.01X3X5 − 0.45X3X6 + 2.98X4X5 − 0.39X4X6 + 2.86X5X6 + 1.37X12 + 1.02X22 − 3.47X32 − 6.67X42 − 3.59X52 − 1.16X62
| (5) |
where P is the photodegradation efficiency (%). Also, for photodegradation using HKUST-1 MOF, the following equations describe the percentage photodegradation, according to the interactions of the parameters:| | |
PMG% = 56.40 − 10.65X1 + 10.51X3 + 7.47X4 + 10.28X5 + 6.53X6 + 1.41X1X2 − 1.34X1X3 − 1.25X1X4 − 0.84X1X5 − 1.13X3X4 − 1.19X3X5 − 0.54X3X6 + 2.81X4X5 + 1.98X5X6 + 1.26X12 + 0.40X22 − 3.53X32 − 6.49X42 − 3.62X52 − 0.98X62
| (6) |
| | |
PSO% = 54.17 − 1.27X1 − 10.02X2 + 10.76X3 + 7.37X4 + 10.92X5 + 6.70X6 − 0.44X1X2 − 0.73X1X3 − 0.69X1X4 − 0.57X1X5 − 0.79X1X6 − 0.39X2X3 − 0.22X2X4 − 0.60X2X5 − 0.27X3X4 − 1.08X3X5 − 0.50X3X6 + 3.10X4X5 − 0.29X4X6 + 2.86X5X6 + 1.39X12 + 1.03X22 − 3.58X32 − 6.70X42 − 3.61X52 − 1.17X62
| (7) |
4.4. Response surface plots
The interactions of any two parameters and the relationship between them were investigated by response surface methodology and corresponding contour plots. To explain the effect of each pair of parameters on responses (percentage photodegradation of each dye), three-dimensional plots were used. Typically, the effect of MG concentration on percentage photodegradation, and the interaction based on solution flow rate (Fig. 8), show that at lower concentration, greater photodegradation efficiency will be achieved. As dye concentration increases, lower efficiency is achieved. When the dye concentration is high, the number of activated photocatalysts per molecule of color is decreased. Moreover, at high dye concentration, the solution becomes turbid, the penetration depth of light decreases and there is insufficient light distribution, which lead to less activation sites and consequently, less photocatalytic degradation. According to Fig. 8b and e, the average difference in percentage photodegradation using HKUST-1-SBA-15 is 5% more than HKUST-1. Investigations on the effect of initial SO concentration (Fig. 8c and f) show similar results to MG. The effect of rotational speed (Fig. 8c and f) on photodegradation efficiency indicates that efficiency increases with increasing rotational speed. The rotation of the packed bed creates a high centrifugal field. Under these conditions, due to micro mixing and turbulence in high bed voidage, the solution film breaks to thin layers and droplets. Therefore, by reducing the thickness of the liquid film, resistance to mass transfer decreases, and mass transfer between photocatalyst particles and dyes solution increases. Rotational speed is an important parameter in the rotating packed bed reactor due to its intensification role in mass transfer operations and operational costs. Moreover, rotational speed improves the dispersion of oxygen entrainment in the liquid film, therefore radical formation is increased. The effect of photocatalysts on the photodegradation process (Fig. 8a and d) indicates that percentage photodegradation increases with an increase in photocatalyst dosage. At higher dosage, due to an increase in surface area, more active sites are available to create more hydroxide radicals, which increase efficiency. Solution flow rate has a different effect on photodegradation efficiency. Fig. 8b and e show that at lower solution flow rates, due to maldistribution of solution in the porous bed, the efficiency is not remarkable. By increasing the flow rate, the solution exits the distributor holes as a jet stream and collides with the rotating bed with higher speed and causes the solution film to break into thin layers and droplets; therefore, a higher surface area between photocatalyst particles and dyes is created, which leads to more photodegradation. Results show that when the flow rate exceeds a certain value, efficiency decreases. This behavior is probably due to an increase in the residence time of reactants in the reactor. Increasing residence time leads to less time for activation and light exposure, and poor activation of catalyst particles. Another reason for this flow rate behavior is the creation of thick films in higher flows. At higher flow rates, the interfacial area between photocatalyst particles and pollutants decreases; under these conditions, mass transfer also decreases. Moreover, the penetration of light in thick films is short, therefore photocatalysts that are located in deep layers cannot be activated, and photodegradation percentage decreases. Typically, the effect of illumination time on photocatalytic degradation (Fig. 8a and d) indicates that higher illumination time leads to a greater percentage of photocatalytic degradation.
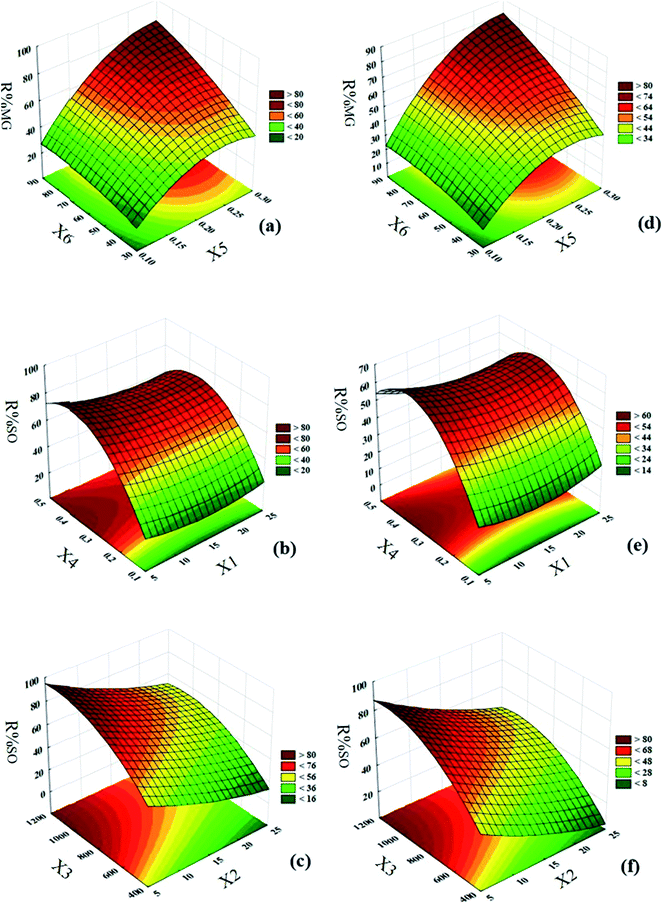 |
| | Fig. 8 Response surfaces of central composite design: (a) irradiation time-HKUST-1-SBA-15 dosage; (b) MG concentration-solution flow rate (using HKUST-1-SBA-15); (c) rotational speed-SO concentration (using HKUST-1-SBA-15); (d) irradiation time-HKUST-1 dosage; (e) MG concentration-solution flow rate (using HKUST-1); (f) rotational speed-SO concentration (using HKUST-1). | |
4.5. Optimization study
For optimization of the parameters involved in the photodegradation process, the desirability function (DF) was used based on the STATISTICA software (version. 10.0). Desirability is a function between 0 and 1, corresponding to a completely undesirable and ideal situation, respectively.22,24 The desirability close to 1 shows the desired conditions for reaching maximum photodegradation efficiency. The desirability profile for the photodegradation percentage of each dye, versus the independent parameters (Fig. 9) reveals that maximum photodegradation for MG and SO using HKUST-1-SBA-15 is 98.8% and 88.7%, respectively, with DF = 0.97. The optimum values for reaching these percentages are MG concentration of 10 mg L−1, SO concentration of 15 mg L−1, rotational speed of 900 rpm, solution flow rate of 0.4 L min−1, HKUST-1-SBA-15 dosage of 0.25 g L−1 and irradiation time of 80 min. Moreover, results show that by using HKUST-1, the maximum percentages of photodegradation for MG and SO are 98.3% and 89.1%, respectively, with DF = 0.99. However, for HKUST-1 the optimum values of independent parameters are different in some cases. Optimum values of rotational speed and irradiation time are 1000 rpm and 85 min, respectively. These values are higher than the values obtained using HKUST-1-SBA-15. Higher rotational speeds require a more powerful motor and consequently, more operational costs. Moreover, greater irradiation time increases costs due to electricity consumption and decreases the lifetime of illumination sources. Therefore, it seems that using HKUST-1-SBA-15 is economically desirable.
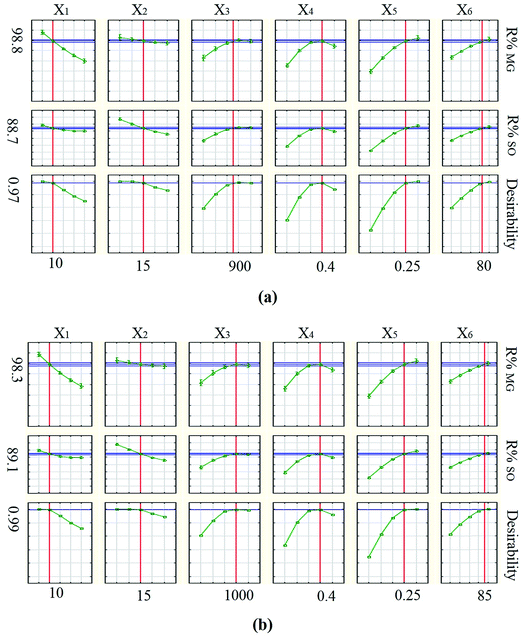 |
| | Fig. 9 Profiles of predicated values and desirability functions for photodegradation of MG and SO using: (a) HKUST-1-SBA-15 and (b) HKUST-1. | |
4.6. Kinetic study of the photodegradation process
The reaction kinetics model has an important role in the development of a photocatalytic degradation process for industrial application, because it can explain the effects of the necessary parameters on the photodegradation reaction rate, independently of the shape and configuration of the reactor. The Langmuir–Hinshelwood (L–H) kinetic model has been used for the photodegradation of many organic compounds such as dyes. This model is widely accepted to explain the kinetics of photodegradation processes.30–32 The L–H model describing pseudo-first order kinetics is shown below:| |
 | (8) |
where kobs (min−1) is the observed first-order rate constant, C is the concentration and t is the reaction time. By integration of eqn (8), a concentration–time equation is obtained:| |
 | (9) |
where C0 and Ct are the dye concentrations at time = 0 and t, respectively. Typically, ln(C0/Ct) versus time was plotted (Fig. 10a) for photodegradation of MG using HKUST-1-SBA-15. The experimental data fit well, with R2 > 0.99, which indicates that the experimental data can be described by the pseudo-first order kinetics model. The slope of this linear plot indicates the first order rate constant (kobs). By definition, the surface coverage factor (θ) explains the reaction at the solid–liquid interface between photocatalyst particles and dye solutions, and the adsorption of dyes on the photocatalyst surface can be explained by the L–H kinetic model:33| |
 | (10) |
where K and Ks are the adsorption coefficients of the dyes and the solvent, respectively; C0 and Cs are the initial concentrations of the substrate and solvent, respectively, at t = 0. The L–H kinetic rate expression was used for the description of the apparent photocatalytic degradation (R) at the catalyst surface:| |
 | (11) |
where kr (mg min−1 L−1) is the apparent photodegradation rate constant. By definition of KA (L mg−1):| |
 | (12) |
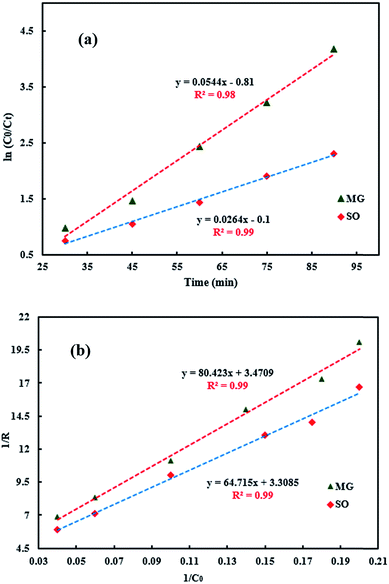 |
| | Fig. 10 Typical plots of the L–H kinetic model for MG (using HKUST-1-SBA-15). (a) ln(C0/Ct) vs. irradiation time; (b) 1/R vs. 1/C0. | |
By inserting eqn (12) in eqn (11) and rearranging, photodegradation rate changes to as follows:
| |
 | (13) |
Rearranging the eqn (13) will give the final kinetic rate equation as shown below:
| |
 | (14) |
The validity of the L–H model was determined by plotting the inverse of the initial rate against the inverse of the initial concentration of each dye. Typically, for MG photodegradation using HKUST-1-SBA-15, 1/R versus 1/C0 was plotted (Fig. 10b), which indicates that the L–H model describes the experimental data well. The rate constants and R-squared values obtained from eqn (9) and eqn (14) for each used photocatalyst are presented in Table 3. Comparison of the kinetic parameters for HKUST-1-SBA-15 and HKUST-1 indicate that these photocatalysts have different activities in the photodegradation of SO and MG. For example, for the photodegradation of MG, pseudo-first-order rate constants were obtained, of the order 0.054 (HKUST-1-SBA-15) > 0.034 (HKUST-1), which indicate that the photodegradation rates using HKUST-1-SBA-15 are greater than HKUST-1, due to their different morphological properties such as specific surface area causing different activity.
Table 3 Kinetics models and parameters
| Photocatalyst |
Kinetics parameters |
| HKUST-1-SBA-15 |
HKUST-1 |
| kobs |
R2 |
kr |
R2 |
KA |
R2 |
kobs |
R2 |
kr |
R2 |
KA |
R2 |
| MG |
0.054 |
0.98 |
0.29 |
0.99 |
0.043 |
0.99 |
0.034 |
0.99 |
0.38 |
0.99 |
0.038 |
0.99 |
| SO |
0.026 |
0.99 |
0.30 |
0.99 |
0.051 |
0.99 |
0.018 |
0.99 |
0.49 |
0.99 |
0.028 |
0.99 |
5. Conclusion
The simultaneous photocatalytic degradation of MG and SO was performed with high efficiency using a rotating packed bed reactor. HKUST-1-SBA-15 and HKUST-1 photocatalysts were synthesized and applied in the investigation of photodegradation processes under blue LED irradiation. The central composite design was applied to the optimization of process parameters and achievement of maximum efficiency. Results show that using a rotating packed bed reactor intensified the photocatalytic degradation of MG and SO significantly. The optimum values for maximum efficiency using HKUST-1-SBA-15 were obtained at MG concentration of 10 mg L−1, SO concentration of 15 mg L−1, rotational speed of 900 rpm, solution flow rate of 0.4 L min−1, HKUST-1-SBA-15 dosage of 0.25 g L−1, and irradiation time of 80 min. Under these conditions, the maximum photodegradation percentages of MG and SO obtained were 98.8% and 88.7%, respectively. Moreover, the results showed that using HKUST-1, the maximum photodegradation percentages of MG and SO obtained were 98.3% and 89.1%, respectively. Optimum values for achieving this efficiency were the rotational speed of 1000 rpm, irradiation time of 85 min MG, concentration of 10 mg L−1, SO concentration of 15 mg L−1, solution flow rate of 0.4 L min−1 and HKUST-1 dosage of 0.25 g L−1. Both of these photocatalysts have high efficiency; however, the values of rotational speed and illumination time are higher than those using HKUST-1-SBA-15. Higher rotational speed requires a more powerful motor and consequently, more operational costs. Moreover, greater irradiation time increases costs due to electricity consumption, and decreases the lifetime of the illumination sources. Therefore, it seems that using HKUST-1-SBA-15 is more desirable economically. Kinetic studies of the photodegradation process indicated that the experimental data follow a pseudo first order reaction based on the Langmuir–Hinshelwood model. Comparison of kinetic parameters for HKUST-1-SBA-15 and HKUST-1 indicate that the photodegradation rates using HKUST-1-SBA-15 are greater than HKUST-1, due to their different morphological properties such as specific surface areas that cause different activity.
Acknowledgements
The authors thanks of the Research Council of the Yasouj University and Iran National Science Foundation for financial supporting this study.
References
- M. A. Kanjwal, N. A. Barakat and I. S. Chronakis, Ceram. Int., 2015, 41, 9615–9621 CrossRef CAS
 .
. - J. Prince, F. Tzompantzi, G. Mendoza-Damián, F. Hernández-Beltrán and J. S. Valente, Appl. Catal., B, 2015, 163, 352–360 CrossRef CAS
 .
. - R. Darvishi Cheshmeh Soltani, A. Rezaee, M. Safari, A. Khataee and B. Karimi, Desalin. Water Treat., 2015, 53, 1613–1620 CrossRef CAS
 .
. - J.-J. Du, Y.-P. Yuan, J.-X. Sun, F.-M. Peng, X. Jiang, L.-G. Qiu, A.-J. Xie, Y.-H. Shen and J.-F. Zhu, J. Hazard. Mater., 2011, 190, 945–951 CrossRef CAS PubMed
 .
. - H. Wang, X. Yuan, Y. Wu, G. Zeng, X. Chen, L. Leng, Z. Wu, L. Jiang and H. Li, J. Hazard. Mater., 2015, 286, 187–194 CrossRef CAS PubMed
 .
. - D. Sun, L. Ye and Z. Li, Appl. Catal., B, 2015, 164, 428–432 CrossRef CAS
 .
. - N. Mohaghegh, M. Tasviri, E. Rahimi and M. Gholami, Appl. Surf. Sci., 2015, 351, 216–224 CrossRef CAS
 .
. - M. R. Rahimi and S. Mosleh, Adv. Environ. Sci. Technol., 2015, 1, 19–24 Search PubMed
 .
. - Y.-S. Chen, Y.-C. Hsu, C.-C. Lin, C. Y.-D. Tai and H.-S. Liu, Environ. Sci. Technol., 2008, 42, 2631–2636 CrossRef CAS PubMed
 .
. - K. Guo, Z. Zhang, H. Luo, J. Dang and Z. Qian, Ind. Eng. Chem. Res., 2014, 53, 4052–4058 CrossRef CAS
 .
. - W. Z. Jiao, Y. Z. Liu and G. S. Qi, Ind. Eng. Chem. Res., 2010, 49, 3732–3740 CrossRef CAS
 .
. - Y.-H. Chen, Y.-H. Huang, R.-H. Lin, N.-C. Shang, C.-Y. Chang, C.-C. Chang, P.-C. Chiang and C.-Y. Hu, J. Taiwan Inst. Chem. Eng., 2011, 42, 937–944 CrossRef CAS
 .
. - M. Jamshidi, M. Ghaedi, K. Dashtian and S. Hajati, RSC Adv., 2015, 5, 105789–105799 RSC
 .
. - F. N. Azad, M. Ghaedi, K. Dashtian, S. Hajati, A. Goudarzi and M. Jamshidi, New J. Chem., 2015, 39, 7998–8005 RSC
 .
. - F. N. Azad, M. Ghaedi, K. Dashtian, M. Montazerozohori, S. Hajati and E. Alipanahpour, RSC Adv., 2015, 5, 61060–61069 RSC
 .
. - M. Jamshidi, M. Ghaedi, K. Dashtian, A. Ghaedi, S. Hajati, A. Goudarzi and E. Alipanahpour, Spectrochim. Acta, Part A, 2016, 153, 257–267 CrossRef CAS PubMed
 .
. - H. Mazaheri, M. Ghaedi, S. Hajati, K. Dashtian and M. Purkait, RSC Adv., 2015, 5, 83427–83435 RSC
 .
. - S. Petrović, S. Stojadinović, L. Rožić, N. Radić, B. Grbić and R. Vasilić, Surf. Coat. Technol., 2015, 269, 250–257 CrossRef
 .
. - T. Olmez-Hanci, I. Arslan-Alaton and G. Basar, J. Hazard. Mater., 2011, 185, 193–203 CrossRef CAS PubMed
 .
. - D. Hou, R. Goei, X. Wang, P. Wang and T.-T. Lim, Appl. Catal., B, 2012, 126, 121–133 CrossRef CAS
 .
. - A. Asfaram, M. Ghaedi, S. Hajati and A. Goudarzi, RSC Adv., 2015, 5, 72300–72320 RSC
 .
. - A. Asfaram, M. Ghaedi, S. Hajati, M. Rezaeinejad, A. Goudarzi and M. K. Purkait, J. Taiwan Inst. Chem. Eng., 2015, 53, 80–91 CrossRef CAS
 .
. - E. A. Dil, M. Ghaedi, A. Asfaram and A. Goudarzi, New J. Chem., 2015, 39, 9407–9414 RSC
 .
. - M. Roosta, M. Ghaedi and A. Asfaram, RSC Adv., 2015, 5, 57021–57029 RSC
 .
. - M. N. Chong, H. Zhu and B. Jin, Chem. Eng. J., 2010, 156, 278–285 CrossRef CAS
 .
. - M. Choquette-Labbé, W. A. Shewa, J. A. Lalman and S. R. Shanmugam, Water, 2014, 6, 1785–1806 CrossRef
 .
. - G.-T. Pan, C.-M. Huang, P.-Y. Peng and T. C.-K. Yang, Catal. Today, 2011, 164, 377–383 CrossRef CAS
 .
. - Z. Zhang, W. Wang, L. Wang and S. Sun, ACS Appl. Mater. Interfaces, 2012, 4, 593–597 CAS
 .
. - M. Ghaedi, S. Hajjati, Z. Mahmudi, I. Tyagi, S. Agarwal, A. Maity and V. Gupta, Chem. Eng. J., 2015, 268, 28–37 CrossRef CAS
 .
. - N. G. Asenjo, R. Santamaría, C. Blanco, M. Granda, P. Álvarez and R. Menéndez, Carbon, 2013, 55, 62–69 CrossRef CAS
 .
. - M. E. Leblebici, J. Rongé, J. A. Martens, G. D. Stefanidis and T. van Gerven, Chem. Eng. J., 2015, 264, 962–970 CrossRef CAS
 .
. - J. Kasanen, J. Salstela, M. Suvanto and T. T. Pakkanen, Appl. Surf. Sci., 2011, 258, 1738–1743 CrossRef CAS
 .
. - M. Montazerozohori, M. Nasr-Esfahani and S. Joohari, Environ. Prot. Eng., 2012, 38, 45–55 CAS
 .
.
Footnote |
| † Electronic supplementary information (ESI) available. See DOI: 10.1039/c5ra24564h |
|
| This journal is © The Royal Society of Chemistry 2016 |
Click here to see how this site uses Cookies. View our privacy policy here. ![[thin space (1/6-em)]](https://www.rsc.org/images/entities/char_2009.gif) :
:![[thin space (1/6-em)]](https://www.rsc.org/images/entities/char_2009.gif) KBr ratio of 1
KBr ratio of 1![[thin space (1/6-em)]](https://www.rsc.org/images/entities/char_2009.gif) :
:![[thin space (1/6-em)]](https://www.rsc.org/images/entities/char_2009.gif) 100. DRS spectra were obtained with an Avant spectrophotometer (Avaspec-2048-TEC). Photoluminescence spectroscopy at room temperature was used to determine other optical properties of the samples (PL, Jobin Yvon Horiba HR 800UV, He–Cd laser). The surface area of the material was determined using nitrogen physisorption isotherms on a Micrometrics ASAP 2020 apparatus. Surface area was calculated using the BET method, and the pore size distribution was obtained from the desorption branch of nitrogen isotherms by means of the BJH model.
100. DRS spectra were obtained with an Avant spectrophotometer (Avaspec-2048-TEC). Photoluminescence spectroscopy at room temperature was used to determine other optical properties of the samples (PL, Jobin Yvon Horiba HR 800UV, He–Cd laser). The surface area of the material was determined using nitrogen physisorption isotherms on a Micrometrics ASAP 2020 apparatus. Surface area was calculated using the BET method, and the pore size distribution was obtained from the desorption branch of nitrogen isotherms by means of the BJH model.
![[thin space (1/6-em)]](https://www.rsc.org/images/entities/char_2009.gif) :
:![[thin space (1/6-em)]](https://www.rsc.org/images/entities/char_2009.gif) EtOH (5
EtOH (5![[thin space (1/6-em)]](https://www.rsc.org/images/entities/char_2009.gif) :
:![[thin space (1/6-em)]](https://www.rsc.org/images/entities/char_2009.gif) 1 ratio) was added to 0.05 g SBA-15 (the method for the synthesis of SBA-15 is reported in our previous study).13 The suspension was kept for 1.0 h under sonication, which guaranteed complete mixing and fast mass transfer at the solid–liquid interface. Subsequently, the mixture was transferred into a Teflon-lined stainless autoclave, sealed and heated at 140 °C for 24 h. The product was washed with DMF and ethanol and dried in the oven at 100 °C.
1 ratio) was added to 0.05 g SBA-15 (the method for the synthesis of SBA-15 is reported in our previous study).13 The suspension was kept for 1.0 h under sonication, which guaranteed complete mixing and fast mass transfer at the solid–liquid interface. Subsequently, the mixture was transferred into a Teflon-lined stainless autoclave, sealed and heated at 140 °C for 24 h. The product was washed with DMF and ethanol and dried in the oven at 100 °C.


![[double bond, length as m-dash]](https://www.rsc.org/images/entities/char_e001.gif) O symmetric and asymmetric modes. In the spectra of HKUST-1-SBA-15, the bands around 1080 cm−1 were observed, and were assigned to the stretching and bending vibrations of O–Si–O and Si–O of silanol groups from SBA-15, which are expected to be observed in the spectrum of the HKUST-1-SBA-15.
O symmetric and asymmetric modes. In the spectra of HKUST-1-SBA-15, the bands around 1080 cm−1 were observed, and were assigned to the stretching and bending vibrations of O–Si–O and Si–O of silanol groups from SBA-15, which are expected to be observed in the spectrum of the HKUST-1-SBA-15.


.
.
.
.
.
.
.
.
.
.
.
.
.
.
.
.
.
.
.
.
.
.
.
.
.
.
.
.
.
.
.
.
.


