DOI:
10.1039/D0RA10843J
(Paper)
RSC Adv., 2021,
11, 16359-16375
UV-visible light-induced photochemical synthesis of benzimidazoles by coomassie brilliant blue coated on W–ZnO@NH2 nanoparticles
Received
26th December 2020
, Accepted 17th April 2021
First published on 4th May 2021
Abstract
Heterogeneous photocatalysts proffer a promising method to actualize eco-friendly and green organic transformations. Herein, a new photochemical-based methodology is disclosed in the preparation of a wide range of benzimidazoles through condensation of o-phenylenediamine with benzyl alcohols in the air under the illumination of an HP mercury lamp in the absence of any oxidizing species catalyzed by a new photocatalyst W–ZnO@NH2–CBB. In this photocatalyst, coomassie brilliant blue (CBB) is heterogenized onto W–ZnO@NH2 to improve the surface characteristics at the molecular level and enhance the photocatalytic activity of both W–ZnO@NH2 and CBB fragments. This unprecedented heterogeneous nanocatalyst is also identified by means of XRD, FT-IR, EDS, TGA-DTG, and SEM. The impact of some influencing parameters on the synthesis route and effects on the catalytic efficacy of W–ZnO@NH2–CBB are also assessed. The appropriate products are attained for both the electron-withdrawing and electron-donating substituents in the utilized aromatic alcohols. Furthermore, preparation of benzimidazoles is demonstrated to occur mainly via a radical mechanism, which shows that reactive species such as ·O2−, OH˙ and h+ would be involved in the photocatalytic process. Stability and reusability studies also warrant good reproducibility of the nanophotocatalyst for at least five runs. Eventually, a hot filtration test proved that the nanohybrid photocatalyst is stable in the reaction medium. Using an inexpensive catalyst, UV-vis light energy and air, as a low cost and plentiful oxidant, puts this methodology in the green chemistry domain and energy-saving organic synthesis strategies. Finally, the anticancer activity of W–ZnO nanoparticles is investigated on MCF7 breast cancer cells by MTT assay. This experiment reveals that the mentioned nanoparticles have significant cytotoxicity towards the selected cell line.
1 Introduction
These days, choosing a suitable energy source for research projects is one of the significant topics of interest to the scientific community. This important challenge has led scientists to pay close attention to the main features of an acceptable energy source comprising cheapness, renewability, environmental friendliness, availability, sustainability and more. The sun as one of the infinite, clean and affordable energy sources can be chosen as an appropriate option for energy usage.1 Observing the behavior of nature in the use of solar energy to produce carbohydrates and oxygen in the biochemical processes based on oxidation–reduction reactions, leads scientists to understand that they are able to use this energy as a catalyst activator in many chemical reactions such as water-splitting reactions,2 degradation of organic pollutants,3 polymerization,4 organic synthesis5 and semiconductor chemistry.6
Amongst hetero-containing double-ring aromatic compounds, benzimidazoles are highly regarded because they are widely used in the field of agriculture,7 parasitic infections,8 anti-corrosion9 and antioxidant industries.10 Various pharmaceutical properties of these compounds are also studied in the vast majority of areas such as antimicrobial,11 antiviral,12 anticancer,13 antiprotozoal,14 antitubercular,15 anti-inflammatory16 and anti-analgesic.17 Because of the wide range of benzimidazoles' applications, the preparation of these critical compounds has received special consideration in the past two decades. Expanding simple and ecological trends or techniques to extensively attain organic materials from easily accessible chemicals is another main subject in the chemical communities. There are several common procedures for the synthesis of benzimidazoles and 2-substituted benzimidazoles from the reaction of o-phenylenediamine with different reagents, such as aromatic aldehydes,18 acid anhydrides,19 amides, acid chlorides,20 esters and nitriles.21 Although preparation of benzimidazoles via the in situ oxidation of benzylic alcohols in the presence of diamines is previously reported, however, these methods suffer from some significant drawbacks such as lengthy reaction time, usage of O2 as oxidant, production of stoichiometric quantities of wastes, using toxic reagents, poor yield, toxic solvents, and so on.22,23 Nowadays, seeking synthetic routes to prepare benzimidazoles under greener conditions is of great importance because of the wide application of these compounds in life.
The other important and common factor in all methods disclosed for the preparation of benzimidazoles is due to the existence of a suitable catalyst. So far, various catalysts have been used to synthesize these compounds such as magnetic catalysts,24 porous materials,25 metal–organic frameworks,26 ionic liquids,27 heavy metal oxides,28 graphene oxide29 and so on. By consideration of all the existing literature, we wish to disclose a new heterogeneous photocatalyst in the preparation of 2-substituted benzimidazoles by the reaction of some substituted o-substituted anilines with benzyl alcohols in the presence of air, as the source of oxidizing agent, under the photocatalytic conditions (Scheme 1). The impact of solvent, temperature, and source of the illumination are investigated here. Further, different electron-donating/withdrawing substituents on the phenyl ring of benzyl alcohol as well as some substituted anilines are also tested in this report. In addition, some familiar radical and hole scavengers are studied in the present protocol to confirm that the reactive species such as ·O2−, OH˙ and h+ are responsible to the present photocatalytic process. Stability and reusability studies are also investigated via hot filtration test to warranty reproducibility of the photocatalytic route.
 |
| | Scheme 1 The schematic diagram for the synthesis of benzimidazoles in the presence of W–ZnO@NH2–CBB nanophotocatalyst. | |
2 Experimental
2.1 Materials and methods
All chemicals were purchased from Sigma-Aldrich, Fluka and Merck and applied as received without any further purification. A high-pressure mercury lamp (400 W, NARVA, Berlin) with a nominal voltage of 230 V, lamp-operating current 3.25 A and optical power of 80 W was applied for the photocatalytic tests. A Mira 3-MU field emission scanning electron microscopy (FESEM) was used to investigate morphology of the synthesized nanomaterial. FT-IR spectra were recorded with KBr pellets at room temperature at the range of 400–4000 cm−1 using a Shimadzu 8700 Fourier transform spectrophotometer. 1H- and 13C-NMR spectra were recorded on a 300 MHz Bruker AVANCEC III spectrometer in DMSO-d6 using TMS as the internal reference. A DMAX-2500, Rigaku X-ray diffractometer (with Cu Kα radiation in the 2θ domain at 30 mA and 40 keV with the scanning rate of 3° min−1 from 5° to 80°) was used to obtain the X-ray diffraction (XRD) patterns. Thermogravimetric analysis was carried out by a TGA 92 Setaram at 10 °C min−1. UV-visible spectra were recorded with a Photonix UV-visible array spectrophotometer. The surface area and pore distribution of nanocomposite were determined by a BET surface area analyzer (Belsorp mini2, Japan).
2.2 Synthesis of photocatalyst
2.2.1 Preparation of W–ZnO nanoparticles. W–ZnO was synthesized via a modified method.30 35 mL NaOH (4 M) was added drop-wise into a mixture of sodium tungstate (2.5 mL, 0.5 M) and zinc acetate dihydrate (22 mL, 1 M) in water. The obtained suspension was stirred at room temperature to form the precursor and after 3 h, the suspension was delivered to a 250 mL ground-glass stopped conical flask, diluted with deionized water up to the mark-line and heated for 10 h at 95 °C. The produced precipitate was gathered, washed with deionized water and dried at ambient temperature in air.
2.2.2 Functionalization of W–ZnO nanoparticles with 3-(triethoxysilyl)propylamine (W–ZnO@NH2). At first, 0.85 g of W–ZnO nanoparticles well dispersed in 60 mL anhydrous toluene under ultrasonic. Then, the mixture was refluxed for 24 h after addition of 1.6 mL 3-(triethoxysilyl)propylamine. Finally, the deposited precipitate was collected and dried in an oven at 60 °C for 12 h.
2.2.3 Functionalization of W–ZnO@NH2 nanoparticles with various photosensitizers. The well-known wet impregnation strategy was used to synthesize W–ZnO@NH2– (photosensitizer) nanoparticles. Therefore, a general route is demonstrated for all photosensitizers as follows. At first, 0.02 g of each photosensitizer was dissolved in THF (20 mL), then, 0.5 g of WZnO–NH2 nanoparticles was gradually added to this solution during 12 h in a dark place. Eventually, the obtained precipitate was dried at 80 °C for 24 h under air. All photosensitizers in Fig. 8a were functionalized with this method on WZnO–NH2 nanoparticles.
2.3 A general route for the synthesis of benzimidazoles from benzyl alcohols and o-phenylenediamines
A mixture of W–ZnO@NH2–CBB nanocomposite (0.02 g) as photcatalyst, benzyl alcohol (1.0 mmol) and o-phenylenediamine (1.2 mmol) in ethanol (10 mL) was stirred at room temperature. Thereafter, the reaction mixture was exposed to the HP mercury light under mild air bubbling (1 mL min−1) with stirring and progress of the reaction followed by TLC. After completion, the nanophotocatalyst was separated from the reaction mixture and the yellow product was attained after addition of ice water. The precipitated product was re-crystallized in ethanol to provide the pure product.
2.4 Spectral NMR data of the prepared benzimidazoles, benzothiazoles and benzoxazoles
Table 3, entry 1. 1H NMR (300 MHz, DMSO-d6); δ 7.19–7.22 (m, 3H), 7.57–7.60 (m, 2H), 7.64–7.67 (m, 2H), 8.19–8.21 (d, 2H), 13.07 (brs, 1H, NH) ppm; 13C NMR (75 MHz, DMSO-d6); δ 115.62, 122.64, 126.63, 127.05, 129.39, 129.54, 129.59, 130.45, 137.42, 143.14, 151.83 ppm.
Table 3, entry 2. 1H NMR (300 MHz, DMSO-d6); δ 2.36 (s, 3H), 7.18–7.21 (m, 2H), 7.35–7.37 (d, 2H), 7.60–7.69 (m, 2H), 8.11–8.14 (d, 2H), 12.79 (s, 1H, NH) ppm; 13C NMR (75 MHz, DMSO-d6); δ 21.37, 111.49, 119.26, 122.12, 122.83, 126.93, 128.04, 130.07, 135.62, 140.31, 144.41, 151.98 ppm.
Table 3, entry 3. 1H NMR (300 MHz, DMSO-d6); δ 7.21–7.24 (m, 2H), 7.49–7.55 (m, 2H), 7.67–7.70 (m, 2H), 8.23–8.27 (d, 1H), 8.39 (s, 1H), 13.21 (brs, 1H, NH) ppm; 13C NMR (75 MHz, DMSO-d6); δ 112.16, 119.71, 122.69, 122.92, 123.57, 123.88, 126.05, 129.56, 131.83, 133.04, 135.67, 144.70, 150.63 ppm.
Table 3, entry 4. 1H NMR (300 MHz, DMSO-d6); δ 7.24–7.28 (m, 2H), 7.59–7.69 (m, 4H), 8.20–8.23 (m, 1H), 8.25–8.29 (m, 1H), 12.81 (brs, 1H, NH) ppm; 13C NMR (75 MHz, DMSO-d6); δ 112.12, 119.71, 122.63, 123.47, 123.98, 129.13, 130.21, 132.84, 135.94, 145.03, 151.16 ppm.
Table 3, entry 5. 1H NMR (300 MHz, DMSO-d6); δ 7.35–7.37 (m, 2H), 7.41–7.44 (m, 2H), 7.49–7.52 (m, 1H), 7.74–7.76 (m, 2H), 8.45–8.47 (m, 1H), 10.51 (brs, 1H, NH) ppm. 13C NMR (75 MHz, DMSO-d6); δ 123.11, 127.93, 130.16, 130.83, 131.46, 131.89, 132.57, 150.01 ppm.
Table 3, entry 6. 1H NMR (300 MHz, DMSO-d6); δ 7.22–7.25 (m, 2H), 7.60–7.62 (m, 2H), 7.63–7.66 (m, 1H), 7.70–7.72 (m, 1H), 8.21–8.23 (m, 1H), 8.27–8.29 (m, 1H), 13.21 (brs, 1H, NH) ppm; 13C NMR (75 MHz, DMSO-d6); δ 111.93, 119.61, 122.58, 123.42, 125.49, 126.55, 129.87, 131.60, 132.72, 134.34, 135.53, 144.67, 151.01 ppm.
Table 3, entry 7. 1H NMR (300 MHz, DMSO-d6); δ 7.24–7.30 (m, 2H), 7.56–7.59 (d, 2H), 7.67–7.72 (m, 3H), 8.21–8.25 (d, 2H), 13.05 (s, 1H, NH) ppm; 13C NMR (75 MHz, DMSO-d6); δ 112.08, 119.62, 122.73, 123.63, 128.99, 129.85, 129.67, 135.17, 135.79, 144.49, 150.96 ppm.
Table 3, entry 8. 1H NMR (300 MHz, DMSO-d6); δ 7.21–7.25 (m, 2H), 7.57–7.60 (m, 2H), 7.59–7.65 (m, 1H), 8.20–8.23 (m, 1H), 8.21–8.25 (m, 1H), 13.12 (brs, 1H, NH) ppm; 13C NMR (75 MHz, DMSO-d6); δ 112.31, 119.89, 122.38, 123.42, 128.99, 129.13, 131.53, 132.99, 134.73, 135.75, 143.79, 143.92, 147.54 ppm.
Table 3, entry 9. 1H NMR (300 MHz, DMSO-d6); δ 7.27–7.31 (m, 2H), 7.60–7.62 (m, 1H), 7.69–7.72 (m, 1H), 7.77–7.81 (m, 1H), 7.87–7.93 (t, 1H), 8.92–8.09 (m, 2H), 13.12 (s, 1H, NH) ppm; 13C NMR (75 MHz, DMSO-d6); δ 112.34, 122.41, 123.65, 124.87, 124.91, 131.39, 131.43, 131.49, 133.35, 135.45, 144.31, 147.95, 149.86 ppm.
Table 3, entry 10. 1H NMR (300 MHz, DMSO-d6); δ 7.31 (s, 2H), 7.65–7.69 (m, 2H), 8.39–8.43 (m, 4H), 13.47 (s, 1H) ppm; 13C NMR (75 MHz, DMSO-d6); δ 124.85, 128.03, 136.69, 148.90, 150.01 ppm.
Table 3, entry 11. 1H NMR (300 MHz, DMSO-d6); δ 7.31–7.34 (d, 2H), 7.64–7.69 (d, 2H), 8.38–8.45 (m, 4H), 13.32 (s, 1H, NH) ppm; 13C NMR (75 MHz, DMSO-d6); δ 112.31, 120.21, 122.97, 124.38, 124.88, 128.08, 135.76, 136.74, 144.63, 148.57, 149.59 ppm.
Table 3, entry 12. 1H NMR (300 MHz, DMSO-d6); δ 7.26–7.31 (m, 2H), 7.67–7.69 (m, 2H), 8.13–8.17 (d, 2H), 8.30–8.33 (d, 2H), 13.21 (brs, 2H, NH, OH) ppm; 13C NMR (75 MHz, DMSO-d6); δ 123.28, 127.15, 130.81, 132.55, 134.84, 150.96, 167.73 ppm.
Table 3, entry 13. 1H NMR (300 MHz, DMSO-d6); δ 6.78–6.83 (m, 1H), 6.98–7.01 (m, 1H), 7.19–7.23 (m, 1H), 7.45–7.47 (m, 1H), 7.58–7.62 (m, 4H), 8.12–8.14 (m, 2H), 8.76 (s, 1H), 8.80–8.82 (m, 2H), 9.87 (s, 1H, NH) ppm; 13C NMR (75 MHz, DMSO-d6); δ 115.65, 117.43, 118.19, 118.18, 121.34, 122.89, 125.45, 126.12, 127.76, 128.58, 128.64, 129.17, 129.46, 130.59, 131.35, 131.63, 135.63, 137.82, 144.59, 145.99, 156.68 ppm.
Table 3, entry 14. 1H NMR (300 MHz, DMSO-d6); δ 7.29 (s, 2H), 7.66–7.72 (m, 4H), 8.24–7.26 (m, 2H), 13.04 (s, 1H, NH) ppm; 13C NMR (75 MHz, DMSO-d6); δ 111.93, 119.61, 122.56, 123.48, 128.69, 128.91, 129.53, 129.73, 131.69, 135.14, 135.74, 144.64, 150.89 ppm.
Table 3, entry 15. 1H NMR (300 MHz, DMSO-d6); δ 7.41 (t, J = 7.6 Hz, 1H), 7.62 (p, J = 4.1 Hz, 4H), 8.01 (d, J = 8.0 Hz, 1H), 8.10–8.13 (m, 3H) ppm; 13C NMR (75 MHz, DMSO-d6); δ 121.78, 123.64, 125.62, 126.79, 127.93, 129.37, 131.19, 133.66, 135.17, 154.21, 168.54 ppm.
Table 3, entry 16. 1H NMR (300 MHz, DMSO-d6); δ 7.40–7.43 (m, 1H), 7.46–7.49 (m, 2H), 7.51 (ddd, J = 8.2, 7.1, 1.2 Hz, 1H), 7.94 (dd, J = 8.0, 1.1 Hz, 1H), 8.03–8.05 (m, 2H), 8.08 (d, J = 8.2 Hz, 1H) ppm; 13C NMR (75 MHz, DMSO-d6); δ 121.79, 123.41, 125.54, 126.67, 128.97, 129.46, 131.99, 135.19, 137.25, 154.28, 166.86 ppm.
Table 3, entry 17. 1H NMR (300 MHz, DMSO-d6); δ 7.38 (dd, J = 6.0, 3.1 Hz, 2H), 7.57 (d, J = 7.0 Hz, 3H), 7.61–7.64 (m, 1H), 7.81–7.85 (m, 1H), 8.33 (d, J = 6.3 Hz, 2H) ppm; 13C NMR (75 MHz, DMSO-d6); δ 110.01, 119.16, 123.76, 124.33, 126.31, 126.98, 128.10, 130.78, 141.21, 149.95, 162.26 ppm.
Table 3, entry 18. 1H NMR (300 MHz, DMSO-d6); δ 7.34–7.36 (m, 2H), 7.52 (d, J = 8.5 Hz, 2H), 7.57–7.59 (m, 1H), 7.75–7.79 (m, 1H), 8.21 (d, J = 8.5 Hz, 2H) ppm; 13C NMR (75 MHz, DMSO-d6); δ 110.76, 120.27, 124.91, 125.45, 125.89, 129.06, 129.45, 138.12, 142.26, 150.99, 162.30 ppm.
3 Results and discussion
3.1 Structural identification of W–ZnO@NH2–CBB
As carefully described in the experimental section, W–ZnO nanoparticles were synthesized via drop-wise NaOH adding into a mixture of sodium tungstate and zinc acetate dihydrate in water. Then, the prepared nanoparticles were functionalized with n-propylamine and, eventually, CBB was anchored onto the surface of the functionalized W–ZnO@NH2 in THF. The resulting nanomaterial was characterized by means of various techniques including FT-IR, FESEM, TGA, and XRD as follows.
3.1.1 FT-IR. FT-IR spectroscopy was used to recognize the successful loading of CBB onto W–ZnO@NH2 (Fig. 1). In the FT-IR spectrum of CBB (Fig. 1b), the absorption peaks are related to different functional vibrations including aliphatic chains, aromatic rings, –NH, –SO3H and –SO3−. The broadband between 3600-3100 cm−1 is attributed to the O–H vibration of the –SO3H group and NH of the secondary amine.31 The bands at 2912 and 2850 cm−1 correspond to the C–H stretching of the alkyl chains. The C–N stretching vibration of the tertiary amine was approved by the peak at 2233 cm−1. The aromatic skeletal vibrations are observed at 1575 cm−1. The band at 1512 cm−1 is due to the bending CH2 vibration. The band at 1338 cm−1 could be due to the stretching of SO3H group.31 The peak at 1029 cm−1 is due to the S![[double bond, length as m-dash]](https://www.rsc.org/images/entities/char_e001.gif) O stretching in the SO3H group. The FT-IR spectrum of W–ZnO@NH2–CBB (Fig. 1c) showed that loading of CBB on W–ZnO@NH2 has not altered the main IR bands of CBB. In the FT-IR of W–ZnO@NH2–CBB, two peaks at 673 and 578 cm−1 are related to the presence of W–O and Zn–O, respectively.32,33
O stretching in the SO3H group. The FT-IR spectrum of W–ZnO@NH2–CBB (Fig. 1c) showed that loading of CBB on W–ZnO@NH2 has not altered the main IR bands of CBB. In the FT-IR of W–ZnO@NH2–CBB, two peaks at 673 and 578 cm−1 are related to the presence of W–O and Zn–O, respectively.32,33
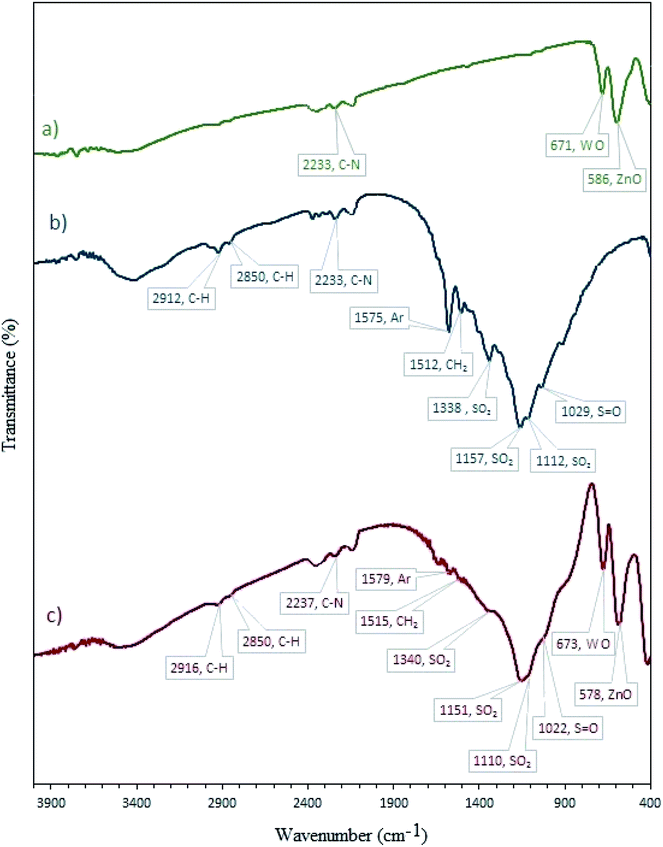 |
| | Fig. 1 FT-IR spectra of (a) W–ZnO@NH2, (b) CBB and (c) W–ZnO@NH2–CBB. | |
3.1.2 FESEM images. FESEM is a powerful technique to describe the morphological features of the synthesized compounds. FESEM images of W–ZnO@NH2 and W–ZnO@NH2–CBB nanoparticles are, respectively, shown in Fig. 2a and b. It is well recognizable that the nanocatalyst particles have a dimension of about 46–54 nm and there is a little agglomeration. Moreover, the FE-SEM map pictures of W–ZnO@NH2–CBB are also presented to show the distribution of tungsten, zinc, oxygen and nitrogen (Fig. 3). As seen in these pictures, the presence and steady distribution of these elements is well demonstrated in the nanocatalyst particles.
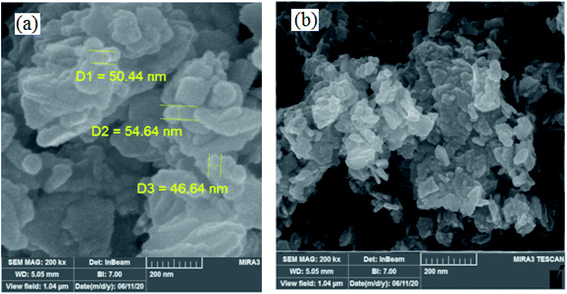 |
| | Fig. 2 FESEM images of (a) W–ZnO@NH2 and (b) W–ZnO@NH2–CBB. | |
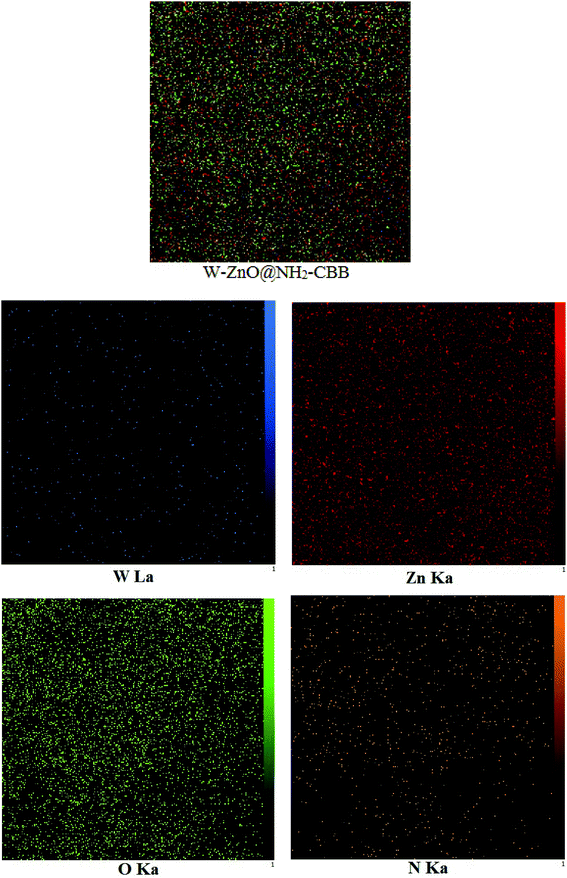 |
| | Fig. 3 The FE-SEM map pictures of W–ZnO@NH2–CBB. | |
The EDS analysis of W–ZnO showed the W content of about 4.4 at% in the prepared composite, which approves the semiquantitative amount of 5 mol% WO3 in the composite based on the amount of used Na2WO4. However, less W found in W–ZnO composite than that provided in the precursor solution confirmed that part of the W element would be remained in the mother liquor.30
3.1.3 Thermo-gravimetric analysis. TGA curve of W–ZnO@NH2–CBB nanoparticles at the temperature range of 0 to 600 °C is shown in Fig. 4. The TGA profile describes the thermal stability of the sample and the amount of chemical adsorption of the synthesized compound. Initial ascending behavior in the TGA curve of W–ZnO@NH2–CBB between 22–76 °C can be explained as the consequence of the buoyancy effect of the instrument. This effect has been reported in other studies and it has been stated that the initial increase in weight is due to the difference in the heat capacity and thermal conductivity of the applied purging gas.34 The first weight-loss between 176 and 384 °C is due to the loss of COOH groups on CBB.35 The second weight-loss between 384 °C and 568 °C is assigned to the elimination of n-propylamine.
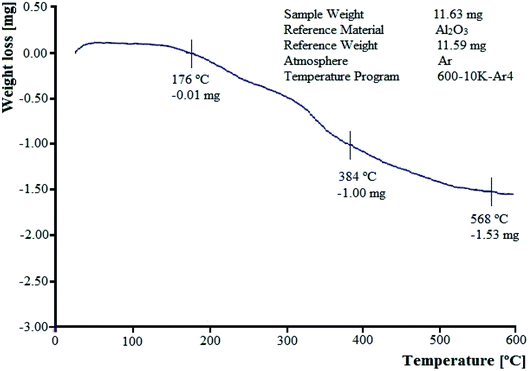 |
| | Fig. 4 TGA profile of W–ZnO@NH2–CBB nanocomposite. | |
3.1.4 XRD. The XRD patterns of the standard ZnO and W–ZnO@NH2–CBB nanoparticles are shown in Fig. 5. The sharp peaks at the 2θ of 77.52°, 73.20°, 69.62°, 68.52°, 66.91°, 63.4°, 57.11°, 48.10°, 36.84°, 35.00°and 32.30° are the corresponding peaks of (202), (004), (201), (112), (200), (103), (110), (102), (101), (002) and (100) miller indices, respectively, which agree with the standard XRD pattern of ZnO.36 The half-value crystallite scale can be calculated by using the XRD data in the Debye–Scherrer formula, which confirmed the value of about 48 nm, in accord with the FESEM analysis. There was no detectable diffraction due to the presence of doped WO3 in the XRD pattern, which could be attributed to the too low concentration and/or amorphous structure of the dopant.37,38 However, the existence of W was obviously confirmed by the FESEM map pictures of W–ZnO@NH2–CBB in Fig. 3.
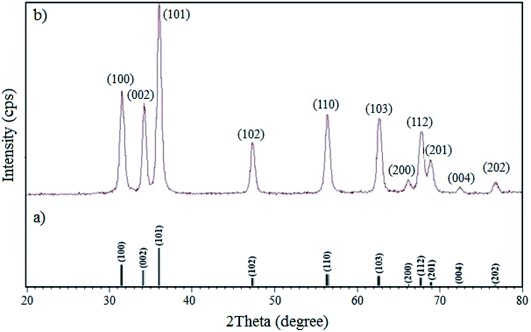 |
| | Fig. 5 XRD patterns of (a) simulated standard ZnO and (b) real W–ZnO@NH2–CBB. | |
3.1.5 BET. The surface area and pore distribution of W–ZnO nanocomposite were monitored using nitrogen adsorption–desorption isotherm at 77 K (Fig. 6a). According to previous reports, the specific surface area of W–ZnO is greater than that of pure ZnO, mainly due to the reduction of ZnO crystallite size in the presence of WO3.39 However, the increase of surface area is beneficial to the photocatalytic activity of ZnO. The corresponding isotherm exhibited an increase at a relatively low pressure (P/P0 < 0.1), resembling the main characteristics of a porous structure.40 It seems that W–ZnO nanocomposite obeys a typical type-IV isotherm with a hysteresis loop in the range of P/P0 ∼ 0.7–0.9. However, observation of a high adsorption capacity at a relatively high pressure (P/P0 > 0.8) suggests the coexistence of meso- and macro-pores.41 The pore size distribution of W–ZnO was calculated by the BJH method in the range of 1–100 nm (Fig. 6b). This study indicated a relatively wide distributed pore structure. The textural properties of W–ZnO including the BET surface area, micropore volume, and total pore volume are summarized in Table 1.
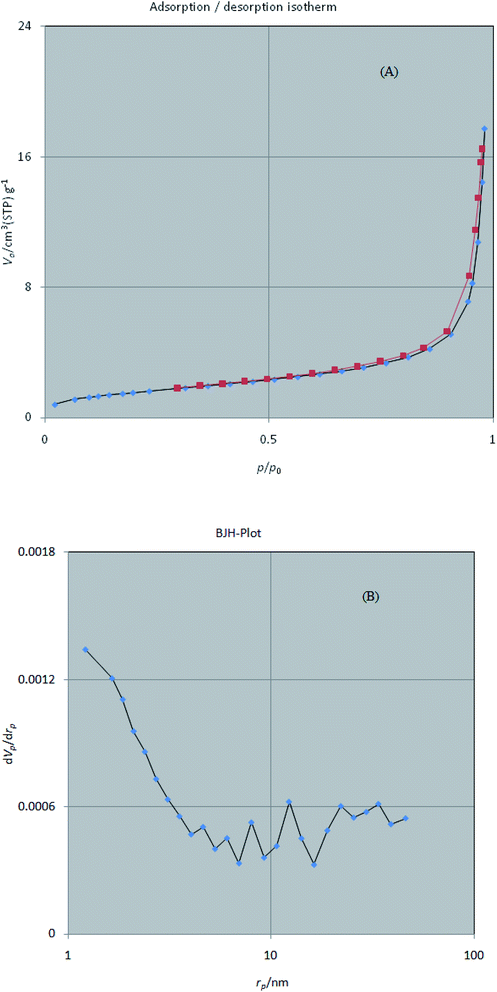 |
| | Fig. 6 N2 adsorption–desorption isotherms (A) and pore size distribution according to the BJH method (B) for W–ZnO nanocomposite. | |
Table 1 Textural properties of pure ZnO and W–ZnOa
| Sample |
SBET (m2 g−1) |
Vtotal (cm3 g−1) |
rp (nm) |
| SBET: BET surface area; Vtotal: total pore volume; rp: average pore diameter. |
| ZnO |
10.7 |
0.134 |
47.2 |
| W–ZnO |
12.4 |
0.155 |
29.3 |
3.1.6 Optical band-gap analysis. Optical band-gap analysis was performed to evaluate the band-gap of W–ZnO@NH2–CBB in comparison with W–ZnO. The optical band-gaps of these two samples were estimated using the Tauc plot based on extrapolation of the linear slope to photon energy (Fig. 7). The calculated band-gap energy of W–ZnO@NH2–CBB and W–ZnO was found to be 2.9 and 3.5 eV, respectively. This study obviously showed that surface modification and grafting of CBB on the surface of W–ZnO reduced the band-gap 0.6 eV, therefore, increased the photocatalytic efficacy of the heterogeneous catalyst.
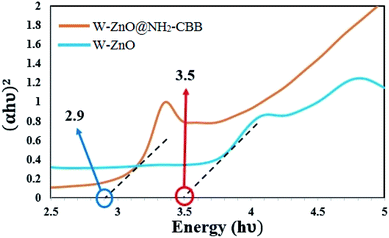 |
| | Fig. 7 Optical band-gap analysis of W–ZnO@NH2–CBB and W–ZnO. | |
3.2 Photocatalytic tests
To study the photocatalytic activity of W–ZnO@NH2–CBB, the pre-determined amount of benzyl alcohol was reacted with o-phenylenediamines in ethanol in the presence of the nanocomposite photocatalyst at room temperature and under the irradiation of an HP-Hg lamp to produce the desired benzimidazole. To define the best conditions for this reaction, we optimized various parameters such as type and amount of photocatalyst, reaction time, irradiation source and ratio of W–ZnO@NH2 to CBB.
3.2.1 Studying efficacy of different photocatalysts. At first, the effect of various photocatalysts was examined on the reaction efficiency (Fig. 8). This reaction was performed at room temperature in open air. In the presence of photocatalyst and after 2 h, coomassie brilliant blue (CBB) produced the highest yield. The significant high yield% in the presence of CBB confirmed that this organic photosensitizer is the best choice to be functionalized onto W–ZnO@NH2 nanoparticles. In the following, the model reaction was also carried out in the absence of photocatalyst and in the presence of several other organic and/or inorganic photosensitizers (Fig. 8a and b). As can be seen, W–ZnO@NH2–CBB showed the best photocatalytic efficiency (95% product after 2 h).
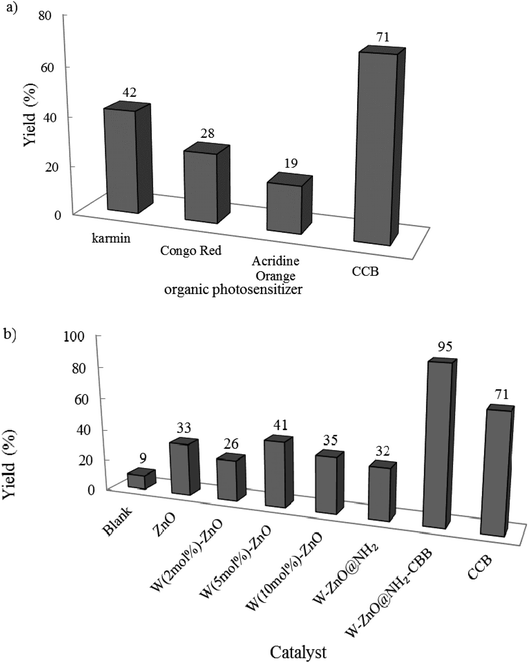 |
| | Fig. 8 Effect of different photocatalysts on the reaction progress. Benzyl alcohol and o-phenylenediamine selected as the starting materials and reactions were performed under an open atmosphere at room temperature in ethanol (10 mL) using an HP-Hg lamp for 2 h. 0.02 g of photocatalyst was used in all cases. | |
Although our literature survey showed that W (5 mol%) ZnO is revealed the best photocatalytic activity in the photodegradation of some drugs and synthetic colors, however, its photocatalytic activity was compared with 2 and 10 mol% W in W–ZnO. According to Fig. 8b, 2, 5, and 10 mol% W in ZnO gave rise to 26, 41, and 35% yield at the same reaction conditions, respectively. Previous reports show that enhancing WO3 content suppresses the recombination of the photo-generated electrons and holes.30,42,43 Therefore, W (5 mol%)ZnO was chosen as the best nanoadsorbent and used to functionalize CBB to attain the target nanophotocatalyst.
3.2.2 Effect of photocatalyst amount and reaction time on the reaction progress. The model reaction was carried out in the absence and presence of W–ZnO@NH2–CBB with different amounts to explore the optimum time and photocatalyst amount required to acquire the maximum yield. The best result was obtained with 0.02 g of photocatalyst after 2 h and neither an increase in the reaction time more than 2 h nor an increase in the amount of photocatalyst greater than 0.02 g affected significantly the reaction efficiency (Fig. 9 and 10). Although there is only a low difference in the yield% (95% compared to 91% in Fig. 9), however, we used the optimum amount of 0.02 photocatalyst in all cases because we realized that the experiments are more repeatable in this case.
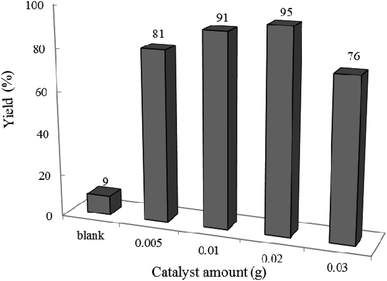 |
| | Fig. 9 Effect of photocatalyst amount on the efficiency of condensation reaction of benzyl alcohol with ortho-phenylenediamine at 25 °C in ethanol (10 mL) under air and UV-vis irradiation for 2 h. | |
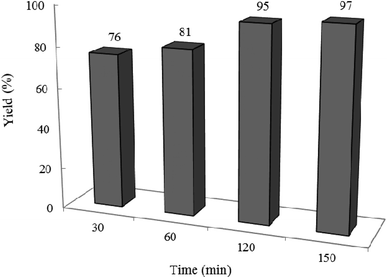 |
| | Fig. 10 Effect of reaction time on the yield%. Reaction conditions are similar to that in the caption of Fig. 8. 0.02 g of photocatalyst was used in all cases. | |
3.2.3 Effect of W–ZnO@NH2![[thin space (1/6-em)]](https://www.rsc.org/images/entities/b_char_2009.gif) :
:![[thin space (1/6-em)]](https://www.rsc.org/images/entities/b_char_2009.gif) CBB ratio on the reaction progress. As expected, the ratio of W–ZnO@NH2 to CBB strongly affected the efficiency of the condensation reaction. Therefore, a model reaction was planned in the presence of 0.02 g of nanocomposite composed of different amounts of CBB ranging from 0.25–3 for W–ZnO@NH2
CBB ratio on the reaction progress. As expected, the ratio of W–ZnO@NH2 to CBB strongly affected the efficiency of the condensation reaction. Therefore, a model reaction was planned in the presence of 0.02 g of nanocomposite composed of different amounts of CBB ranging from 0.25–3 for W–ZnO@NH2![[thin space (1/6-em)]](https://www.rsc.org/images/entities/char_2009.gif) :
:![[thin space (1/6-em)]](https://www.rsc.org/images/entities/char_2009.gif) CBB ratio (Fig. 11). The obtained results revealed that 1
CBB ratio (Fig. 11). The obtained results revealed that 1![[thin space (1/6-em)]](https://www.rsc.org/images/entities/char_2009.gif) :
:![[thin space (1/6-em)]](https://www.rsc.org/images/entities/char_2009.gif) 1 ratio has been the best and efficiency of the photocatalyst was decreased with further enhancing the CBB amount, maybe due to the enhanced scattering and decreased penetration depth of the incident light.44,45 Furthermore, decreasing the photocatalyst efficacy with the higher amounts of CBB would be due to masking of W–ZnO surface with this material, which effectively alleviated efficacy of W–ZnO@NH2–CBB.
1 ratio has been the best and efficiency of the photocatalyst was decreased with further enhancing the CBB amount, maybe due to the enhanced scattering and decreased penetration depth of the incident light.44,45 Furthermore, decreasing the photocatalyst efficacy with the higher amounts of CBB would be due to masking of W–ZnO surface with this material, which effectively alleviated efficacy of W–ZnO@NH2–CBB.
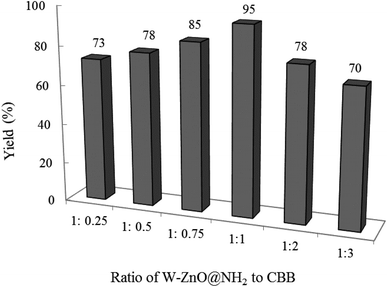 |
| | Fig. 11 Effect of W–ZnO@NH2![[thin space (1/6-em)]](https://www.rsc.org/images/entities/char_2009.gif) : :![[thin space (1/6-em)]](https://www.rsc.org/images/entities/char_2009.gif) CBB ratio on the efficacy of condensation reaction. Reaction condition is similar to that in the caption of Fig. 8. Reaction time was 2 h. 0.02 g of photocatalyst was used in all cases. CBB ratio on the efficacy of condensation reaction. Reaction condition is similar to that in the caption of Fig. 8. Reaction time was 2 h. 0.02 g of photocatalyst was used in all cases. | |
3.2.4 Effect of irradiation source on the reaction progress. The light source is another influencing factor, which strongly affects the reaction efficiency. The model reaction was exposed to different light irradiations, and the results are given in Table 2. According to the attained results, the best efficiency has been achieved with the HP-Hg lamp. Although, xenon light has a high power and intensity in the spectral region of 820–980 nm, however, it showed low activity and about 41% yield was attained. All performed LEDs provided comparable 20–29% yields. In the case of white LED, enhancing power from 20 to 50 W increased yield% from 25 to 29%, thus, light intensity contributed to the photocatalytic efficacy. For both green and red LEDs, yields are very similar apart from different emission spectrum. It should be noted that although emission intensity is an important parameter, however, the existing literature and our recent results on other multi-component condensation reactions show that these types of LEDs (2.5 W) are typically effective, as will be published soon.46,47
Table 2 Effect of the light source on the reaction progressa
| Entry |
Light source |
Maximum emission lines (nm) |
Commercial specification |
Photocatalyst amount (g) |
Yield (%) |
| 0.01 g of W–ZnO@NH2–CBB photocatalyst was added to a mixture of benzyl alcohol (1 mmol) and ortho-phenylenediamine (0.08 g, 1.2 mmol) in 10 mL ethanol for 2 h. |
| 1 |
HP-Hg |
200–450, 530–580 |
200 W |
0.01 |
91 |
| 2 |
Xenon |
820–980 |
1000 W |
0.01 |
41 |
| 3 |
White LED |
400–700 |
50 W |
0.01 |
29 |
| 4 |
White LED |
400–700 |
20 × 1 W |
0.01 |
25 |
| 5 |
Green LED |
500–550 |
2.5 W |
0.01 |
20 |
| 6 |
Red LED |
600–650 |
2.5 W |
0.01 |
22 |
| 7 |
Sun light |
250–1000 |
— |
0.01 |
15 |
| 8 |
— |
— |
— |
0.01 |
6 |
3.2.5 Effect of different solvents on the reaction progress. To determine the best solvent for the reaction, we designed the condensation reaction of W–ZnO@NH2–CBB nanocomposite (0.02 g) as photcatalyst, benzyl alcohol (1 mmol) and o-phenylenediamine (1.2 mmol) in the selected solvent (10 mL) at room temperature for 2 h. As can be seen in Fig. 12, ethanol was the best choice between the utilized solvents.
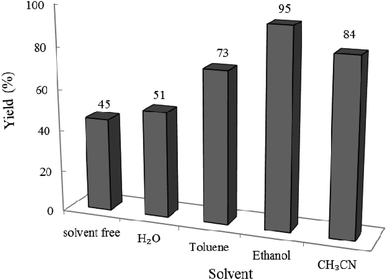 |
| | Fig. 12 Effect of solvent on the efficacy of condensation reaction at 25 °C in 10 mL solvent under air and UV-vis irradiation. Reaction time was 2 h. 0.02 g of photocatalyst was used in all cases. | |
3.2.6 Effect of different temperatures on the reaction progress. In another attempt, the impact of reaction temperature was studied on the standard condensation reaction (Fig. 13). Interestingly, yield% was only a little affected by the reaction temperature, therefore, the temperature of 25 °C was kept as the best for all runs throughout this study.
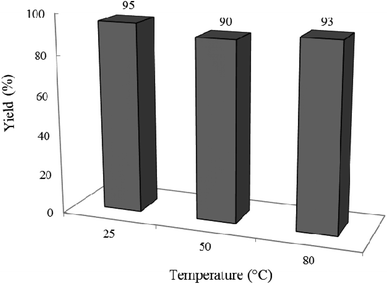 |
| | Fig. 13 Effect of temperature on the efficacy of the condensation reaction. Reaction time was 2 h in 10 mL ethanol under air and UV-vis irradiation. 0.02 g of photocatalyst was used in all cases. | |
3.2.7 Studying some hole/electron scavengers. Effect of some familiar hole and electron scavengers is investigated in the current photocatalytic reactions in the presence of W–ZnO@NH2–CBB (Fig. 14). As documented in the literature, hydroxyl radical, holes and superoxide anion-radical can contribute to the photocatalysis routes. Therefore, a number of familiar scavengers were separately studied in the present photocatalytic reaction. In the presence of isopropyl alcohol (IPA), as a hydroxyl free radical scavenger,48 yield% was decreased from 95 to 72%. In addition, a large decrease in yield% (95 to 37%) in the presence of p-benzoquinone (BQ) revealed that ·O2− would be involved in the reaction mechanism.49 Furthermore, ∼16% decrease in yield% by the presence of EDTA confirmed that h+ would also contribute to the photocatalysis reaction.50 As a result, OH˙, ·O2− and h+ are expected to be regarded as reactive species in the present photocatalytic reaction.
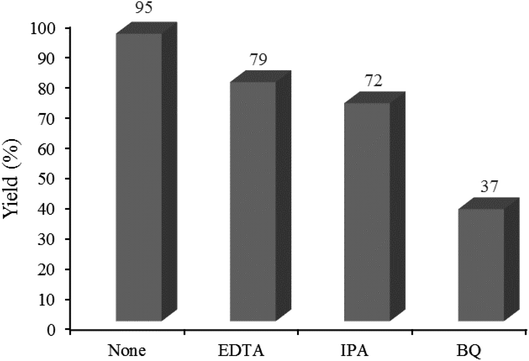 |
| | Fig. 14 Effect of some familiar scavengers on the reaction progress under the standard reaction conditions described below Table 2. 0.02 g of photocatalyst was used in all cases. | |
3.2.8 Synthesis of different benzimidazoles, benzothiazoles and benzoxazoles catalyzed by W–ZnO@NH2–CBB. In order to determine the scope of this method, some aromatic alcohols bearing electron-withdrawing and electron-donating groups were treated with o-phenylenediamine, 2-aminothiophenol and 2-aminophenol to provide the desired benzimidazoles, benzothiazoles and benzoxazoles under the optimum reaction conditions (Table 3). Most of the performed aldehydes provided good to excellent yields in a short period of time. Benzyl alcohols bearing electron withdrawing/releasing substituents successfully generated the desired products with good yields and with superior selectivity. Although most of the electron-rich and electron-poor reagents afforded the desired products in high yields, however, our experiments revealed that benzyl alcohols bearing electron-withdrawing groups react with better efficacy than those bearing electron-donating substituents.
Table 3 Synthesis of different benzimidazoles, benzothiazoles and benzoxazoles catalyzed by W–ZnO@NH2–CBBa
3.2.9 W–ZnO cytotoxicity assay. A preliminary MTT assay was applied to ascertain cytotoxicity of W–ZnO nanoparticles against breast cancer MCF7 cell line. As is well-known, the yellow MTT converts to the formazan purple salt in living cells and a buffer solution of dimethyl sulphoxide can dissolve the solid formazan to a colored form. Then, the absorbance of the colored solution can be determined via spectrophotometery at the wavelength of 550 nm. However, the absorption maxima are dependent to the nature of solvent and the cell viability% can be calculated according to the number of the total and viable cells. This experiment showed that the cell viability significantly decreases in the presence of W–ZnO nanoparticles (5–40 μg mL−1) in a dose-dependent fashion after 24 h incubation (Fig. 15). This preliminary study confirmed that the performed nanoparticles affect the cell viability and show cytotoxicity effects on MCF7 cell line.
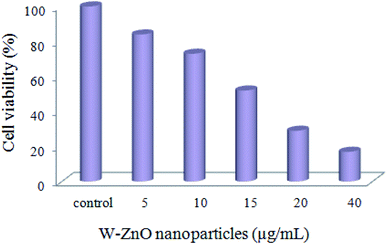 |
| | Fig. 15 MTT assay of MCF7 cells exposed to different concentrations of W–ZnO nanoparticles after 24 h. | |
3.2.10 Comparison of this protocol with the reported similar methods. We compared the gained results for the catalytic activity of W–ZnO@NH2–CBB with some similar reported catalysts in the synthesis of 2-(p-tolyl)-1H-benzo[d]imidazole in terms of yield%, catalyst amount, reaction time, temperature, solvent and other reaction conditions (Table 4). According to these data, the present method seems to be the best by consideration of the reaction time, catalyst amount, kind of solvent and reaction temperature.
Table 4 Comparison of the catalytic activity of W–ZnO@NH2–CBB with some reported catalysts in the synthesis of 2-(p-tolyl)-1H-benzo[d]imidazole
| Catalyst |
Time (h) |
Temp. (°C) |
Solvent |
Yield (%) |
Ref. |
| W–ZnO@NH2–CBB (0.02 g) |
2 |
Room temperature, UV-vis condition |
Ethanol (10 mL) |
95 |
This work |
| Ir/TiO2 (2.0 wt%) |
18 |
120 °C under Ar |
— |
87 |
51 |
| TiO2/AA/Co (0.06 mol%) |
3 |
70 °C under air, visible-light |
— |
83 |
52 |
| Co(II)–TD@TiO2 (2 mol%) |
3 |
80 °C, visible-light, O2 (5–7 mL min−1) |
— |
79 |
53 |
| Mo72V30 (0.05 mol%) in combination with NHPI (10 mol%) |
6 |
70 °C, under O2 (1 atm) |
EtOAc (2 mL) |
89 |
54 |
| [MIMPs]+ Cl− (20 mol%) in combination with TEMPO (5 mol%) and NaNO2 (8 mol%) |
10 |
At 2 steps: T1 = 45 °C, T2 = 55 °C, under O2 |
CH3CN/H2O (2 mL/2 mL) |
94 |
55 |
3.2.11 Hot filtration test. A hot filtration test was performed to ensure that the photocatalytic activity originates from the whole W–ZnO@NH2–CBB and not from the leached fragments. For this purpose, condensation of benzyl alcohol (1 mmol) and ortho-phenylenediamine (0.08 g, 1.2 mmol) in ethanol and under the irradiation of an Hg lamp was carried out in the presence of 0.02 g W–ZnO@NH2–CBB. The obtained yield was 81% after 60 min. Then, toluene was added to dissolve all reagents and products except for the photocatalyst, thus, W–ZnO@NH2–CBB was easily separated from the reaction mixture. Thereafter, the reaction was continued with the filtrate at the same condition. No significant increase in the yield% of product was reached after another 60 min, proofing that leaching of W–ZnO@NH2–CBB would not carry out and the photocatalyst is stable, as confirmed by the reusability experiments (Fig. 16).
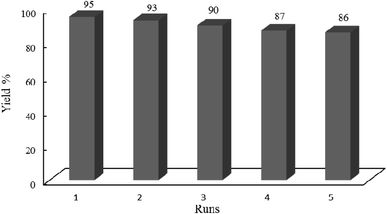 |
| | Fig. 16 Studying recyclability of W–ZnO@NH2–CBB under the optimized reaction conditions. 0.02 g of photocatalyst was used in all cases. | |
3.2.12 Recovery and reusability of W–ZnO@NH2–CBB. Due to the high importance of the recycling and reusing of heterogeneous catalysts in the academic and industrial research, reusability of W–ZnO@NH2–CBB was studied in the desired condensation reaction. Therefore, after completion of each run, toluene was added and the catalyst was separated from the reaction through a simple filtration. The filtered catalyst was washed with toluene thoroughly and dried at room temperature, then used in the same reaction for five successive runs. The results showed good reusability of W–ZnO@NH2–CBB (Fig. 16). Furthermore, we compared the XRD of final reused catalyst with that of the fresh one (Fig. 17a and b). The results showed that XRD of the reused W–ZnO@NH2–CBB after fifth run is almost the same as that of the fresh one and no significant changes can be observed in terms of peak position. To ascertain that W and CBB are maintained in the reused photocatalyst, FT-IR of this material is compared with the fresh one (Fig. 18a and b). As anticipated, the corresponding stretchings due to W and CBB fragments are visible; thus, no significant leaching would occur in the reused photocatalyst. The SEM image of the recycled photocatalyst is also given in Fig. 19. Particles smaller than 50 nanometer in size are still easily recognizable, however, some aggregation is evident in the recycled photocatalyst.
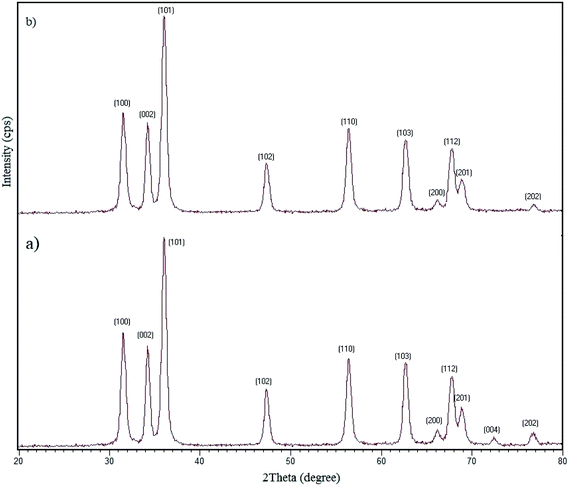 |
| | Fig. 17 XRD patterns of the fresh (a) and final reused photocatalyst (b). | |
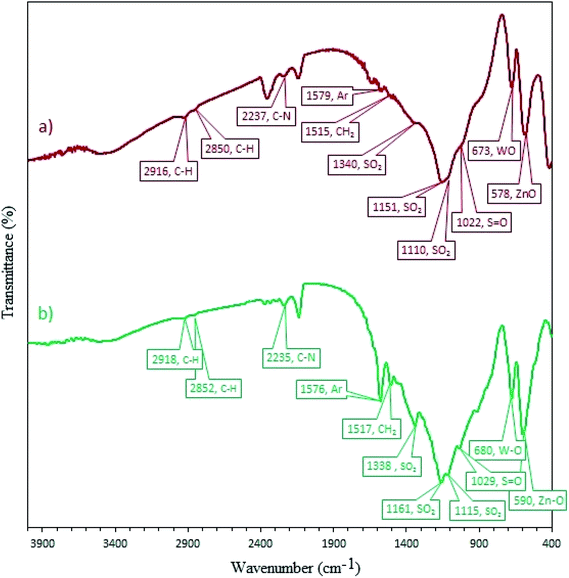 |
| | Fig. 18 FT-IR spectra of the fresh (a) and final reused photocatalyst (b). | |
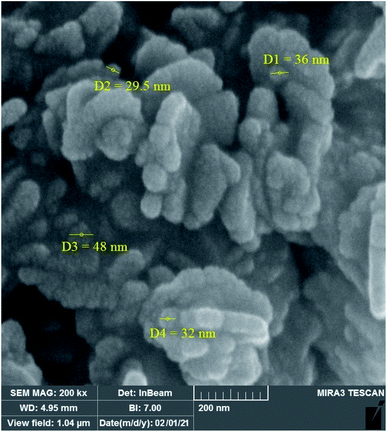 |
| | Fig. 19 FESEM images of the final reused photocatalyst. | |
3.2.13 Proposed reaction pathway. A plausible reaction pathway is outlined for the synthesis of benzimidazole derivatives in Scheme 2. According to this route, initially W–ZnO@NH2–CBB activates the dehydrogenative oxidation of benzyl alcohol with air in the presence of light to form the corresponding benzaldehyde (1). The in situ generated benzaldehyde reacts with o-phenylenediamine to produce an imine intermediate (2), which is accompanied by the release of a water molecule. Subsequently, the imine intermediate that is in equilibrium with the corresponding dihydrobenzimidazole (3), can be catalytically dehydrogenated with air to generate the desired final benzimidazole product. Although previous reports56 strongly commented that conversion of imine intermediate to the corresponding benzimidazole would involve generation of intermediate (3), however, it seems that the protodeauration of imine intermediate (2) should be very fast because we failed to detect it by NMR. In addition, performing this reaction in N2 atmosphere, led to a significant decrease in the yield% from 95 to 37%. This finding clearly confirmed the distinct role of oxygen in the reaction progress.
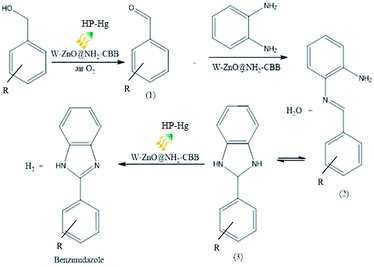 |
| | Scheme 2 A suggested mechanism for the synthesis of 2-substituted benzimidazoles catalyzed by W–ZnO@NH2–CBB. | |
4 Conclusion
In conclusion, we introduced a green heterogeneous and reusable nanophotocatalyst based on W–ZnO@NH2 modified by coomassie brilliant blue (CBB) for the one-pot multi-component photocatalytic synthesis of benzimidazoles, benzothiazoles and benzoxazoles in ethanol. The novel photocatalyst was characterized by XRD, FT-IR, TGA and SEM. Some preliminary mechanistic studies demonstrated that the reaction occurs mainly via a radical mechanism and reactive species such as ·O2−, OH˙ and h+ would be involved in the photocatalytic process. Stability and reusability studies also confirmed that W–ZnO@NH2–CBB is a stable and reproducible nanophotocatalyst. This methodology suggests various advantages, including good to excellent yield, short reaction time, excellent recovery and reusability of the photocatalyst without significant loss of activity. In addition, no need to use any specific oxidant and the protocol can be expanded to a wide range of benzyl alcohols. Finally, a preliminary MTT assay confirmed that W–ZnO nanoparticles show a significant cytotoxicity against the MCF7 breast cell line.
Conflicts of interest
There are no conflicts to declare.
Acknowledgements
The authors/creators would like to acknowledge the financial support of Ministry of Science, Research and Technology for this project under grant number 12-99-02-000029. Also, the work has been supported by Hakim Sabzevari University. This investigation was approved by Xi'an Central Hospital animal ethical committee, approved no. XASZX210414.
References
- S. K. Sahoo, Renewable Sustainable Energy Rev., 2016, 59, 927–939 CrossRef.
- M. Zhu, Z. Sun, M. Fujitsuka and T. Majima, Angew. Chem., Int. Ed., 2018, 57, 2160–2164 CrossRef CAS PubMed.
- E. Parvizi, R. Tayebee, E. Koushki, M. F. Abdizadeh, B. Maleki, P. Audebert and L. Galmiche, RSC Adv., 2019, 9, 23818–23831 RSC.
- S. Shanmugam, S. Xu, N. N. M. Adnan and C. Boyer, Macromolecules, 2018, 51, 779–790 CrossRef CAS.
- Z. Li, H. Song, R. Guo, M. Zuo, C. Hou, S. Sun, X. He, Z. Sun and W. Chu, Green Chem., 2019, 21, 3602–3605 RSC.
- L. Zhang and M. Jaroniec, Appl. Surf. Sci., 2018, 430, 2–17 CrossRef CAS.
- S. Li, Q. Liang, S. A. H. Ahmed and J. Zhang, Food Anal. Methods, 2020, 1–8 Search PubMed.
- C. Tejada-Casado, M. Hernández-Mesa, M. del Olmo-Iruela and A. M. García-Campaña, Talanta, 2016, 161, 8–14 CrossRef CAS PubMed.
- A. Bello, A. Uzairu and G. Shallangwa, J. Mater. Environ. Sci., 2019, 10, 1–14 CAS.
- S. Saini, N. Dhiman, A. Mittal and G. Kumar, J. Drug Delivery Ther., 2016, 6, 100–102 CAS.
- M. Shahnaz, P. Kaur, J. Parkash and D. Parsad, J. Drug Delivery Ther., 2018, 8, 460–464 CrossRef CAS.
- M. Hossain and A. K. Nanda, Science, 2018, 6, 83–94 CAS.
- H. P. Vemana, L. Barasa, N. Surubhotla, J. Kong, S. S. Ha, C. Palaguachi, J. L. Croft, S. Yoganathan and V. V. Dukhande, FASEB J., 2019, 33, 618–646 Search PubMed.
- P. Flores-Carrillo, J. M. Velázquez-López, R. Aguayo-Ortiz, A. Hernández-Campos, P. J. Trejo-Soto, L. Yépez-Mulia and R. Castillo, Eur. J. Med. Chem., 2017, 137, 211–220 CrossRef CAS PubMed.
- A. K. Chaturvedi, A. K. Verma, J. P. Thakur, S. Roy, S. B. Tripathi, B. S. Kumar, S. Khwaja, N. K. Sachan, A. Sharma and D. Chanda, Bioorg. Med. Chem., 2018, 26, 4551–4559 CrossRef CAS PubMed.
- S. N. A. Bukhari, G. Lauro, I. Jantan, C. Fei Chee, M. W. Amjad, G. Bifulco, H. Sher, I. Abdullah and N. A. Rahman, Future Med. Chem., 2016, 8, 1953–1967 CrossRef CAS PubMed.
- M. S. Vasava, M. N. Bhoi, S. K. Rathwa, D. J. Jethava, P. T. Acharya, D. B. Patel and H. D. Patel, Mini-Rev. Med. Chem., 2020, 20, 532–565 CrossRef CAS PubMed.
- J. Sharma, P. K. Soni, R. Bansal and A. K. Halve, Curr. Org. Chem., 2018, 22, 2280–2299 CrossRef CAS.
- X. Wen, J. El Bakali, R. Deprez-Poulain and B. Deprez, Tetrahedron Lett., 2012, 53, 2440–2443 CrossRef CAS.
- K. R. Al-Jorani, A. J. K. Atia, S. J. Lafta, R. I. Al-Bayti, S. A. Kadhem and S. M. Baqer, J. Pharm. Sci. Res., 2019, 11, 1195–1203 CAS.
- C. Rathod, R. Rajurkar and S. Thonte, Indo Am. J. Pharm. Res., 2013, 3, 2323–2329 Search PubMed.
- K. D. Parghi and R. V. Jayaram, Catal. Commun., 2010, 11, 1205–1210 CrossRef CAS.
- S. Das, S. Mallick and S. De Sarkar, The J. Org. Chem., 2019, 84, 12111–12119 CrossRef CAS PubMed.
- A. Sajjadi and R. Mohammadi, J. Med. Chem., 2019, 2, 55–58 CAS.
- M. Bharathi, S. Indira, G. Vinoth and K. S. Bharathi, J. Porous Mater., 2019, 26, 1377–1390 CrossRef CAS.
- A. Nozarie, Chem. Methodol., 2019, 3, 768–776 CrossRef CAS.
- S. Sajjadifar, I. Amini, H. Jabbari, O. Pouralimardan, M. Hossein Fekri and K. Pal, Eurasian Chem. Commun., 2019, 1, 191–192 CrossRef CAS.
- K. Wada, H. Yu and Q. Feng, Chin. Chem. Lett., 2020, 31, 605–608 CrossRef CAS.
- K. B. Dhopte, R. S. Zambare, A. V. Patwardhan and P. R. Nemade, RSC Adv., 2016, 6, 8164–8172 RSC.
- J. Xie, Z. Zhou, Y. Lian, Y. Hao, X. Liu, M. Li and Y. Wei, Ceram. Int., 2014, 40, 12519–12524 CrossRef CAS.
- M. Maity, S. Dolui and N. C. Maiti, Phys. Chem. Chem. Phys., 2015, 17, 31216–31227 RSC.
- R. Tayebee, M. Fattahi Abdizadeh, M. Mohammadpour Amini, N. Mollania, Z. Jalili and H. Akbarzadeh, Int. J. Nano Dimens., 2017, 8, 365–372 CAS.
- S. Bai, K. Zhang, L. Wang, J. Sun, R. Luo, D. Li and A. Chen, J. Mater. Chem., 2014, 2, 7927–7934 RSC.
- K. S. Babu, A. R. Reddy, C. Sujatha, K. V. Reddy and A. Mallika, J. Adv. Ceram., 2013, 2, 260–265 CrossRef.
- H. Alinezhad, M. Tarahomi, B. Maleki and A. Amiri, Appl. Organomet. Chem., 2019, 33, e4661 CrossRef.
- S. D. Lee, S. H. Nam, M. H. Kim and J. H. Boo, Phys. Procedia, 2012, 32, 320–326 CrossRef CAS.
- F. Shirini, M. Abedini, S. Zamani and H. F. Moafi, J. Nanostruct. Chem., 2015, 5, 123–130 CrossRef CAS.
- A. Faudoa-Arzate, A. Arteaga-Durán, R. Saenz-Hernández, M. Botello-Zubiate, P. Realyvazquez-Guevara and J. Matutes-Aquino, Materials, 2017, 10, 200 CrossRef PubMed.
- L. Jing, Z. Xu, X. Sun, J. Shang and W. Cai, Appl. Surf. Sci., 2001, 180, 308–314 CrossRef CAS.
- M. Humayun, A. Zada, Z. Li, M. Xie, X. Zhang, Y. Qu, F. Raziq and L. Jing, Appl. Catal., B, 2016, 180, 219–226 CrossRef CAS.
- F. Narenji-Sani, R. Tayebee and M. Chahkandi, ACS Omega, 2020, 5, 9999–10010 CrossRef CAS PubMed.
- K. Tennakone, O. Ileperuma, J. Bandara and W. Kiridena, Semicond. Sci. Technol., 1992, 7, 423 CrossRef CAS.
- T. López-León, J. L. Ortega-Vinuesa, D. Bastos-González and A. Elaïssari, J. Phys. Chem. B., 2006, 110, 4629–4636 CrossRef PubMed.
- M. Hoque and M. I. Guzman, Materials, 2018, 11, 1990 CrossRef PubMed.
- P. Johne and H. Kisch, J. Photochem. Photobiol., A, 1997, 111, 223–228 CrossRef CAS.
- A. K. Sharma, J. Tiwari, D. Jaiswal, S. Singh, J. Singh and J. Singh, Curr. Organocatal., 2019, 6, 222–230 CrossRef CAS.
- B. Li, R. Tayebee, E. Esmaeili, M. S. Namaghi and B. Maleki, RSC Adv., 2020, 10, 40725–40738 RSC.
- R. K. Sharma, B. Arora, S. Sharma, S. Dutta, A. Sharma, S. Yadav and K. Solanki, Mater. Chem. Front., 2020, 4, 605–620 RSC.
- Z. Yin, M. Han, Z. Hu, L. Feng, Y. Liu, Z. Du and L. Zhang, Chem. Eng. J., 2020, 390, 124532 CrossRef CAS.
- X. Zheng, J. Yuan, J. Shen, J. Liang, J. Che, B. Tang, G. He and H. Chen, J. Mater. Sci.: Mater. Electron., 2019, 30, 5986–5994 CrossRef CAS.
- K. Tateyama, K. Wada, H. Miura, S. Hosokawa, R. Abe and M. Inoue, Catal. Sci. Technol., 2016, 6, 1677–1684 RSC.
- F. Feizpour, M. Jafarpour and A. Rezaeifard, Catal. Lett., 2018, 148, 30–40 CrossRef CAS.
- A. Eskandari, M. Jafarpour, A. Rezaeifard and M. Salimi, New J. Chem., 2018, 42, 6449–6456 RSC.
- A. Khoshyan, M. Pourtahmasb, F. Feizpour, M. Jafarpour and A. Rezaeifard, Appl. Organomet. Chem., 2019, 33, e4638 Search PubMed.
- Z. Geng, H.-y. Zhang, G. Yin, Y. Zhang and J. Zhao, J. Chem. Res., 2020, 44, 557–565 CrossRef CAS.
- M. A. Tzani, C. Gabriel and I. N. Lykakis, Nanomaterials, 2020, 10, 2405 CrossRef CAS PubMed.
|
| This journal is © The Royal Society of Chemistry 2021 |
Click here to see how this site uses Cookies. View our privacy policy here.  Open Access Article
 *b and
Reza Tayebee
 *b
*b

![[double bond, length as m-dash]](https://www.rsc.org/images/entities/char_e001.gif) O stretching in the SO3H group. The FT-IR spectrum of W–ZnO@NH2–CBB (Fig. 1c) showed that loading of CBB on W–ZnO@NH2 has not altered the main IR bands of CBB. In the FT-IR of W–ZnO@NH2–CBB, two peaks at 673 and 578 cm−1 are related to the presence of W–O and Zn–O, respectively.32,33
O stretching in the SO3H group. The FT-IR spectrum of W–ZnO@NH2–CBB (Fig. 1c) showed that loading of CBB on W–ZnO@NH2 has not altered the main IR bands of CBB. In the FT-IR of W–ZnO@NH2–CBB, two peaks at 673 and 578 cm−1 are related to the presence of W–O and Zn–O, respectively.32,33


![[thin space (1/6-em)]](https://www.rsc.org/images/entities/b_char_2009.gif) :
:![[thin space (1/6-em)]](https://www.rsc.org/images/entities/b_char_2009.gif) CBB ratio on the reaction progress. As expected, the ratio of W–ZnO@NH2 to CBB strongly affected the efficiency of the condensation reaction. Therefore, a model reaction was planned in the presence of 0.02 g of nanocomposite composed of different amounts of CBB ranging from 0.25–3 for W–ZnO@NH2
CBB ratio on the reaction progress. As expected, the ratio of W–ZnO@NH2 to CBB strongly affected the efficiency of the condensation reaction. Therefore, a model reaction was planned in the presence of 0.02 g of nanocomposite composed of different amounts of CBB ranging from 0.25–3 for W–ZnO@NH2![[thin space (1/6-em)]](https://www.rsc.org/images/entities/char_2009.gif) :
:![[thin space (1/6-em)]](https://www.rsc.org/images/entities/char_2009.gif) CBB ratio (Fig. 11). The obtained results revealed that 1
CBB ratio (Fig. 11). The obtained results revealed that 1![[thin space (1/6-em)]](https://www.rsc.org/images/entities/char_2009.gif) :
:![[thin space (1/6-em)]](https://www.rsc.org/images/entities/char_2009.gif) 1 ratio has been the best and efficiency of the photocatalyst was decreased with further enhancing the CBB amount, maybe due to the enhanced scattering and decreased penetration depth of the incident light.44,45 Furthermore, decreasing the photocatalyst efficacy with the higher amounts of CBB would be due to masking of W–ZnO surface with this material, which effectively alleviated efficacy of W–ZnO@NH2–CBB.
1 ratio has been the best and efficiency of the photocatalyst was decreased with further enhancing the CBB amount, maybe due to the enhanced scattering and decreased penetration depth of the incident light.44,45 Furthermore, decreasing the photocatalyst efficacy with the higher amounts of CBB would be due to masking of W–ZnO surface with this material, which effectively alleviated efficacy of W–ZnO@NH2–CBB.

![[thin space (1/6-em)]](https://www.rsc.org/images/entities/char_2009.gif) :
:![[thin space (1/6-em)]](https://www.rsc.org/images/entities/char_2009.gif) CBB ratio on the efficacy of condensation reaction. Reaction condition is similar to that in the caption of Fig. 8. Reaction time was 2 h. 0.02 g of photocatalyst was used in all cases.
CBB ratio on the efficacy of condensation reaction. Reaction condition is similar to that in the caption of Fig. 8. Reaction time was 2 h. 0.02 g of photocatalyst was used in all cases.


