 Open Access Article
Expanding the circularity of plastic and biochar materials by developing alternative low environmental footprint sensors
Rocco
Cancelliere
 *a,
Giuseppina
Rea
 *b,
Leonardo
Severini
a,
Luciana
Cerri
c,
Gabriella
Leo
 c,
Elisa
Paialunga
a,
Pietro
Mantegazza
a,
Claudia
Mazzuca
 a and
Laura
Micheli
 *a
*a
aDepartment of Chemical Sciences and Technologies, University of Rome Tor Vergata, Via della Ricerca Scientifica 1, 00133 Roma, Italy. E-mail: laura.micheli@uniroma2.it; rocco.cancelliere@uniroma2.it
bInstitute of Crystallography, CNR, Via Salaria Km 29, 300, 00015 Monterotondo, Rome, Italy. E-mail: giuseppina.rea@ic.cnr.it
cInstitute for the Study of Nanostructured Materials, CNR, Via Salaria Km 29, 300, 00015 Monterotondo, Rome, Italy
First published on 9th August 2023
Abstract
Flexible screen-printing technology combined with the use of a nano/material coating for improving electrode functionalities boosted the manufacturing of highly sensitive electrochemical sensors addressing the need for fast and easy-to-handle tests in different application fields. However, due to the large-scale production and disposable and single-use nature of these devices, their environmental footprint should be taken into careful consideration. Herein, the innovative reuse of post-consumer polyethene terephthalate (PET) plastics as an alternative substrate coupled with biochar as an environmentally friendly and cost-effective modifier is described as a sustainable alternative for the production of robust electrochemical sensors. The good printability of reused plastics with graphite inks despite the chemical heterogeneity, different crystallinity, and surface roughness was demonstrated using atomic force microscopy and attenuated total reflection Fourier transform infrared spectroscopy. Functionalization with brewers’ spent grain biochar enabled the fabrication of highly performing electrochemical sensors for nitrite detection in water having a limit of detection and a limit of quantification of 3.3 nM and 10.3 nM, respectively, with a linear range spanning from 0.01 to 500 μM, and good reproducibility (RSD% 8%). The innovative intervention of the biochar-multilayer system markedly enhanced the electron transfer process at the electrode interface while simultaneously serving as an absorptive material for the investigated analyte. This work lays a foundation for repurposing end-of-life plastics for the electronics industry and presents a customizable reuse strategy aimed to keep the value of plastics in the economy and reduce waste and leakage into the natural environment.
Introduction
Polyethene terephthalate (PET) is a thermoplastic polyester used worldwide to produce commodities in different application fields, mostly in food packaging and beverage sectors, owing to its lightweight, safety, transparency, flexibility, chemical inertia, durability, and thermal- and water-resistance.1,2 PET polymers are also durable and have a slow degradation rate which makes them persisting materials, estimated to have a lifespan ranging from decades to hundreds of years.3,4 Due to massive production, PET waste accumulation is unavoidable. In 2021, PET waste accounted for approximately 12% of global solid waste. Like other plastics, after leakage to different ecosystems, PET can break down into micro- and nano-plastics and pose grave risks to human health and wildlife.5 PET is also one of the most recyclable and recycled materials whose physical–chemical properties enable multiple regeneration cycles or manufacturing of novel fibres, film sheets, and again novel food and beverage containers.6,7 However, recycling or repurposing of damaged PET is not always appropriate for the food industry, thus the management of PET waste is directed toward other manufacturing end-users.8 As a possible new industrial target, we envisage the electrochemical sensor industry, which has experienced phenomenal growth over the past few decades in response to the rising demand for innovative, smart, and disposable sensing devices for diagnostics, pharmaceuticals, agri-food, and environmental monitoring.9 Electrochemical sensors are analytical devices that detect, quantify, and monitor target analytes even in complex matrices. The fundamental sensor design consists of a receptor, which binds the target analyte and produces a physical or chemical signal, and a transducer, which converts the analyte–receptor interaction into readable output signals.10 Properly connecting the receptor–transducer coupling provides selectivity and sensitivity; nevertheless, various nano/materials, conducting polymers, and composites are frequently employed to functionalize the electrode transducer and enhance the analytical performance of the sensor.11,12 Plastics are substituting glass, metals, and ceramics as substrates in screen-printing technology and for the development of wearable stretchy sensors, lab-on-a-chip, and point-of-care diagnostic tools.9 The use of plastic materials in electrochemistry permits a greater degree of functional integration, including the introduction of wireless transmission modules, control and data acquisition instrumentation, and in-built power units, among others, and provides advantages over metallic and ceramic materials, including mild synthetic conditions, scalable and large-area processing, low operating temperature, and biocompatibility. However, the adoption of flexible sensors increases plastic demand and consumption, and the exploitation of high-footprint materials improving the performance of the electrodes increases waste.13 In recent years, biochar has emerged as a valuable and effective electrode material and modifier, owing to its electrochemical properties combined with eco-friendly, economical, and renewable characteristics.14–16 Biochar's electrochemical properties (pseudo-capacitance, electron conductivity, and double-layer capacitance) result from its heterogeneous composition, which consists of an organic aromatic matrix with different levels of oxidation and inorganic constituents whose composition varies depending on the original feedstock and synthesis process.17In this paper, we propose repurposing post-consumer PET plastics for manufacturing robust and sustainable electrochemical sensors aiming to reduce the use of raw materials in the electronics sector while expanding the circularity of biomass derived from brewers’ spent grain biochar. Towards this purpose, we developed highly sensitive biochar-based sensors for the detection of nitrite in water samples, by exploiting both the conventional Autostat™ polyester and post-consumer PET supports for the fabrication of screen-printed electrodes, namely SPEs and PET_SPEs, respectively. We provided evidence on the usefulness and value of PET_SPE exploitation and demonstrated the capability of multi-layered biochar to enhance the electrochemical performance of both types of electrodes, namely Bio-SPE and Bio-PET_SPEs, respectively, after functionalization. The developed sensors demonstrated higher analytical performance, lower costs, and sustainability compared to previously realized devices.
Results and discussion
Morphological characterization
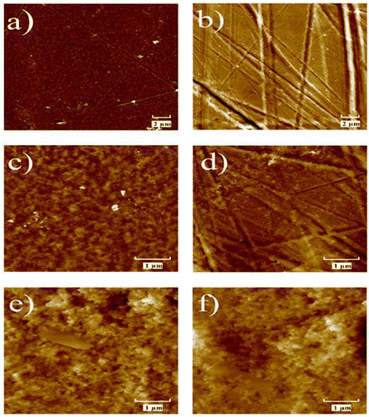
The surface morphology of plastic substrates and graphite-based screen-printed electrodes was investigated by atomic force microscopy (AFM) before and after graphite deposition. The difference in the height of the morphological characteristics of plastic-based screen-printed electrodes after biochar modification (Bio-PET_SPE) larger than 1 μm made AFM not an appropriate investigation technique for this sample (see Bio-PET_SPEs scanning electron microscopy images reported in our previous work19).Fig. 1 shows the AFM images of the Autostat™ polyester and post-consumer PET substrates before and after graphite electrode deposition. 20 μm × 20 μm and 5 μm × 5 μm AFM images of the Autostat™ polyester substrate (Fig. 1a and c) show a porous morphology. AFM scans recorded in different locations of the same sample point to the similar morphology and value of surface roughness across the surface. In contrast, the surface morphology of the post-consumer PET substrate shows long and deep scratches and grooves (Fig. 1b and d), unevenly distributed on the sample surface, resulting in increased surface roughness and different roughness measured in different areas of the sample surface.
Table 1 reports the average root mean squared (RMS) roughness values and the related standard deviation calculated from AFM scans recorded in 3–5 different areas of the four measured samples. The standard deviation values provide a measure of the lateral uniformity of the sample.
| Autostat™ polyester substrate | Post-consumer PET substrate | |||
|---|---|---|---|---|
| RMS (nm) | Stand. dev. (nm) | RMS (nm) | Stand. dev. (nm) | |
| 20 μm × 20 μm | ||||
| Bare substrate | 6.5 | 0.5 | 23.6 | 17.9 |
| 5 μm × 5 μm | ||||
| Graphite-screen-printed electrodes | 5.2 | 0.3 | 12.9 | 11.6 |
| 82.6 | 22.4 | 68.5 | 12.6 | |
Representative surface morphology of the graphite screen-printed electrodes is shown in Fig. 1e and f for both SPE and PET-SPE samples. Both AFM images show a small grain morphology and have height change across the surface of several hundredth nm (z scale of the AFM images) resulting in RMS roughness greater than that of the bare substrate samples and quite different in different surface areas (greater standard deviation, see Table 1). Also, the large height changes hindered recording of high-quality, reliable AFM scans larger than 5 μm × 5 μm.
However, and noteworthily, graphite screen-printed on post-consumer PET is smoother than the one printed on Autostat™ polyester as shown by both the lower value of the average RMS roughness and the decreased standard deviation (see Table 1).
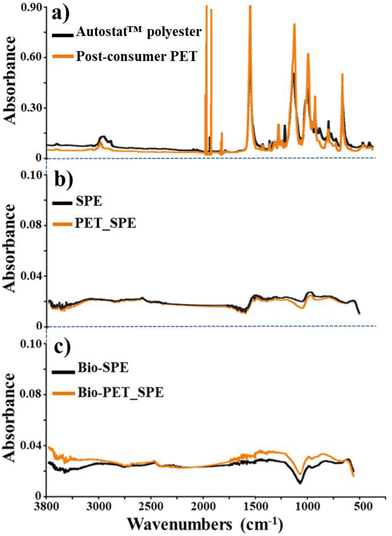
Attenuated total reflection Fourier transform infrared spectroscopy (ATR-FTIR) was performed to characterize the chemical composition and polymer crystallinity of the screen-printed electrodes and plastic substrates (Fig. 2).
Autostat™ polyester and post-consumer PET samples displayed sharp peaks at ∼1715 cm−1 and ∼725 cm−1, attributed to C![[double bond, length as m-dash]](https://www.rsc.org/images/entities/char_e001.gif) O stretching and C
O stretching and C![[double bond, length as m-dash]](https://www.rsc.org/images/entities/char_e001.gif) O out-of-plane bending vibrations, respectively (see Fig. 2a). Several ring stretching and bending vibrations provided bands at ∼1410 cm−1, ∼1020 cm−1, and ∼872 cm−1. Moreover, both samples showed broad peaks at ∼1240 cm−1 and ∼1100 cm−1, attributed to C(
O out-of-plane bending vibrations, respectively (see Fig. 2a). Several ring stretching and bending vibrations provided bands at ∼1410 cm−1, ∼1020 cm−1, and ∼872 cm−1. Moreover, both samples showed broad peaks at ∼1240 cm−1 and ∼1100 cm−1, attributed to C(![[double bond, length as m-dash]](https://www.rsc.org/images/entities/char_e001.gif) O)–O stretching, ring-ester CC stretching, C
O)–O stretching, ring-ester CC stretching, C![[double bond, length as m-dash]](https://www.rsc.org/images/entities/char_e001.gif) O in-plane bending and C–O stretching vibrations, respectively (see Fig. 2a).20–22 The bands at 1470, 1340, 1120, 970, and 849 cm−1 are markers of the crystalline structure of PET; their intensities appear higher in the spectrum of Autostat™ polyester, compared to that of post-consumer PET. However, bands at 1370, 1044, and 898 cm−1, characterizing the amorphous confirmation of samples, show a higher intensity for post-consumer PET material. Furthermore, FTIR spectra performed exactly on the Autostat™ polyester electrode (SPE) and post-consumer PET electrode (PET_SPEs) are nearly superimposable (Fig. 2b), demonstrating that the printed graphite layer, which is at least 2 μm thick, makes the surfaces extremely similar despite that the pristine plastic substrates were largely dissimilar as also observed in the AFM images (Fig. 1c–f). These results revealed the functional equivalence of post-consumer PET and Autostat™ polyester for our screen-printing technology, leading us to proceed with the subsequent steps of the sensor assembly, i.e., the layer-by-layer deposition of biochar to construct the Bio-PET_SPEs. FTIR analyses of Bio-PET_SPEs (Fig. 2c) provided further support for the feasibility of using post-consumer PET as a substrate in electrode printing.
O in-plane bending and C–O stretching vibrations, respectively (see Fig. 2a).20–22 The bands at 1470, 1340, 1120, 970, and 849 cm−1 are markers of the crystalline structure of PET; their intensities appear higher in the spectrum of Autostat™ polyester, compared to that of post-consumer PET. However, bands at 1370, 1044, and 898 cm−1, characterizing the amorphous confirmation of samples, show a higher intensity for post-consumer PET material. Furthermore, FTIR spectra performed exactly on the Autostat™ polyester electrode (SPE) and post-consumer PET electrode (PET_SPEs) are nearly superimposable (Fig. 2b), demonstrating that the printed graphite layer, which is at least 2 μm thick, makes the surfaces extremely similar despite that the pristine plastic substrates were largely dissimilar as also observed in the AFM images (Fig. 1c–f). These results revealed the functional equivalence of post-consumer PET and Autostat™ polyester for our screen-printing technology, leading us to proceed with the subsequent steps of the sensor assembly, i.e., the layer-by-layer deposition of biochar to construct the Bio-PET_SPEs. FTIR analyses of Bio-PET_SPEs (Fig. 2c) provided further support for the feasibility of using post-consumer PET as a substrate in electrode printing.
Electrochemical characterization
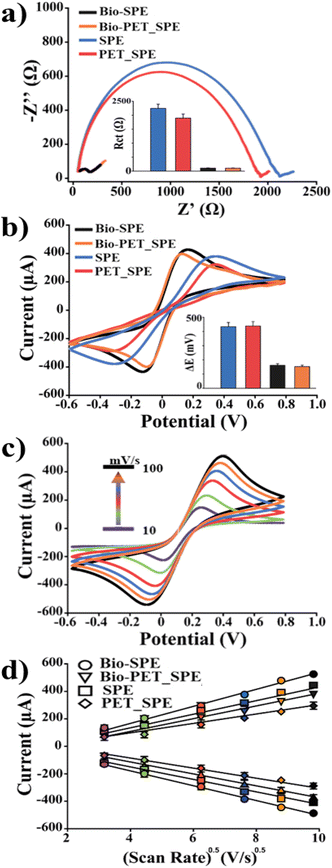
An in-depth study was hence performed to verify the electrochemical behaviour of the developed electrodes for the fabrication of reliable sensors. To that end, the electrochemical performances of SPEs and PET_SPEs before and after biochar modification were compared. Initially, the background current was measured in 50 mM KCl solution for each electrode. The following currents were registered: 29 ± 4, 34 ± 5, 5.2 ± 0.3, and 6.4 ± 0.4 nA for SPEs, PET_SPEs, Bio-SPEs and Bio-PET_SPEs, respectively (n = 10 electrodes for each electrode type). However, the following signal-to-noise ratios (S/N) corresponding to the current measured in the presence (10 mM [Fe(CN)6]3−/4− in 100 mM KCl) and absence (only 100 mM KCl) of the redox probe were obtained: 230, 226, 476, and 473 for SPEs, PET_SPEs, Bio-SPEs and Bio-PET_SPEs, respectively. As previously observed for SPEs,12 PET_SPEs also showed a 5-fold decrease of the capacitive current associated with a 2-fold increase of the signal-to-noise ratio (S/N) when modified with biochar. Thus, both unmodified and biochar-modified electrodes demonstrated the applicability of post-consumer recycled plastic as a substrate material for the fabrication of trustworthy electrochemical devices. Impedance electrochemical spectroscopy (EIS) and cyclic voltammetry (CV) were used as complementary tools to investigate the electron transfer and diffusivity processes of the electrode/electrolyte interface in 10 mM [Fe(CN)6]3−/4− in 100 mM KCl solution (see Fig. 3). From the respective Nyquist plots and voltammograms, reported in Fig. 3a and b, it is possible to observe that the modification with biochar produced a dramatic improvement of the sluggish surface kinetics typical of bare electrodes (both SPEs and PET_SPEs) as demonstrated in our previous works.12This is evidenced by the decrease in the generally high charge transfer resistance (Rct, diameter of the semicircle) of bare platforms compared to that of biochar-modified SPEs and PET_SPEs. Specifically, the calculated Rct values for bare SPEs and PET_SPEs were 1.8 ± 0.2Ω and 1.9 ± 0.2Ω, respectively, and achieved 10-fold lower values after the modification with biochar (i.e., 0.15 ± 0.01Ω and 0.17 ± 0.01Ω, for Bio-SPE and Bio-PET_SPEs, respectively). The CV study also found this enhancement in the electron transfer kinetics of the redox process between the electrode/electrolyte interface attributable to biochar modification. This is demonstrated by the ideal trend of the anodic and cathodic peak ratio (Ipa/Ic = 1), the decrease of ΔE (from 0.35 to 0.16 and 0.40 to 0.18 V for SPEs and PET_SPEs, respectively), and the correlated k0 and k0′, calculated using Randles's and Marcus's theories (reported in Theoretical methods section),11,23 respectively. The correlated results are shown in Table 2.
| CV | EIS | ||||
|---|---|---|---|---|---|
| I pa/Ipc | D 0 × 10−6 (cm2 s−1) | k 0 × 10−3 (cm s−1) | W (Kσ) | k 0′ × 10−5 (cm s−1) | |
| SPE | 0.8 ± 0.1 | 1.4 ± 0.3 | — | 0.5 ± 0.1 | 1.6 ± 0.3 |
| PET_SPE | 1.3 ± 0.1 | 1.2 ± 0.2 | — | 0.5 ± 0.1 | 2.3 ± 0.2 |
| Bio-SPE | 1.1 ± 0.1 | 2.1 ± 0.2 | 2.4 ± 0.2 | 0.6 ± 0.1 | 7.4 ± 0.3 |
| Bio-PET_SPE | 1.1 ± 0.1 | 2.4 ± 0.2 | 2.1 ± 0.2 | 0.6 ± 0.1 | 7.4 ± 0.3 |
A study of the diffusivity process occurring at the electrode interface was carried out. In Fig. 3c the experiment performed using Bio-PET_SPEs is reported as an example. By examining the effect of the scan rate on the current peaks, it is possible to observe that the faster the scan rates, the smaller the size of the diffusion layer and, as a result, the higher the peak current. The diffusion coefficient (D0) was calculated as the average of the anodic and cathodic coefficients (DOx and DRed) using the Randles–Sevcik equation (eqn (4), reported in the Theoretical methods section).
As a result, the diffusivity of bare SPEs and PET_SPEs comparable to the one reported in the literature by Konopka and McDuffie was assessed.24 Analogously, a similar planar diffusion-controlled process in the oxidation/reduction reactions of the selected redox probe was found for Bio-SPEs and Bio-PET_SPEs. Subsequently, Ipa and Ipc were plotted as a function of the scan rate (γ0.5). Fig. 3d clearly shows the direct proportionality between the peak current and the square root of the scan rate according to the Randles–Sevcik equation.
The estimated slopes (μA (mV s−1)−0.5) of the linear correlation of Ipa and Ipc are as follows: 183.4 (R2 = 0.999) and −183.6 (R2 = 0.999), 148.1 (R2 = 0.998) and −148.2 (R2 = 0.999), 157.7 (R2 = 0.997) and −158.2 (R2 = 0.995), and 132.1 (R2 = 0.997) and −130.8 (R2 = 0.997), corresponding, to the SPE, PET_SPEs, Bio-SPE, and Bio-PET_SPEs. Table 3 provides a summary of the characterization of the analytical performances of the four different electrodes.
| SPE | PET_SPE | Bio-SPE | Bio-PET_SPE | |
|---|---|---|---|---|
| Ferricyanide | ||||
| LOD (μM) | 9.2 | 10.4 | 3.4 | 4.2 |
| LOQ (μM) | 28 | 30.2 | 10.5 | 12.1 |
| Sensitivity (mA Mcm2)−1 | 40 | 40.7 | 20.2 | 21.2 |
| Reproducibility (RSD%) | 9 | 10 | 4 | 5 |
| Uric acid | ||||
| LOD (μM) | 7.4 | 6.7 | 2.1 | 2.3 |
| LOQ (μM) | 22.3 | 20.7 | 7.3 | 8.7 |
| Sensitivity (mA Mcm2)−1 | 49.4 | 36.8 | 26.3 | 27.1 |
| Reproducibility (RSD%) | 9 | 10 | 5 | 5 |
| Ascorbic acid | ||||
| LOD (μM) | 3.2 | 4.7 | 0.5 | 0.8 |
| LOQ (μM) | 9.7 | 14.3 | 1.8 | 3.5 |
| Sensitivity (mA Mcm2)−1 | 21.3 | 12.7 | 5.9 | 6.9 |
| Reproducibility (RSD%) | 9 | 10 | 5 | 5 |
| Hydroquinone | ||||
| LOD (μM) | 9.2 | 10.5 | 2.1 | 1.9 |
| LOQ (μM) | 28 | 31.7 | 10.2 | 8.9 |
| Sensitivity (mA Mcm2)−1 | 40 | 42.2 | 19.4 | 16.8 |
| Reproducibility (RSD%) | 9 | 8 | 6 | 5 |
An in-depth investigation in terms of LOD, LOQ, and reproducibility of the developed sensors was performed by using ferro-ferricyanide, ascorbic acid (AA), uric acid (UA) and hydroquinone (HQ) as electroactive probes and performing square wave voltammetry (SWV) as the analytical technique. The reproducibility calculated for six different electrodes of each substrate showed comparable results between bare and biochar-modified electrodes: RSD% of 10, 11, 5 and 5% for SPEs, PET_SPEs, Bio-SPEs and Bio-PET_SPEs. These results demonstrate that conventional SPEs and PET_SPEs share the same analytical performance, as evidenced by the identical LOD, LOQ, and reproducibility values observed by analysing the different probes. This behaviour is also observed for biochar-modified electrodes, confirming the analytical robustness of PET_SPEs and their suitability for sensing applications.
Application of PET_SPEs to the detection of nitrite in a real sample
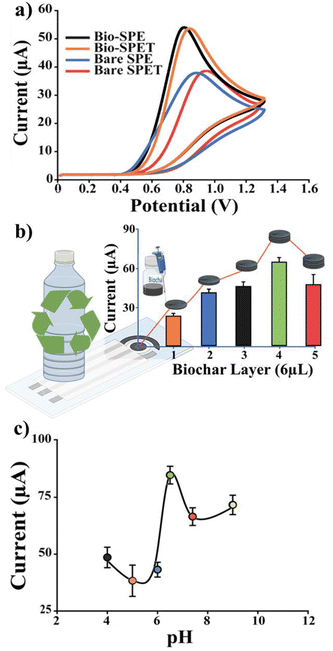
Biochar-modified PET_SPEs were used to develop an electrochemical sensor for quantifying nitrites in drinking water; their levels are regulated by government directives due to their potential toxicity for environmental and human health.25,26 Regarding this, we designed a biochar-multilayer system capable of adsorbing the analyte, which is then detected using SWV voltammetry.A careful optimization of parameters such as the deposited layers of biochar, the effect of pH on nitrite oxidation conditions, and the nitrite absorption time on the carbonaceous materials layer was explored, and the corresponding results are shown in Fig. 4. Considering the complexity of nitrite reduction reaction, which may involve interferences such as nitrate ions and reduction of molecular oxygen, oxidation is the most efficient method for electrochemically detecting nitrite. Initially, the behaviour of nitrite was investigated by CV measurements across all our platforms (SPEs, PET-SPEs, Bio-SPEs and Bio-PET_SPE).
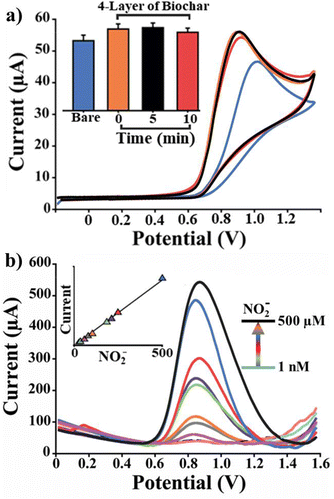
In Fig. 4a, the voltammograms obtained analysing a constant concentration of NO2− (100 μM) using SPEs, PET-SPEs, Bio-SPEs and Bio-PET_SPE are reported. According to Fig. 4a, biochar-modified platforms exhibited well-defined current peaks (0.75 and 0.81 V for Bio-SPE and Bio-PET_SPE, respectively) accompanied by a shift to a lower oxidizing potential compared to unmodified screen-printed electrodes (0.91 and 0.99 for SPE and PET_SPE, respectively). This can be attributed to the enhancing effect of biochar, which promotes the oxidation of NO2− in two ways: by exhibiting high electrocatalytic activity because of the presence of carbonyl and carboxyl groups and by increasing the surface area of the working electrode (WE). Specifically, to maximize the latter effect, biochar was deposited in multiple layers.
Fig. 4(b) and (c) show the effect of multiple layers of biochar and pH optimization on the detection of nitrite. SWV was performed using a constant nitrite concentration (100 μM) on each biochar deposited layer. As anticipated, the greater the number of layers, the larger the electrochemically active surface area (A, 0.12, 0.25, 0.47, 0.63, 0.78 cm2, for bare, 1, 2, 3 and 4 layers, respectively), and the higher the measured current. However, for more than 5 layers (not reported here), a decrease in the peak current was observed compared to 4-layer biochar-modified PET_SPEs (4-Bio-PET_SPEs). This is because the thick layer of biochar significantly reduces nitrite's diffusivity, thereby nullifying the effect of the increased surface area (A). Considering the best results obtained with 4-Bio-PET_SPEs, this platform was applied to explore the effect of pH on NO2− oxidation. As depicted in Fig. 4c, the maximum peak current was observed at pH 6.5; consequently, this value was chosen for further research. In contrast, the peak current decreases at pH values below or above 6.5. A possible explanation is that at low pH levels (below 4) protonation of nitrite occurs, forming nitrous acid thereby affecting its redox activity.6 A more basic pH, on the other hand, affects the stability of the silver reference electrode due to the formation of a passivating oxide layer.
At this point, the sorption capacity of biochar was determined by measuring the current as a function of time (0, 5, 10, and 20 minutes) while utilising the same nitrite concentration (100 M). Fig. 5 illustrates the relative results.
Fig. 5a depicts the biochar's negligible sorption effect on the analyte as a function of time, despite its well-documented sorption properties over N-based compounds. Typically, the biochar coatings used for sorption are thicker, so despite the four layers of biochar deposited in this case, the area is too small to observe this effect as a function of a short timeframe. After the oxidation conditions of nitrite were optimized, the analytical performances of Bio-PET_SPE as NO2− sensors were investigated. 4-Bio-PET_SPEs were tested at different concentrations of nitrite in PBS pH 6.5 (from 0 to 5 mM) using SWV as the analytical technique. The following analytical parameters were derived from the voltammograms shown in Fig. 5b and the relative calibration line (slope = 0.012, R2 = 0.998): LOD 2.91 nM, LOQ 10.2 nM, linear range from 0.01 to 500 μM, and sensitivity 0.174 μA μM−1 cm2. 4-Bio-SPEs analyzed under identical conditions exhibited nearly identical performances (LOD 2.6 nM, LOQ 10.3 nM, linear range 0.01 to 500 μM, and sensitivity 0.167 μA M−1 cm2), demonstrating once again the remarkable comparability of the performances of the Autostat™ polyester electrode (SPE) and post-consumer PET electrode (PET_SPEs), and the viability of reusing PET. Furthermore, nitrite concentrations were measured using mineral water (zero nitrite certified samples) for real sample analysis by the standard addition method in the range of 0.1–100 μM nitrite.
Extremely promising results were observed in terms of sensitivity LOD of 3.0 and 3.3 nM, reproducibility RSD = 7 and 8% for SPE and PET_SPE-based sensors, respectively, and recovery. Data reported in Table 4 highlight the reliability of Bio-PET_SPEs to detect nitrite as indicated by the recovery percentage ranging from 90 to 99%. In addition to the similarity of the electrochemical performance between SPEs and PET_SPE-based sensors, good reproducibility (always < 10%) was observed on using even nanomolar concentrations of NO2−.
| Concentration of NO2− | |||
|---|---|---|---|
| Spiked (CS, μM) | Recovered (C − C0, μM) | Recovery % (n = 6) | |
| Bio-SPE | 0.1 | 0.92 ± 0.05 | 92 |
| 10 | 9.4 ± 0.4 | 94 | |
| 100 | 101 ± 5 | 101 | |
| Bio-PET_SPE | 0.1 | 0.90 ± 0.09 | 90 |
| 10 | 9.3 ± 0.6 | 92 | |
| 100 | 99 ± 5 | 99 | |
Comparison of the performance and cost–benefit analysis
The performance of the biochar-based sensor under study was compared to earlier NO2− sensors reported in the literature. According to Table 5, both SPE and PET_SPE-based sensors exhibited a significantly lower LOD and wider linear range when modified with a biochar-multilayer system. It is essential to highlight the analytical performance of the proposed electrodes, especially in light of the simplicity of their construction and the predicted costs, which are roughly ten times lower than those of their competitors. Furthermore, it should be noted that this work addresses the challenge outlined in the European Union's “European Strategy for Plastics in a Circular Economy” starting that in 2030, all plastic packaging placed on the EU market will be either reusable or recyclable at a low cost.18,27 Indeed, this method proposes the sustainable and cost-effective reuse of post-consumer plastics for technological applications beyond their initial discarding application.| Device | LOD (nM) | Linear range (μM) | Matrix | Ref. |
|---|---|---|---|---|
| Acronyms: screen-printed carbon electrode (SPCE), gold nanoparticles (AuNPs), polyethyleneimine (PEI), graphite (GR), β-cyclodextrin (CD), nanobiochar obtained by hydrothermal carbonization 180 °C (NBC180), laser-induced graphene (LIG), COOH functionalized multiwalled carbon nanotubes (f-MWCNT), glassy carbon electrode (GCE), graphene oxide (GO), chitosan (CS), molybdenum disulfide (MoS2), urchin-like palladium nanostructures (Ur-Pd), single-walled carbon nanotubes (SWNT), poly 1,8-diaminonaphthalene (1,8-DAN). | ||||
| SPCE/AuNPs-PEI | 2.5 | 0.01–4.0 | Water | 28 |
| SPCE/GR-CD | 260 | 0.7–2150 | Water | 8 |
| SPCE/NBC180 | 2080 | 100–400 | Water/wine | 9 |
| LIG/f-MWCNT-AuNPs electrode | 900 | 10–140 | Tap water | 10 |
| GCE/GO-CS-AuNPs | 300 | 0.9–18.9 | PBS buffer | 11 |
| GCE/MoS2-AuNPs | 90 | 10–2100 | River and drinking water | 12 |
| Bare-GCE | 400 | 0.5–1000 | Lake water | 13 |
| Ur-Pd/SWCNT electrode | 250 | 2–238 | Deionised water | 14 |
| CPE/f-MWCNT/1,8-DAN | 75 | 0.3 to 65 | Tap water | 36 |
| 4-Bio-SPE | 3 | 0.01 to 500 | Mineral water | This work |
| 4-Bio-PET_SPEs | 3.3 | 0.01 to 500 | ||
Conclusions
Tackling the plastic pollution problem involves every part of the plastic value chain – from sourcing to end-of-life, and direct reuse of post-consumer products could be the quickest and most sustainable pathway towards plastic circularity.The method developed in this work is shown to be an easy, sustainable, and low-cost alternative for SPE construction by repurposing post-consumer PET to realize environmentally sustainable sensors with robust analytical performances. The peculiarity of the proposed method lies in the combined use of inexpensive PET beverage packaging as the substrate material for printing of serigraphic electrodes and biochar, which has the unique ability to function both as an absorbent substrate and as an enhancing material of the sluggish electron transfer kinetics of graphite-based electrodes.
Herein, we realized innovative, low-environmental footprint PET-biochar-based sensors having high sensitivity for detection of nitrite in water samples. The analytical parameters of Bio-PET-SPE sensors indicated sensitivity in the nanomolar range (LOD = 3 nM), high reproducibility (RSD% < 10%) and recovery in real sample analysis (always ≥ 90%), proving the viability of these devices for water monitoring.
These results showed for the first time that a biochar multilayer functionalization strategy can be adopted to achieve highly improved performance in terms of sensitivity compared to previously reported sensors.
Currently, we are developing an enzyme-free sensor based on PET_SPEs functionalised with metal-incorporating biochar to simulate nitrite oxidoreductase activity while improving the selectivity of our devices. Combined with a microfluidic system, these sensors hold the promise to be effective devices for real-time and on-site water monitoring.
Experimental section
Materials
All commercially available compounds were of analytical grade. Biochar was produced by pyrolytic micro-gasification (T = 400° C) in an Elsa D17 micro pyrolytic reactor (Bluecomb Ltd., Udine, Italy).19 Commercially available Autostat™ (HT5) polyester was purchased from Sirpi S.r.l (Milan, Italy), whereas post-consumer PET substrates are from water bottles and food packaging. Sigma-Aldrich (Steinheim, Germany) supplied sodium nitrite, hydroquinone, L-ascorbic acid, uric acid, and potassium chloride. Ferrocyanide and potassium ferricyanide were acquired from Fluka Chemie, Sigma-Aldrich (Buchs, Switzerland). The buffer solutions were 0.05 M phosphate buffered saline (PBS) + 0.1 M KCl with pH 7.4 and 0.05 M carbonate buffer (CB) with a pH of 9.0.Apparatus and experimental
All AFM images of the graphite-based screen-printed electrodes (SPE and PET_SPEs) before and after biochar modification (only Bio-PET_SPEs) were recorded in air in Scanasyst@ mode using a Multimode 8 microscope (BRUKER, USA) equipped with silicon nitride probes (SCANASYST AIR, BRUKER, USA) having a nominal curvature radius of 2 nm and an elastic constant of 0.4 N m−1. 512 × 512 points AFM scans were collected from 3–5 randomly chosen locations of the samples and with different scan sizes in order to check the lateral uniformity of the surface morphology. Dimensions of the scans varied between 2 μm × 2 μm and 20 μm × 20 μm. Root mean square (RMS) roughness values were calculated using Nanoscope Analysis software (BRUKER, USA).FTIR absorption spectra of electrodes were acquired with a Thermo-Scientific instrument (model Is50) (Thermo Scientific Inc., Madison WI USA) in attenuated total reflectance (ATR) mode using a single reflection diamond cell. Spectra were recorded from 4000 to 525 cm−1, averaging over 32 scans with a resolution of 2 cm−1. All experiments were performed in triplicate, yielding consistent and reproducible results.
Amperometry, CV, SWV and EIS analyses were performed using a PalmSens Instrument (PalmSens, Netherlands). A Hielscher UP200St-ultrasonic transducer was used for the preparation of biochar dispersions. Choronoamperometry (0.4 V, 150 s) was performed to measure the background current in 50 mM KCl solution by examining six different electrodes (n = 6) for each type of substrate.
Preparation of PET_SPEs
SPEs and PET_SPEs were manufactured in-house with a 245 DEK high-performance, multi-purpose, precision screen-printing machine. Specifically, both the working electrode (WE, geometric area ∼0.07 cm2) and counter electrodes (CEs) were printed on graphite-based ink (Elettrodag 421 at 80 °C) while silver ink was used to print the reference electrode (RE at 80 °C). The only distinction between SPEs and PET_SPEs is the used polyester.36 In detail, a small portion of used PET that is in good condition overall is identified. This material (flat or made flat by the application of physical weight) is initially rinsed with tap water and soap to remove any remaining dust and coarse dirt. After that, it is rinsed with a 4![[thin space (1/6-em)]](https://www.rsc.org/images/entities/char_2009.gif) :
:![[thin space (1/6-em)]](https://www.rsc.org/images/entities/char_2009.gif) 1 (v/v) ethanol/distilled water solution. This process removes any dirt or grease and prepares the surface for printing. To maximize the number of electrodes that can be printed on the portion of the recycled PET, the substrate is then cut to the appropriate dimensions and utilized in the fabrication of PET_SPEs. In Scheme 1 a representation of the PET_SPE fabrication is reported.
1 (v/v) ethanol/distilled water solution. This process removes any dirt or grease and prepares the surface for printing. To maximize the number of electrodes that can be printed on the portion of the recycled PET, the substrate is then cut to the appropriate dimensions and utilized in the fabrication of PET_SPEs. In Scheme 1 a representation of the PET_SPE fabrication is reported.
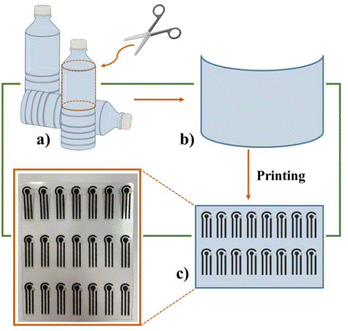 | ||
| Scheme 1 Fabrication of PET_SPEs: (a) and (b) plastic bottles as starting and printing substrate materials, (c) the final PET-based electrodes. | ||
Preparation of Bio-PET_SPEs
SPEs and PET_SPEs were amperometrically pre-treated (a steady anodic potential of +1.7 V was applied for 180 s) in 0.05 M phosphate buffer +0.1 M KCl, pH 7.4 solution. Then, a rinsing step (100 μL, three times) was carried out to remove any eventual salt residues, and 6 μL of a biochar dispersion (1 mg mL−1 in 1![[thin space (1/6-em)]](https://www.rsc.org/images/entities/char_2009.gif) :
:![[thin space (1/6-em)]](https://www.rsc.org/images/entities/char_2009.gif) 3 v/v ethanol-water solution), prepared using an ultrasonic transducer (200 W, 26 kHz, 30 minutes), was deposited by drop-casting onto the SPE's and PET_SPE's WE. The deposited solution is dried by heating the electrodes for 15 minutes at 38 °C. To prepare multiple biochar-deposited films, the final operation is repeated as many times as the desired number of coatings.
3 v/v ethanol-water solution), prepared using an ultrasonic transducer (200 W, 26 kHz, 30 minutes), was deposited by drop-casting onto the SPE's and PET_SPE's WE. The deposited solution is dried by heating the electrodes for 15 minutes at 38 °C. To prepare multiple biochar-deposited films, the final operation is repeated as many times as the desired number of coatings.
Theoretical methods
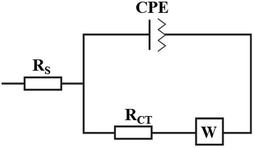
The impedimetric experimental data were fitted using a common Randles circuit (see Scheme 2). This equivalent circuit, one of the simplest possible models for describing electrochemical interface processes, consists of an active electrolyte resistance Rs in series with parallel combination of the double-layer capacitance constant phase element (CPE). In addition to the previously mentioned components, the charge transfer resistance (Rct) and Warburg impedance are also essential (W).15The electronic transfer process was studied following the redox process of the reversible couple ferro-ferricyanide: [Fe(CN)6]3− + 1e− ⇄ [Fe(CN)6]4−. The heterogeneous electron transfer constant was calculated voltammetrically (k0, Marcus’ theory, eqn (1)) and impedimetrically (k0′, Randles's theory, eqn (2)). k0 and k0′ were calculated using the following equations:15,16
 | (1) |
 | (2) |
 | (3) |
The Randles–Sevcik equation (eqn (4)) was utilized to examine the electrochemical behavior of several electrodes:
 | (4) |
Author contributions
Rocco Cancelliere: conceptualization, data curation, formal analysis, investigation, methodology, project administration, supervision, validation, visualization, writing – original draft, and writing – review and editing. Giuseppina Rea: methodology, investigation, formal analysis, supervision, writing – original draft, and writing – review and editing. Leonardo Severini: investigation and formal analysis. Luciana Cerri: methodology, investigation and data curation. Gabriella Leo: methodology, investigation, formal analysis, and data curation. Elisa Paialunga: visualization and data curation. Pietro Mantegazza: investigation. Claudia Mazzuca: investigation, formal analysis, and data curation. Laura Micheli: methodology, project administration, funding acquisition, resources, software, supervision, and writing – review and editing.Conflicts of interest
There are no conflicts to declare.Acknowledgements
This work was supported by the Regione Lazio-funded project SFIDE grant no. FISR2020IP_02585. The authors also acknowledge the Regione Lazio-funded project FACILE, grant no. 85-2017-15256 for implementing this scientific network.References
- P. Sarda, J. C. Hanan, J. G. Lawrence and M. Allahkarami, J. Polym. Sci., 2022, 60, 7–31 CrossRef CAS
.
- P. Benyathiar, P. Kumar, G. Carpenter, J. Brace and D. K. Mishra, Polymers, 2022, 14, 2366 CrossRef CAS
.
- C. Ioakeimidis, K. N. Fotopoulou, H. K. Karapanagioti, M. Geraga, C. Zeri, E. Papathanassiou, F. Galgani and G. Papatheodorou, Sci. Rep., 2016, 6, 23501 CrossRef CAS PubMed
.
- K. Zhang, A. H. Hamidian, A. Tubić, Y. Zhang, J. K. H. Fang, C. Wu and P. K. S. Lam, Environ. Pollut., 2021, 274, 116554 CrossRef CAS
.
- M. Arhant, M. Le Gall, P.-Y. Le Gac and P. Davies, Polym. Degrad. Stab., 2019, 161, 175–182 CrossRef CAS
.
- F. Awaja and D. Pavel, Eur. Polym. J., 2005, 41, 1453–1477 CrossRef CAS
.
- P. Benyathiar, P. Kumar, G. Carpenter, J. Brace and D. K. Mishra, Polymers, 2022, 14, 2366 CrossRef CAS PubMed
.
- K. Ragaert, L. Delva and K. Van Geem, Waste Manage., 2017, 69, 24–58 CrossRef CAS
.
- C. Dincer, R. Bruch, E. Costa-Rama, M. T. Fernández-Abedul, A. Merkoçi, A. Manz, G. A. Urban and F. Güder, Adv. Mater., 2019, 1806739 CrossRef PubMed
.
-
J. Wang, Analytical Electrochemistry, Wiley, 1st edn, 2006 Search PubMed
.
- R. Cancelliere, A. D. Tinno, A. Cataldo, S. Bellucci and L. Micheli, Biosensors, 2021, 12, 2 CrossRef PubMed
.
- A. Di Tinno, R. Cancelliere, P. Mantegazza, A. Cataldo, A. Paddubskaya, L. Ferrigno, P. Kuzhir, S. Maksimenko, M. Shuba, A. Maffucci, S. Bellucci and L. Micheli, Nanomaterials, 2022, 12, 1779 CrossRef CAS PubMed
.
- A. Ahamed, L. Ge, K. Zhao, A. Veksha, J. Bobacka and G. Lisak, Chemosphere, 2021, 278, 130462 CrossRef CAS PubMed
.
- R. Cancelliere, M. Cianciaruso, K. Carbone and L. Micheli, Chemosensors, 2022, 10, 344 CrossRef CAS
.
- J. Wang and S. Wang, J. Cleaner Prod., 2019, 227, 1002–1022 CrossRef CAS
.
- M. Chu, W. Tian, J. Zhao, M. Zou, Z. Lu, D. Zhang and J. Jiang, Chemosphere, 2022, 307, 136024 CrossRef CAS
.
- F. J. Chacón, M. L. Cayuela, A. Roig and M. A. Sánchez-Monedero, Rev. Environ. Sci. Biotechnol., 2017, 16, 695–715 CrossRef
.
- European Commission and Directorate-General for Communication, Circular economy action plan: for a cleaner and more competitive Europe, Publications Office of the European Union, 2020.
- R. Cancelliere, K. Carbone, M. Pagano, I. Cacciotti and L. Micheli, Biosensors, 2019, 9, 139 CrossRef CAS PubMed
.
- K. C. Cole, J. Guèvremont, A. Ajji and M. M. Dumoulin, Appl. Spectrosc., 1994, 48, 1513–1521 CrossRef CAS
.
- S. K. Bahl, D. D. Cornell, F. J. Boerio and G. E. McGraw, J. Polym. Sci., Polym. Lett. Ed., 1974, 12, 13–19 CrossRef CAS
.
- F. J. Boerio, S. K. Bahl and G. E. McGraw, J. Polym. Sci., Polym. Phys. Ed., 1976, 14, 1029–1046 CrossRef CAS
.
- R. Cancelliere, D. Albano, B. Brugnoli, K. Buonasera, G. Leo, A. Margonelli and G. Rea, Appl. Surf. Sci., 2021, 567, 150791 CrossRef CAS
.
- L. Celio, M. Ottaviani, R. Cancelliere, A. Di Tinno, P. Panjan, A. M. Sesay and L. Micheli, Front. Chem., 2021, 9, 626630 CrossRef CAS
.
- Z. Bahadoran, P. Mirmiran, A. Ghasemi, A. Kabir, F. Azizi and F. Hadaegh, Nitric Oxide, 2015, 47, 65–76 CrossRef CAS PubMed
.
- A. Ferlazzo, V. Bressi, C. Espro, D. Iannazzo, E. Piperopoulos and G. Neri, J. Electroanal. Chem., 2023, 928, 117071 CrossRef CAS
.
- C. Matthews, F. Moran and A. K. Jaiswal, J. Cleaner Prod., 2021, 283, 125263 CrossRef
.
- M. Talbi, A. Al-Hamry, P. R. Teixeira, L. G. Paterno, M. B. Ali and O. Kanoun, Chemosensors, 2022, 10, 40 CrossRef CAS
.
- S. Palanisamy, B. Thirumalraj and S.-M. Chen, J. Electroanal. Chem., 2016, 760, 97–104 CrossRef CAS
.
- A. Ferlazzo, V. Bressi, C. Espro, D. Iannazzo, E. Piperopoulos and G. Neri, J. Electroanal. Chem., 2023, 928, 117071 CrossRef CAS
.
- S. Nasraoui, A. Al-Hamry, P. R. Teixeira, S. Ameur, L. G. Paterno, M. Ben Ali and O. Kanoun, J. Electroanal. Chem., 2021, 880, 114893 CrossRef CAS
.
- R. Mo, X. Wang, Q. Yuan, X. Yan, T. Su, Y. Feng, L. Lv, C. Zhou, P. Hong, S. Sun, Z. Wang and C. Li, Sensors, 2018, 18, 1986 CrossRef PubMed
.
- X. Li, N. Zou, Z. Wang, Y. Sun, H. Li, C. Gao, T. Wang and X. Wang, Chem. Pap., 2020, 74, 441–449 CrossRef CAS
.
- S. Yallappa, M. Shivakumar, K. L. Nagashree, M. S. Dharmaprakash, A. Vinu and G. Hegde, J. Electrochem. Soc., 2018, 165, H614–H619 CrossRef CAS
.
- B. R. Kozub, N. V. Rees and R. G. Compton, Sens. Actuators, B, 2010, 143, 539–546 CrossRef CAS
.
- O. Salhi, T. Ez-zine, L. Oularbi and M. El Rhazi, Front. Chem., 2022, 10, 870393 CrossRef CAS PubMed
.
| This journal is © The Royal Society of Chemistry 2023 |

