Superstructures of copper nanoclusters as NIR TADF emitters: solvent-dependent optical and morphological modulation†
Sameeksha
Agrawal
a,
Debanggana
Shil
a,
Aakash
Gupta
b and
Saptarshi
Mukherjee
 *a
*a
aDepartment of Chemistry, Indian Institute of Science Education and Research Bhopal, Bhopal Bypass Road, Bhauri, Bhopal 462 066, Madhya Pradesh, India. E-mail: saptarshi@iiserb.ac.in; Tel: +91-755-269-1301
bDepartment of Chemistry, Indian Institute of Technology Bombay, Mumbai 400 076, Maharashtra, India
First published on 7th October 2024
Abstract
Herein, we report 2-mercaptopyridine-templated copper nanoclusters (CuNCs) which display near infra-red (NIR) emission, both in the solid and colloidal states. Interestingly, the NIR emission can be modulated to orange emission by preparing the CuNCs in a mixed solvent system of chloroform and methanol instead of water. The drastic change in the photo-physical properties of the CuNCs when prepared in two different solvent systems is accompanied by a unique morphological tuning. Further studies reveal that the strong NIR emission is the result of thermally activated delayed fluorescence (TADF) which is confirmed by the long excited state lifetime (∼4 μs at room temperature), time resolved emission spectroscopy (TRES) measurements, temperature-dependent photoluminescence studies, temperature-dependent lifetime studies, and excitation-transmittance dependent TRES intensity measurements. The CuNCs exhibit an exceptionally small singlet–triplet energy gap of 58.2 meV, indicating a highly efficient TADF in the system. Moreover, the solvent-dependent morphological tuning of the nanocluster superstructures rendering a drastic change in the photo-physical signatures is the consequence of different ΔE(S1–T1) values for the CuNCs in different solvent environments. Further findings corroborate that the electronic structure of the surface ligands can also help us to tune the ΔE(S1–T1) energy gap for these nanoclusters.
Introduction
Luminescent materials that emit in the near-infrared (NIR) wavelength region, i.e., 700 to 2500 nm, have garnered tremendous attention from researchers in the fields of chemistry, biomedical science, and materials science due to several advantages over conventional fluorophores.1–4 NIR emitters have the advantage of deep penetration due to less interference, reduced absorption, and less scattering.1–4 Moreover, the energy emitted by the excited state during the decay of NIR materials is much less, which suppresses the side reactions which in turn increases the stability of NIR-based materials and devices. Several attempts have been made to utilize the concept of thermally activated delayed fluorescence (TADF) of these NIR-based luminescent nanomaterials for fabricating light-emitting diodes for optoelectronics. Cadmium-containing quantum dots (QDs), for example, CdSe QDs, have found significant success in fabricating devices for optoelectronics.5 However, these heavy metal atom-containing QDs are not only highly toxic but also lose their photoluminescence properties on transferring these colloidal QDs into the solid state.6 Therefore, designing novel and environment-friendly photoluminescent materials is always challenging and has been a long-standing quest. To mitigate these challenges, coinage metal nanoclusters as NIR TADF emitters, characterized by low toxicity and high quantum yields, are considered promising candidates for manufacturing efficient organic light-emitting diodes (OLEDs). These luminescent and versatile nanomaterials have diverse applications in the fields of bio-imaging,7 catalysis,8,9 drug delivery,10 antibiotics,11 enzymatic activity,12 and sensing.13 In practice, atomically precise gold nanoclusters (AuNCs) with NIR emission are reported to exhibit TADF under specific conditions.14,15 In general, these AuNCs require to be embedded inside an inorganic salt matrix14 or a solid polymer matrix15 to prevent the quenching of the emission from their triplet state by non-radiative energy transfer to molecular oxygen. Moreover, due to the absence of heavy atoms in AuNCs, the spin-forbidden transitions (triplet to singlet) are highly suppressed. Thus, all the other radiation-less transitions, including thermal dissipation, need to be suppressed to ensure good quantum efficiencies from TADF, which is ascertained by the use of a solid-state matrix.14,15 Hence, preparing coinage metal nanoclusters (MNCs) that provide solid-state emission with high quantum efficiencies by harvesting the emission from the singlet state as well as the triplet state, and that too without the use of any solid-state matrix is quite a challenging issue. To stabilize the TADF emitters in the solid state, a rigid environment is needed to be introduced around the MNCs which not only suppresses the radiation-less transitions from thermal dissipation but also protects the non-radiative energy transfer from the triplet state to molecular oxygen. This can be achieved with the help of the formation of superstructures using MNCs.16–19 The formation of superstructures by establishing various kinds of interactions, e.g., π⋯π and C–H⋯π intermolecular interactions, H-bonding interactions, dipolar interactions, and hydrophobic interactions, between the MNCs is a useful tactic to suppress the emission of the MNCs through non-radiative decay pathways.16–19 Superstructures of MNCs have recently garnered immense attention due to their intriguing optical behavior, leading to unprecedented photo-physical signatures including very large Stokes shifts (>200 nm), long excited state lifetimes (in the μs range), and structure–property relationships.16–19 The design and synthesis of functional nanomaterials through careful engineering of the interactions among the nanoclusters involved in the formation of these superstructures have emerged as a frontier area of research to create materials with unique properties.20–23 Recently, the use of aromatic ligands as a template for preparing MNCs has been found to be promising because such aromatic ligands can result in the formation of highly stable NCs with unique spectroscopic properties.24 Moreover, aromatic ligands including aromatic thiols, phosphines, etc. are more prone to π⋯π and C–H⋯π intermolecular interactions, thereby rendering them reliable candidates for the formation of supramolecular architectures.16–20Over the past few decades, noteworthy developments in synthetic and analytical chemistry led to substantial achievements in the production and characterization of CuNCs.25–27 CuNCs are very susceptible to oxidation (primarily because of their small size and lower oxidation potential of 0.34 V), and hence to prevent rapid degradation and maintain their unique properties, the use of bulky ligands is a rational approach for achieving core stability of the MNCs.26,28 CuNCs exhibiting NIR emission (greater than 700 nm) are scarce in the literature.29 Fenske and co-workers have reported high-nuclearity chalcogenide (selenide) clusters of copper and silver from silylated chalcogenide sources, which tend to show NIR emission.30 Mak and co-workers have reported that the thermal compression of Cu(I)⋯Cu(I) bonds which are shorter than twice the van der Waals radius of the copper atom (2 × 1.4 Å) could lead to NIR emission of the CuNCs.31 In another study, Mak and co-workers presented the first report of alkynyl templated coinage metal nanoclusters which tend to show NIR TADF.32 Recently, Kumar and co-workers reported chiral copper nanoclusters which gave enhanced CPL guided by TADF, thus exhibiting the CP-TADF effect.33
Herein, we present a comprehensive study of the self-assembly of 2-mercaptopyridine (2-MPy)-protected CuNCs with explicit photo-physical properties. The CuNCs attain a distinct morphology and lead to the formation of self-assembled superstructures (Scheme 1). Interestingly, in DMSO, where these remain in the colloidal state, these CuNCs (referred to as R-CuNCs) exhibit NIR emission. On the other hand, in the solution state (when a mixture of chloroform, CHCl3, and methanol, MeOH, was used instead), these CuNCs (referred to as O-CuNCs) exhibited an orange emission characterized by a different morphology of the superstructures from what was seen when DMSO was used as the solvent. This variation in morphology and spectroscopic signatures of the MNCs in the nanoscale regime by altering the solvent system is a fascinating aspect of these nanomaterials.34 Altering the solvent results in environments leading to different intermolecular interactions, thereby resulting in the exclusive morphology and optical properties of the CuNCs, which enables us to study a new aspect of their structure–property relationship. Furthermore, both the CuNCs tend to display TADF behavior, with distinct ΔE(S1–T1) values, which could be the plausible reason for their distinct photo-physical signatures. To the best of our knowledge, this is the very first report of thiol-protected CuNCs displaying NIR TADF with stable emission in the solid state. The modulations of their spectroscopic properties accompanied by a remarkable change in the morphology of the CuNC superstructures (driven by solvent-mediated ΔE(S1–T1) values) open up new avenues to tailor the photo-physical signatures of MNCs. Moreover, this study also delineates the effect of the electron-withdrawing tendency of the surface ligands in modulating the ΔE(S1–T1) values, which may further guide us to fabricate highly efficient MNC-based NIR optical materials.
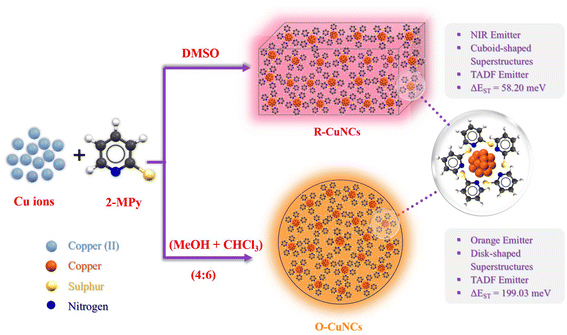 | ||
| Scheme 1 Schematic representation of the morphological variation of the superstructures of the CuNCs in two different solvent environments and their respective properties. | ||
Experimental section
Materials
Ultrapure MilliQ water was used throughout the experiments. Copper(II) nitrate hemipentahydrate (Cu(NO3)2·2.5H2O), 2-mercaptopyridine (2-MPy), 5-chloro-2-mercaptopyridine (MPyCl), 5-bromo-2-mercaptopyridine (MPyBr), methyl viologen dichloride hydrate (MV2+), and sodium hydroxide (NaOH) were all purchased from Sigma-Aldrich USA and used as received. All the solvents of UV spectroscopy grade, i.e., methanol (MeOH), chloroform (CHCl3), and dimethylsulphoxide (DMSO), were purchased from Spectrochem.Methods and instrumentation
 | (i) |
 | (ii) |
All the spectra were recorded by taking 500 μL of the sample in a quartz cuvette of path length 10 mm.
Preparation of 2-mercaptopyridine (2-MPy)-templated CuNCs
Results and discussion
Characterization of R-CuNCs
The protocol for preparing the R-CuNCs was optimized by varying the pH, temperature, and metal-to-ligand concentration (Fig. S1†). The CuNCs prepared at pH ∼3, at 25 °C, and at a metal to ligand ratio of 4![[thin space (1/6-em)]](https://www.rsc.org/images/entities/char_2009.gif) :
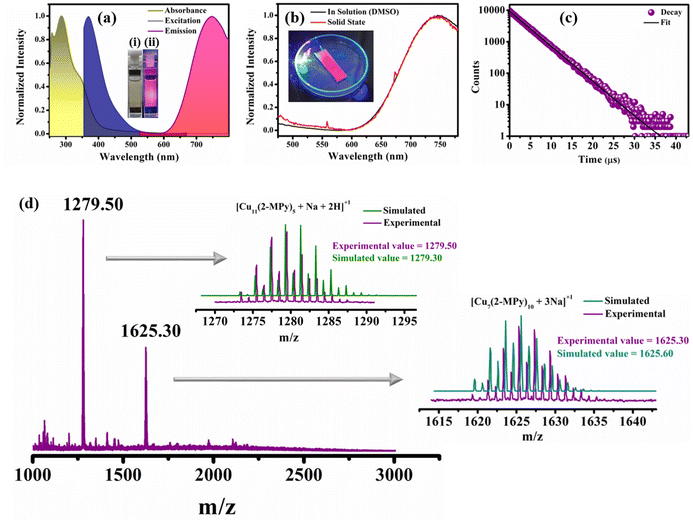
:![[thin space (1/6-em)]](https://www.rsc.org/images/entities/char_2009.gif) 4 exhibited the maximum PL intensity (Fig. S1†). The colloidal aqueous solution was subjected to high-speed centrifugation, and then filtered and re-dissolved in DMSO to obtain the colloidal solution back for further studies. In the absorption spectrum of the optimized R-CuNCs (re-dissolved in DMSO), the surface plasmon resonance (SPR) band (∼550–650 nm) that is typically a characteristic feature of larger size metal nanoparticles was conspicuously absent. This observation substantiated the conclusive evidence of the presence of remarkably low dimensional nanoclusters27,36 (Fig. 1a). Upon excitation at 410 nm, the R-CuNCs display an emission peak prominently centered at ∼745 nm (Fig. 1a). The emission spectra of the R-CuNCs demonstrate that the as-prepared CuNCs exhibit strong emission in the NIR region, characterized by a large Stokes shift of ∼375 nm (the excitation peak being at 370 nm, Fig. 1a). This large Stokes shift observed is an indication that the emission does not have much contribution from the intra-band transmission (sp–sp) or inter-band transition (sp–d) within the core. Instead, the emission observed herein from the CuNCs originates from the ligand-to-metal charge transfer (LMCT) or ligand-to-metal-to-metal charge transfer (LMMCT) from the sulphur atom of the ligand to the Cu atoms and the radiative relaxation likely occurs through a metal-centered triplet state.37–40 The as-prepared CuNCs have a well-defined HOMO–LUMO gap as evident from their excitation-dependent emission spectra, which do not display any shift in the emission maxima (Fig. S2a†). This also infers that the CuNCs were substantially homogeneous in terms of their size distribution (as discussed later). In general, the small molecule-templated MNCs are subject to several limitations, particularly concerning their photostability. However, in our case, the CuNCs exhibited exceptional photostability as evident from Fig. S2b.† Moreover, the as-prepared CuNCs show strong PL in the solid state without any change in the emission spectra; the maximum being centered at ∼745 nm (Fig. 1b). To comprehend the excited state of the CuNCs, we carried out time-resolved measurements and estimated the excited state lifetime using a spectral LED source of 355 nm. Interestingly, the R-CuNCs exhibited a very long excited state lifetime of around ∼4 μs (Fig. 1c and Table S1†). The exceptionally large lifetime is indicative of the stabilization of the excited state of the CuNCs, which is generally a consequence of the assembly of the nanoclusters forming a superstructure.19,41,42 The lifetime results are also in coherence with the large Stokes shift obtained for the system, corroborating the fact that the PL of the CuNCs is the result of LMCT and/or LMMCT.43–45 Furthermore, to prove the involvement of LMCT/LMMCT in the emission mechanism of the as-prepared CuNCs, we performed the photoluminescence quenching experiment using methyl viologen dichloride hydrate (MV2+) as a fluorophore. MV2+ is a well-known electron scavenger, which induces photo-induced electron transfer (PET) from MNCs.46,47 Upon the addition of MV2+ to the CuNC solution, the PL intensity of the CuNCs is quenched (Fig. S3†). The addition of MV2+ to the solution of CuNCs hinders the charge transfer from the surface ligands to the metal core of the MNCs, which was otherwise happening before the addition of MV2+. This is reflected in the quenching of the PL intensity of the CuNCs and happens only in the presence of the added MV2+.46,47 Therefore, this quenching depicts the prominent involvement of LMCT/LMMCT, resulting in the emission of the CuNCs as observed in this present investigation.
4 exhibited the maximum PL intensity (Fig. S1†). The colloidal aqueous solution was subjected to high-speed centrifugation, and then filtered and re-dissolved in DMSO to obtain the colloidal solution back for further studies. In the absorption spectrum of the optimized R-CuNCs (re-dissolved in DMSO), the surface plasmon resonance (SPR) band (∼550–650 nm) that is typically a characteristic feature of larger size metal nanoparticles was conspicuously absent. This observation substantiated the conclusive evidence of the presence of remarkably low dimensional nanoclusters27,36 (Fig. 1a). Upon excitation at 410 nm, the R-CuNCs display an emission peak prominently centered at ∼745 nm (Fig. 1a). The emission spectra of the R-CuNCs demonstrate that the as-prepared CuNCs exhibit strong emission in the NIR region, characterized by a large Stokes shift of ∼375 nm (the excitation peak being at 370 nm, Fig. 1a). This large Stokes shift observed is an indication that the emission does not have much contribution from the intra-band transmission (sp–sp) or inter-band transition (sp–d) within the core. Instead, the emission observed herein from the CuNCs originates from the ligand-to-metal charge transfer (LMCT) or ligand-to-metal-to-metal charge transfer (LMMCT) from the sulphur atom of the ligand to the Cu atoms and the radiative relaxation likely occurs through a metal-centered triplet state.37–40 The as-prepared CuNCs have a well-defined HOMO–LUMO gap as evident from their excitation-dependent emission spectra, which do not display any shift in the emission maxima (Fig. S2a†). This also infers that the CuNCs were substantially homogeneous in terms of their size distribution (as discussed later). In general, the small molecule-templated MNCs are subject to several limitations, particularly concerning their photostability. However, in our case, the CuNCs exhibited exceptional photostability as evident from Fig. S2b.† Moreover, the as-prepared CuNCs show strong PL in the solid state without any change in the emission spectra; the maximum being centered at ∼745 nm (Fig. 1b). To comprehend the excited state of the CuNCs, we carried out time-resolved measurements and estimated the excited state lifetime using a spectral LED source of 355 nm. Interestingly, the R-CuNCs exhibited a very long excited state lifetime of around ∼4 μs (Fig. 1c and Table S1†). The exceptionally large lifetime is indicative of the stabilization of the excited state of the CuNCs, which is generally a consequence of the assembly of the nanoclusters forming a superstructure.19,41,42 The lifetime results are also in coherence with the large Stokes shift obtained for the system, corroborating the fact that the PL of the CuNCs is the result of LMCT and/or LMMCT.43–45 Furthermore, to prove the involvement of LMCT/LMMCT in the emission mechanism of the as-prepared CuNCs, we performed the photoluminescence quenching experiment using methyl viologen dichloride hydrate (MV2+) as a fluorophore. MV2+ is a well-known electron scavenger, which induces photo-induced electron transfer (PET) from MNCs.46,47 Upon the addition of MV2+ to the CuNC solution, the PL intensity of the CuNCs is quenched (Fig. S3†). The addition of MV2+ to the solution of CuNCs hinders the charge transfer from the surface ligands to the metal core of the MNCs, which was otherwise happening before the addition of MV2+. This is reflected in the quenching of the PL intensity of the CuNCs and happens only in the presence of the added MV2+.46,47 Therefore, this quenching depicts the prominent involvement of LMCT/LMMCT, resulting in the emission of the CuNCs as observed in this present investigation.
To have an estimate of the composition of the cluster core comprising the CuNCs, we carried out ESI-mass spectrometry analysis. The ESI-MS spectrum of the R-CuNCs carried out in positive ion mode is shown in Fig. 1d. The two substantially intense peaks centered at m/z values of 1279.50 and 1625.30 show a peak separation equal to 1 in their respective isotopic patterns, indicating the overall charge of +1 on the detected entity.19,48 The isotopic patterns of the peaks centered at m/z values of 1279.50 and 1625.30 match well with the simulated isotopic mass pattern corresponding to the compositions [Cu11(2-MPy)5 + Na + 2H]+1 and [Cu7(2-MPy)10 + 3Na]+1, respectively (right panel in Fig. 1d). The FT-IR spectrum of only the ligand (2-MPy) shows a broad peak in the range of 3160–2770 cm−1 due to the strong H-bonding between the hydrogen of the N–H group and the sulphur atom of the ligand (Fig. S4†). The disappearance of this broadband in the FT-IR spectrum indicates the formation of CuNCs due to the bonding between the ligand and the copper core (Fig. S4†).
The TEM studies reveal a fascinating morphology of the as-prepared CuNCs. The R-CuNCs were assembled into ordered supramolecular hierarchical superstructures in the form of three-dimensional cuboids (Fig. 2a–c). At a higher magnification, discrete CuNCs getting self-assembled in the form of cuboid-like superstructures could be clearly seen (Fig. 2d), with the CuNCs having an average diameter of ∼2.2 ± 0.63 nm as represented by their size-distribution plot (Fig. 2e). The formation of these superstructures explains the exceptional photo-physical properties including very large Stokes shifts, excited state lifetimes in the range of microseconds, and the NIR emission even after having such a small cluster core composition.41 Due to the formation of the self-assemblies by the CuNCs, the intramolecular rotation and the vibration of the surface ligands get restricted which suppresses the non-radiative pathways and enhances the radiative pathways which leads to the highly intense PL, as mentioned before.48 Moreover, the PL in the assembled nanoclusters is the result of metallophilic interactions along with LMCT and LMMCT. Therefore, Cu⋯Cu distances play a major role in deciding the emission energy and other photo-physical properties of the nanocluster assemblies. Due to the formation of closely assembled ordered superstructures, inter-cluster and intra-cluster Cu⋯Cu distances shorten, resulting in the NIR emission of the nanoclusters.49 The three-dimensional cuboid-like morphology of the superstructures as revealed by the TEM images is also in agreement with the SEM analysis (Fig. 2f and g). The superstructures are discrete and three-dimensional as evident from the SEM images (Fig. 2f and g). Moreover, the SEM-EDX analysis of the as-prepared R-CuNC superstructures revealed the presence of Cu, N, and S which confirms the fact that these superstructures are the result of self-assembling of the CuNCs and eliminates all the other possibilities (Fig. S5†). The most possible reason behind the formation of such distinct and ordered superstructures is the non-covalent interactions such as π⋯π stacking and C–H⋯π interactions between the surface ligands (2-MPy) of the CuNCs. The π⋯ π and C–H⋯ π inter-cluster interactions are well known to assemble the nanoclusters into discrete superstructures, which in turn enhances the PL, and produces unique photo-physical features including NIR emission.17,20,50
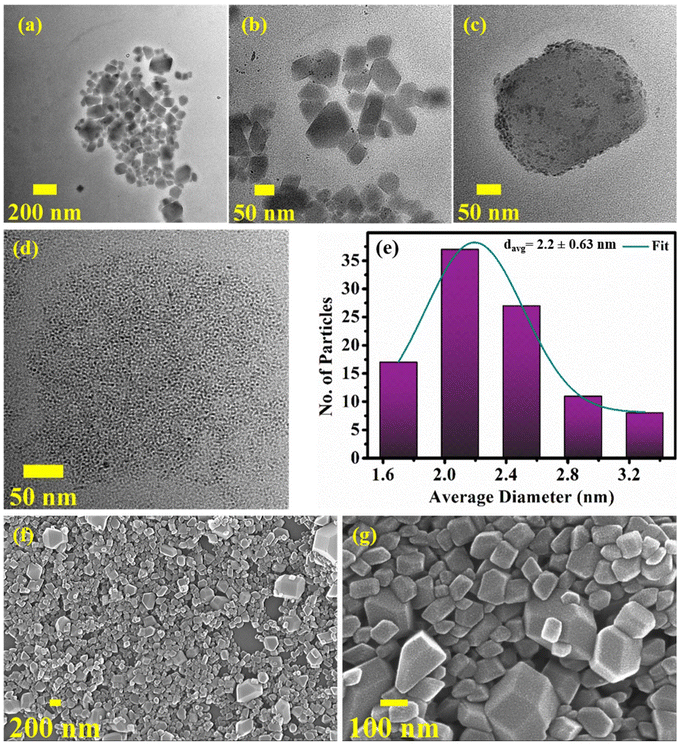 | ||
| Fig. 2 (a–d) TEM images of the R-CuNC superstructures at different scales; (e) size distribution plot of the R-CuNCs; and (f–g) SEM images of the as-prepared R-CuNCs in DMSO. | ||
Elucidation of the TADF mechanism for R-CuNCs
To establish the reason behind such a long excited state lifetime, we carried out time-resolved emission spectroscopy (TRES) measurements for the R-CuNCs. In time-gated measurements, the normalized TRES spectra at a 4 μs delay time overlapped well with the steady-state emission spectra of the R-CuNCs, which suggested the possibility of TADF in our system51,52 (Fig. 3a). The TADF mechanism is operational only when there is a stable triplet state available for the emitter for favorable intersystem crossing (ISC) from the singlet state to the triplet state, and the energy gap between both the states should be sufficiently less to favor the reverse inter-system crossing (RISC), thus generating delayed fluorescence with a long excited state lifetime.51,52 To confirm the process of TADF in our system, temperature-dependent PL studies were done. For a TADF emitter, on increasing the temperature, the rate of RISC increases which in turn increases the PL intensity accompanied by a blue shift in the emission maxima.32,53 The temperature-dependent emission profile of the as-prepared R-CuNCs is shown in Fig. 3b. On increasing the temperature from 278.65 K to 348.15 K for the R-CuNCs, a prominent increase in the PL intensity was observed (Fig. 3c), accompanied by a blue shift in the emission maxima of ∼30 nm, from 754 nm to 725 nm (Fig. S6†). The blue shift in the emission maxima upon increasing the temperature again insinuated the TADF mechanism.54 The three-dimensional emission spectra of the R-CuNCs as a function of temperature depicting the enhancement in the emission intensity upon increasing the temperature along with the blue shift in the emission maxima are shown in Fig. 3d. Furthermore, to confirm the TADF mechanism for the R-CuNCs, temperature-dependent lifetime measurements were conducted using a 355 nm spectral-LED source. A sharp decrease in the emission decay time was observed upon increasing the temperature, as shown in Fig. 3e and Table S2.† The lifetime data were fitted using the Boltzmann equation derived from the TADF model:32,33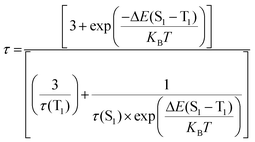 | (iii) |
Characterization of O-CuNCs
Furthermore, to establish the structure–property relationship between the morphology of the superstructures and the spectroscopic signatures of the CuNCs, and to have a profound insight into the features of CuNC superstructures, we performed the synthesis in a slightly less polar solvent, i.e., MeOH. Although orange-emitting CuNCs (termed O-CuNCs hereafter) were successfully prepared using MeOH as the solvent, the extremely low stability of the clusters was the primary concern. Interestingly, the introduction of chloroform (CHCl3) into MeOH had a beneficial impact on the stability of the O-CuNCs. A novel combination of the solvents, in an appropriate ratio (v/v), provided a more favorable environment to circumvent the stability issue of the CuNCs. The CuNCs when prepared at an optimized MeOH![[thin space (1/6-em)]](https://www.rsc.org/images/entities/char_2009.gif) :
:![[thin space (1/6-em)]](https://www.rsc.org/images/entities/char_2009.gif) CHCl3 (v/v) ratio of 4
CHCl3 (v/v) ratio of 4![[thin space (1/6-em)]](https://www.rsc.org/images/entities/char_2009.gif) :
:![[thin space (1/6-em)]](https://www.rsc.org/images/entities/char_2009.gif) 6 were found to have the highest PL intensity (Fig. S8a†) and more stability than others. The reaction conditions were further optimized by varying the reaction temperature and metal-to-ligand concentration (Fig. S8b and c†). The CuNCs display the highest PL intensity when synthesized at 45 °C and at a metal-to-ligand concentration of 4
6 were found to have the highest PL intensity (Fig. S8a†) and more stability than others. The reaction conditions were further optimized by varying the reaction temperature and metal-to-ligand concentration (Fig. S8b and c†). The CuNCs display the highest PL intensity when synthesized at 45 °C and at a metal-to-ligand concentration of 4![[thin space (1/6-em)]](https://www.rsc.org/images/entities/char_2009.gif) :
:![[thin space (1/6-em)]](https://www.rsc.org/images/entities/char_2009.gif) 4 (Fig. S8b and c†). Moreover, the as-prepared CuNCs were completely soluble in the MeOH-CHCl3 solvent mixture, forming a transparent yellow-colored solution (rather than being colloidal as observed in the former case of the R-CuNCs).
4 (Fig. S8b and c†). Moreover, the as-prepared CuNCs were completely soluble in the MeOH-CHCl3 solvent mixture, forming a transparent yellow-colored solution (rather than being colloidal as observed in the former case of the R-CuNCs).
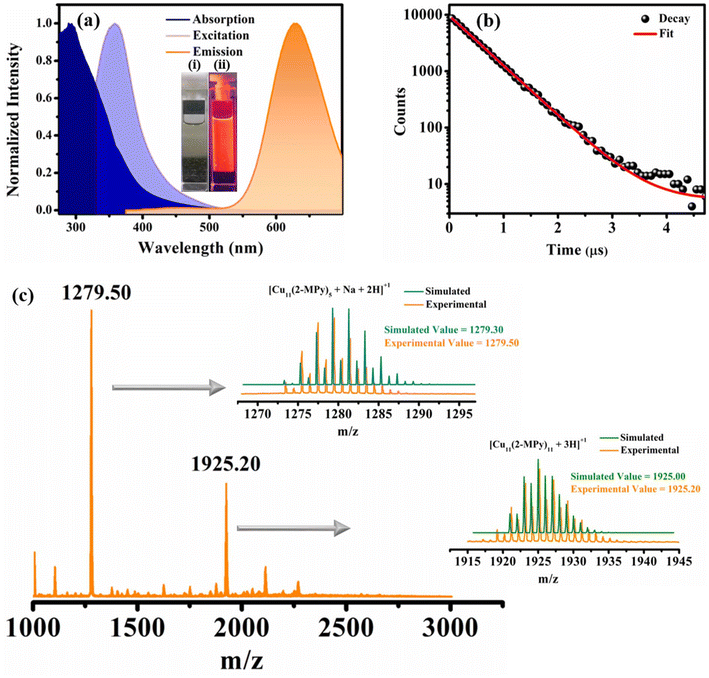
The distinct characteristic surface-plasmon resonance (SPR) band of larger copper nanoparticles (550–650 nm) was absent in the UV-Vis spectrum which convincingly supports that the O-CuNCs obtained through our synthetic protocol were significantly small in size and the system is free from larger size metal nanoparticles27,36 (Fig. 4a). Furthermore, the CuNCs exhibited orange emission with an emission maximum at 630 nm, when excited at 360 nm, resulting in a relatively smaller Stokes shift of around ∼270 nm (Fig. 4a) as against 375 nm for the R-CuNCs. The excitation-dependent emission profile of the O-CuNCs also corroborates the homogeneous nature of the CuNCs and that the maximum PL intensity is obtained when excited at 360 nm (Fig. S9a†). Moreover, the O-CuNCs were highly photostable as they showed an unaltered PL intensity even after subjecting them to the excitation source for ∼30 minutes (Fig. S9b†). Control experiments show that the emission at 630 nm is exclusively the result of the formation of O-CuNCs (Fig. S10†). Excited state lifetime measurements were carried out using a 355 nm spectral LED source. The CuNCs again exhibited a long excited state lifetime of around ∼490 ns (Fig. 4b and Table S5†), which is 1/10th the average excited state lifetime of the R-CuNCs (Tables S5 and S1†). Such a drastic change in the photo-physical properties upon changing the solvent environment during their preparation triggered us to study this unexplored area.
The ESI-MS analysis of the O-CuNCs (Fig. 4c) represents cluster core composition similar to that of the R-CuNCs. The isotopic pattern for the most intense mass peak centered at an m/z value of 1279.50 shows that the O-CuNCs also have the composition as [Cu11(2-MPy)5 + Na + 2H]+, along with that the isotopic pattern of another mass peak at an m/z value of 1925.20 matches well with the isotopic pattern corresponding to the composition [Cu11(2-MPy)11 + 3H]+ (right panel in Fig. 4c). These attest that although both the R-CuNCs and O-CuNCs have the same compositions, they exhibit different photo-physical signatures which can be ascribed to the different solvent environments. However, it is not necessary that the same chemical compositions of cluster cores always lead to the same geometries; different geometries for the same cluster core composition have also been reported.57–60 Consequently, it is highly probable that different cluster core geometries may lead to different emission energies. However, several other factors may lead to distinct emission energies of the R-CuNCs and O-CuNCs other than the different geometries of the cluster cores. The crystal packing and morphology of the assemblies also play a seminal role in determining the emission energies of the nanoclusters.61
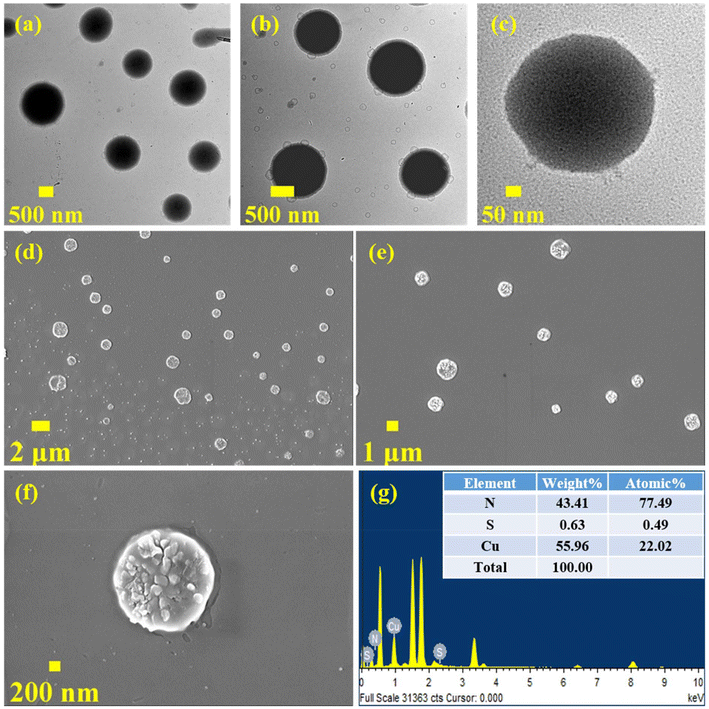
Interestingly, the O-CuNCs also assembled in the form of superstructures but showcased a morphology different from the R-CuNCs as evident from the TEM images of the O-CuNCs (Fig. 5a and b). The O-CuNCs acquire a unique spherical morphology to form their superstructures, as against the cuboid-like geometry observed for the R-CuNCs.
These superstructures are discrete, highly ordered, and homogeneous. The change in the morphology of the superstructures along with the drastic change in the photo-physical features of the CuNCs on changing the solvent used during their preparation may be attributed to the fact that solvent variation causes changes in (a) intra-cluster and inter-cluster interactions and (b) solvent–cluster interactions. Thus, solvent variation can affect the π–π and C–H⋯π interactions between the ligands, which in turn may affect the process of self-assembly of the MNCs. Previous reports suggest that solvent variation can also lead to different morphologies and crystal packing of the nanocluster due to facile inter-cluster interactions in one system from those of another.61 Previously, we have also reported that the CuNCs form spherical superstructures in protic solvents supported by the inter-ligand H-bond interactions, which can be completely disassembled in other aprotic solvents, leading to a drastic change in their photophysical properties.19 Moreover, solvophobic interactions are also known to modulate the morphology of the aggregates within a few hours due to the enhancement in the π–π stacking interactions in one solvent compared to another.62 Additionally, the solvent system may interact with the MNCs and can change the HOMO–LUMO energy levels, resulting in a change of their spectroscopic properties as evident from their emission wavelengths.63,64 The spherical morphology of the O-CuNC superstructures was further confirmed by FE-SEM analysis, as displayed in Fig. 5d–f. SEM-EDX analysis shows the presence of copper, nitrogen, and sulphur in the CuNC superstructures, which corroborates the fact that these superstructures are the result of the formation of assemblies by the O-CuNCs and also invalidates all the other possibilities (Fig. 5g).
Excited state dynamics of O-CuNCs
To explore the excited state dynamics of the O-CuNCs, we performed the TRES measurements using a 355 nm spectral LED source. The TRES spectra at a delay time of ∼500 ns overlapped well with the steady-state emission spectra of the O-CuNCs (Fig. 6a).51 The overlap between the TRES spectra at a 500 ns delay time, and the steady-state emission spectra again indicated the TADF mechanism for the O-CuNCs. Therefore, to investigate the excited state decay mechanism, we performed temperature-dependent PL studies for the O-CuNCs. Upon increasing the temperature from 273.15 K to 313.15 K, a sequential increment in the PL intensity of the O-CuNCs was observed. However, on further increasing the temperature to 348.15 K, there was a smooth decrease in the PL intensity (Fig. 6b). The bell-shaped curve obtained for the PL intensity (Fig. 6c) upon increasing the temperature is also a signature of the TADF mechanism.32 The increase in the PL intensity upon increasing the temperature is due to the increased population of the S1 state from the T1 state at higher temperatures. Moreover, at very high temperatures, the thermal depopulation of the excited state of the emitter results in the decrement of the PL intensity.32 The increase in the PL intensity of the O-CuNCs was accompanied by a blue shift in the emission maxima (Fig. S11†). Upon increasing the temperature from 273.15 K to 348.15 K, the emission maxima of the O-CuNCs shifted from 635 nm to 624 nm with a blue shift of ∼11 nm which was found to be lower than the blue shift for the R-CuNCs (∼30 nm), indicating the higher efficiency of RISC in the R-CuNCs. Subsequently, to confirm the TADF mechanism for the O-CuNCs and also to investigate the reason behind the variation in the photo-physical features of the O-CuNCs from the R-CuNCs, temperature-dependent lifetime measurements were performed for the O-CuNCs (Fig. 6d and Table S6†).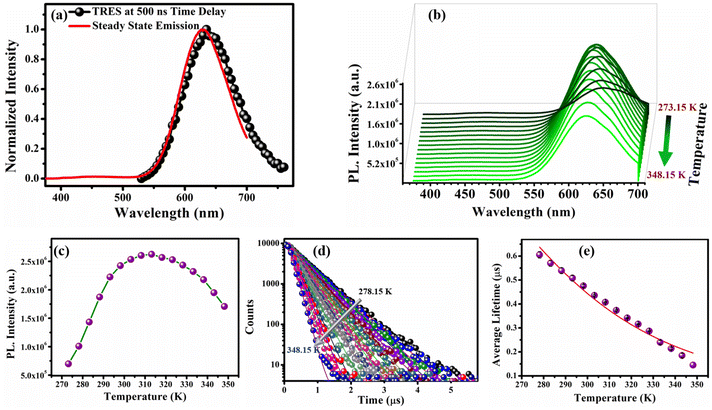 | ||
| Fig. 6 (a) TRES spectra of the O-CuNC superstructures at a time delay of 500 ns exactly overlapping with the steady-state emission spectra; (b) temperature-dependent photoluminescence profiles of the O-CuNCs as a function of increasing temperature from 273.15 K to 348.15 K; (c) maximum PL intensity vs. temperature profile of the O-CuNCs; (d) temperature-dependent photoluminescence lifetime decay of the O-CuNCs; and (e) average lifetime vs. temperature plot of the O-CuNCs fitted with the Boltzmann equation (eqn (iii)) (error bars were determined based on three independent experiments). | ||
An exponential decrement in the average lifetime upon increasing the temperature was observed for the O-CuNCs as well. Upon fitting the average lifetime vs. temperature curve with the TADF model, the energy separation for the triplet and singlet states was found to be 199.03 meV with τ(T1) and τ(S1) values of 1.3 μs, and 0.10 ns, respectively (Fig. 6e and Table S7†). The singlet–triplet energy gap for the O-CuNCs was estimated to be much higher as compared to the R-CuNCs. Therefore, upon changing the solvent system from a polar system (H2O/DMSO) to a less polar mixed solvent system (MeOH and CHCl3), the extent of stabilization of the excited states for both systems also changes. Consequently, this leads to a difference in the energy separation between the singlet and triplet states, affecting the TADF mechanism, and hence affecting the photo-physical properties of the CuNCs as well. This study infers that just by changing the solvent environment around the CuNCs, their supramolecular architecture can be changed. Using this concept, the separation between the excited singlet and triplet states can also be modulated which in turn can be utilized in designing and fabricating various optoelectronic devices.
Effect of electronic properties of the ligand on the modulation of the ΔEST value for CuNCs
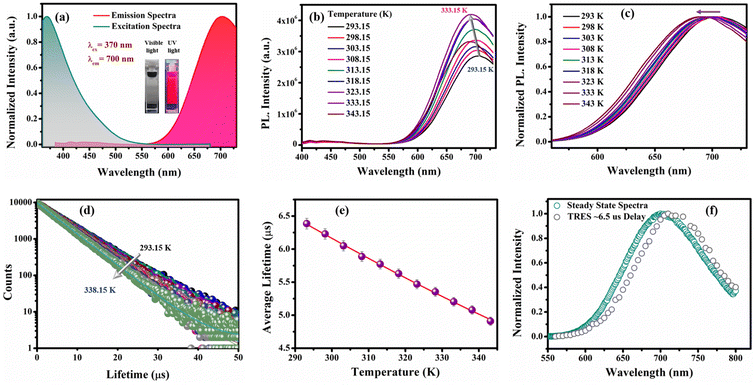
To investigate the effect of the electronic properties of the ligands on the ΔE(S1–T1) value of the as-prepared CuNCs, the R-CuNCs were prepared by using two other derivatives of 2-MPy having electron-withdrawing groups at the 5th position, namely 5-Cl-2-mercaptopyridine (MPyCl) and 5-Br-2-mercaptopyridine (MPyBr). The photo-physical features of the CuNCs obtained from the chlorine derivative are shown in Fig. 7.The UV-Vis spectra of the CuNCs obtained using the chlorine derivative (i.e., Cl-CuNCs) are shown in Fig. S12a.† The featureless absorption spectra without any signature of the surface plasmon resonance band confirm the formation of CuNCs, and the system is free from larger-size nanoparticles (Fig. S12†).27,36 The Cl-CuNCs exhibit the emission maxima at 700 nm and the excitation maxima at 370 nm, with a large Stokes shift of ∼330 nm (Fig. 7a). The excitation-dependent emission spectra of the Cl-CuNCs are depicted in Fig. S12b,† highlighting the homogeneous nature of the as-prepared Cl-CuNCs. Moreover, the Cl-CuNCs also display a temperature-dependent photoluminescence behavior, similar to that of the R-CuNCs (Fig. 7b). An increment in the PL intensity upon increasing the temperature from 293.15 K to 333.15 K along with a blue shift was observed, indicating the TADF nature of the photoluminescence (Fig. S13a and b†). The normalized plot for the temperature-dependent PL intensity also represents a blue shift in the emission maxima upon increasing the temperature (Fig. 7c). Furthermore, to quantify the ΔES1–T1 value for the Cl-CuNCs, temperature-dependent lifetime measurements were also performed. As depicted in Fig. 7d and e, upon increasing the temperature from 293.15 K to 338.15 K, a sequential decrement in the average lifetime values was observed (Table S8†). Furthermore, the ΔES1–T1 values were calculated by fitting the average lifetime vs. temperature plot mentioned in eqn (iii).32,33 On fitting the average lifetime vs. temperature data, ΔE(S1–T1) was found to be equal to 111.5 meV which is much less than 370 meV, indicating an efficient TADF process for the Cl-CuNCs, and the τ(T1) and τ(S1) values were found to be equal to 9.46 μs and 77.86 ns, respectively (Table S9†). Furthermore, to confirm the TADF mechanism for the as-prepared Cl-CuNCs, TRES measurements were performed. The overlap between the TRES plot at an ∼6.5 μs delay time and the steady-state spectra of the Cl-CuNCs confirms the involvement of delayed fluorescence in the photoluminescence mechanism for the system (Fig. 7f).51
Similarly, all the photophysical studies were performed for the CuNCs prepared using the bromine derivative, i.e., the Br-CuNCs as represented in Fig. S14–S16.† The Br-CuNCs exhibit the excitation maxima at 370 nm and the emission maxima at 700 nm similar to those of the Cl-CuNCs (Fig. S14b†). An increment in the PL intensity along with the blue shift upon increasing the temperature was also observed for the Br-CuNCs (Fig. S15†). The temperature-dependent lifetime measurements for the Br-CuNCs are shown in Fig. S16 and Table S10.† The ΔE(S1–T1) value was found to be equal to 67.4 meV for the Br-CuNCs, and the τ(T1) and τ(S1) values were found to be equal to 15.03 μs and 246 ns, respectively (Table S11†). A comparative representation of the fitting parameters obtained from the average lifetime vs. temperature plot for the R-CuNCs, Cl-CuNCs, and Br-CuNCs is shown in Table 1.
| CuNCs | ΔES1–T1 (meV) | τ(T1) (μs) | τ(S1) (ns) |
|---|---|---|---|
| R-CuNCs | 58.2 | 11.6 | 177.8 |
| Br-CuNCs | 67.4 | 15.03 | 246.5 |
| Cl-CuNCs | 111.5 | 9.5 | 77.9 |
From Table 1, we can conclude that on increasing the electron-withdrawing tendency of the ligand, the ΔE(S1–T1) value for the CuNCs increases. The more electron-donating ligand results in enhanced ligand-to-metal charge transfer and ligand-to-metal-to-metal charge transfer, which in turn reduces the energy difference between the excited triplet and excited singlet states, thus enhancing the TADF efficiency.
Conclusions
We prepared 2-mercaptopyridine-templated CuNCs in two different solvent systems, the first one in water (termed R-CuNCs) and the other one in a mixed solvent system of MeOH and CHCl3 (termed O-CuNCs). Both the systems exhibit entirely different photo-physical properties and morphological signatures; the R-CuNCs being NIR emitting with the emission maxima at 745 nm and the O-CuNCs with orange emission having the emission maxima at 630 nm. Along with their solid-state emission, the R-CuNCs when studied in DMSO acquire a cuboid-shaped morphology forming discrete superstructures and retaining their spectroscopic signatures. In contrast, the O-CuNCs acquire a spherical morphology for their superstructures in the mixed solvent system. From the ESI-mass analysis data, it was found that both the CuNCs had the same core compositions but exhibited distinct photo-physical features due to the different solvent environments around them. Furthermore, we established that both the systems exhibit the TADF mechanism, with the difference in their excited state energy separation values being attributed to their varying photo-physical properties. The R-CuNCs exhibit an exceptionally small singlet–triplet energy gap (ΔE(S1–T1)) of ∼58.2 meV, whereas the O-CuNCs were characterized by an ΔE(S1–T1) value of ∼200 meV. Thereafter, the study reveals that the electronic structure of the ligand can be used to modulate the energy gap between the excited singlet and triplet states (ΔE(S1–T1)). The CuNCs formed by using electron-rich ligands were found to have the lowest ΔE(S1–T1) value. Thus, the present investigation reveals a unique methodology to prepare systems with enhanced photophysical properties that can serve as NIR TADF emitters without the use of any solid-state matrices harvesting both the singlet and triplet states.Data availability
All the supporting data for the manuscript are provided in the ESI,† including reaction condition optimization data, spectroscopic characterization of the R-CuNCs and O-CuNCs, FT-IR spectra, SEM-EDX data, lifetime data tables, TADF model fitting parameter tables, control experiments, photo-physical studies and characterization of the Cl-CuNCs and Br-CuNCs.Author contributions
SA, DS, and SM conceptualized the project. SA, DS, and AG carried out all the experiments and analyzed the data. SA, DS, and SM compiled the data and wrote the manuscript.Conflicts of interest
There are no conflicts to declare.Acknowledgements
SA and DS thank IISER Bhopal and AG thanks INSPIRE, Government of India for providing a fellowship. SM thanks SERB-ANRF, Government of India (Project No.: SERB-CRG/2023/000473) for financial assistance. We also thank the FIST facility, Department of Chemistry, IISER Bhopal for TEM measurements. SA and DS thank Mr. Srimanta Gogoi, Department of Chemistry for his help in analyzing some of the TADF data.References
- C. T. Jackson, S. Jeong, G. F. Dorlhiac and M. P. Landry, iScience, 2021, 24, 102156 Search PubMed.
- T. Jia, Z.-J. Guan, C. Zhang, X.-Z. Zhu, Y.-X. Chen, Q. Zhang, Y. Yang and D. Sun, J. Am. Chem. Soc., 2023, 145, 10355–10363 Search PubMed.
- J. Cao, B. Zhu, K. Zheng, S. He, L. Meng, J. Song and H. Yang, Front. Bioeng. Biotechnol., 2019, 7, 487 Search PubMed.
- J. Mu, M. Xiao, Y. Shi, X. Geng, H. Li, Y. Yin and X. Chen, Angew. Chem., Int. Ed., 2022, 61, e20211472 Search PubMed.
- A. P. Litvin, I. V. Martynenko, F. Purcell-Milton, A. V. Baranov, A. V. Fedorov and Y. K. Gun'ko, J. Mater. Chem. A, 2017, 5, 13252–13275 Search PubMed.
- X. Li, Y. Liu, X. Song, H. Wang, H. Gu and H. Zeng, Angew. Chem., Int. Ed., 2015, 54, 1759–1764 Search PubMed.
- S. Chakraborty, A. Nandy, S. Ghosh, N. K. Das, S. Parveen, S. Datta and S. Mukherjee, Analyst, 2021, 146, 1455–1463 Search PubMed.
- X. Du and R. Jin, ACS Nano, 2019, 13, 7383–7387 Search PubMed.
- P. Mahato, S. Shekhar, R. Yadav and S. Mukherjee, Nanoscale, 2023, 16, 806–820 Search PubMed.
- C. Ding, Y. Xu, Y. Zhao, H. Zhong and X. Luo, ACS Appl. Mater. Interfaces, 2018, 10, 8947–8954 Search PubMed.
- S. Shekhar, S. Shrivastava, A. Kabeer Kurukkan, P. Sagarika, S. Pramanik, C. Sahi and S. Mukherjee, J. Photochem. Photobiol., A, 2023, 436, 114403 Search PubMed.
- S. Shekhar, R. Sarker, P. Mahato, S. Agrawal and S. Mukherjee, Nanoscale, 2023, 15, 15368–15381 Search PubMed.
- H. Lu, H. Hou, Y.-C. Hou, Z. Zheng, Y. Ma, Z. Zhou, X. Guo, Q.-J. Pan, Y. Wang, Y. Qian, J.-Q. Wang and J. Lin, J. Am. Chem. Soc., 2022, 144, 3449–3457 Search PubMed.
- H. T. Lin, K. B. Cai, H. Y. Huang, T. N. Lin, J. L. Shen, C. A. J. Lin and C. T. Yuan, J. Lumin., 2017, 187, 269–273 Search PubMed.
- M. J. A. Talite, H. T. Lin, Z. C. Jiang, T. N. Lin, H. Y. Huang, E. Heredia, A. Flores, Y. C. Chao, J. L. Shen, C. A. J. Lin and C. T. Yuan, Nanotechnology, 2016, 27, 345701 Search PubMed.
- J. V. Rival, P. Mymoona, K. M. Lakshmi, Nonappa, T. Pradeep and E. S. Shibu, Small, 2021, 17, 2005718 Search PubMed.
- M. Jash, A. Jana, A. K. Poonia, E. Khatun, P. Chakraborty, A. Nagar, T. Ahuja, K. V. Adarsh and T. Pradeep, Chem. Mater., 2023, 35, 313–326 Search PubMed.
- L. Shi, L. Zhu, J. Guo, L. Zhang, Y. Shi, Y. Zhang, K. Hou, Y. Zheng, Y. Zhu, J. Lv, S. Liu and Z. Tang, Angew. Chem., Int. Ed., 2017, 56, 15397–15401 Search PubMed.
- S. Agrawal, S. Rai, P. Mahato, A. Ali and S. Mukherjee, J. Phys. Chem. Lett., 2024, 15, 4880–4889 Search PubMed.
- K. S. Sugi, A. P. Sandra, Nonappa, D. Ghosh, J. S. Mohanty, M. Paulthangam Kannan, B. S. Sooraj, P. Srikrishnarka, J. Roy, W. A. Dar and T. Pradeep, Nanoscale, 2023, 15, 11927–11934 Search PubMed.
- J. V. Rival, Nonappa and E. S. Shibu, ACS Appl. Mater. Interfaces, 2020, 12, 14569–14577 Search PubMed.
- Q. Li, C. J. Zeman IV, G. C. Schatz and X. W. Gu, ACS Nano, 2021, 15, 16095–16105 Search PubMed.
- Q. Yao, Z. Wu, Z. Liu, Y. Lin, X. Yuan and J. Xie, Chem. Sci., 2021, 12, 99–127 Search PubMed.
- P. Mahato, K. Mandal, S. Agrawal, D. Chopra and S. Mukherjee, J. Phys. Chem. Lett., 2024, 15, 461–470 Search PubMed.
- A. Baghdasaryan and T. Bürgi, Nanoscale, 2021, 13, 6283–6340 Search PubMed.
- S. Nematulloev, R. W. Huang, J. Yin, A. Shkurenko, C. Dong, A. Ghosh, B. Alamer, R. Naphade, M. N. Hedhili, P. Maity, M. Eddaoudi, O. F. Mohammed and O. M. Bakr, Small, 2021, 17, e2006839 Search PubMed.
- S. Shekhar, P. Mahato, R. Yadav, S. D. Verma and S. Mukherjee, ACS Sustainable Chem. Eng., 2022, 10, 1379–1389 Search PubMed.
- S. Lee, M. S. Bootharaju, G. Deng, S. Malola, W. Baek, H. Häkkinen, N. Zheng and T. Hyeon, J. Am. Chem. Soc., 2020, 142, 13974–13981 Search PubMed.
- L. L.-M. Zhang and W.-Y. Wong, Aggregate, 2023, 4, e266 Search PubMed.
- O. Fuhr, S. Dehnen and D. Fenske, Chem. Soc. Rev., 2013, 42, 1871–1906 Search PubMed.
- L. L.-M. Zhang and T. C. W. Mak, Angew. Chem., Int. Ed., 2017, 56, 16228–16232 Search PubMed.
- L. L.-M. Zhang, G. Zhou, G. Zhou, H.-K. Lee, N. Zhao, O. V. Prezhdo and T. C. W. Mak, Chem. Sci., 2019, 10, 10122–10128 Search PubMed.
- C. Dutta, S. Maniappan and J. Kumar, Chem. Sci., 2023, 14, 5593–5601 Search PubMed.
- J. Shen, Z. Wang, D. Sun, G. Liu, S. Yuan, M. Kurmoo and X. Xin, Nanoscale, 2017, 9, 19191–19200 Search PubMed.
- S. Pramanik, S. Chithra, S. Rai, S. Agrawal, D. Shil and S. Mukherjee, J. Phys. Chem. B, 2023, 127, 6608–6619 Search PubMed.
- P. Mahato, A. S. Thomas, R. Yadav, S. Rai, S. Shekhar and S. Mukherjee, Chem. – Asian J., 2023, 18, e202300442 Search PubMed.
- Z. Wu, J. Liu, Y. Gao, H. Liu, T. Li, H. Zou, Z. Wang, K. Zhang, Y. Wang, H. Zhang and B. Yang, J. Am. Chem. Soc., 2015, 137, 12906–12913 Search PubMed.
- E. Akyüz, F. B. Şen, M. Bener, K. S. Başkan and R. Apak, Talanta, 2020, 208, 120425 Search PubMed.
- Y. Peng, X. Huang and F. Wang, Chem. Commun., 2021, 57, 13012–13015 Search PubMed.
- P. Chandrashekar, G. Sardar, T. Sengupta, A. C. Reber, P. K. Mondal, D. Kabra, S. N. Khanna, P. Deria and S. Mandal, Angew. Chem., Int. Ed, 2024, 63, e202317345 Search PubMed.
- Y.-E. Shi, J. Ma, A. Feng, Z. Wang and A. L. Rogach, Aggregate, 2021, 2, e112 Search PubMed.
- P. Mahato, S. Shekhar, S. Agrawal, S. Pramanik and S. Mukherjee, ACS Appl. Nano Mater., 2022, 5, 7571–7579 Search PubMed.
- Y. Liu, D. Yao and H. Zhang, ACS Appl. Mater. Interfaces, 2018, 10, 12071–12080 Search PubMed.
- K. Basu, S. Paul, R. Jana, A. Datta and A. Banerjee, ACS Sustainable Chem. Eng., 2019, 7, 1998–2007 Search PubMed.
- R. Gupta, S. Agrawal, S. Rai, J. Sarkar, S. Kumari, D. Shil and S. Mukherjee, ACS Appl. Opt. Mater., 2024, 2, 1880–1890 Search PubMed.
- A. Chatterjee and P. Purkayastha, Mater. Adv., 2021, 2, 1343–1350 Search PubMed.
- K. G. Stamplecoskie and P. V. Kamat, J. Am. Chem. Soc., 2014, 136, 11093–11099 Search PubMed.
- T. Chen, Q. Yao, R. R. Nasaruddin and J. Xie, Angew. Chem., Int. Ed., 2019, 58, 11967–11977 Search PubMed.
- N. Goswami, Q. Yao, Z. Luo, J. Li, T. Chen and J. Xie, J. Phys. Chem. Lett., 2016, 7, 962–975 Search PubMed.
- Z. Wu, J. Liu, Y. Gao, H. Liu, T. Li, H. Zou, Z. Wang, K. Zhang, Y. Wang, H. Zhang and B. Yang, J. Am. Chem. Soc., 2015, 137, 12906–12913 Search PubMed.
- S. Kuila, S. Garain, G. Banappanavar, B. C. Garain, D. Kabra, S. K. Pati and S. J. George, J. Phys. Chem. B, 2021, 125, 4520–4526 Search PubMed.
- F. Ni, Z. Zhu, X. Tong, M. Xie, Q. Zhao, C. Zhong, Y. Zou and C. Yang, Chem. Sci., 2018, 9, 6150–6155 Search PubMed.
- Z.-R. Yuan, Z. Wang, B.-L. Han, C.-K. Zhang, S.-S. Zhang, Z.-Y. Zhu, J.-H. Yu, T.-D. Li, Y.-Z. Li, C.-H. Tung and D. Sun, Angew. Chem. Int., Ed., 2022, 61, e202211628 Search PubMed.
- M. J. Leitl, V. A. Krylova, P. I. Djurovich, M. E. Thompson and H. Yersin, J. Am. Chem. Soc., 2014, 136, 16032–16038 Search PubMed.
- X. Li, G. Baryshnikov, C. Deng, X. Bao, B. Wu, Y. Zhou, H. Ågren and L. Zhu, Nat. Commun., 2019, 10, 731 Search PubMed.
- M. Chapran, P. Pander, M. Vasylieva, G. Wiosna-Salyga, J. Ulanski, F. B. Dias and P. Data, ACS Appl. Mater. Interfaces, 2019, 11, 13460–13471 Search PubMed.
- R. Langer, M. Yadav, B. Weinert, D. Fenske and O. Fuhr, Eur. J. Inorg. Chem., 2013, 2013, 3623–3631 Search PubMed.
- P. V. V. N. Kishore, D.-R. Shi, J.-H. Liao, A. K. Gupta and C. W. Liu, Inorg. Chim. Acta, 2019, 496, 119068 Search PubMed.
- P.-K. Liao, C.-S. Fang, A. J. Edwards, S. Kahlal, J.-Y. Saillard and C. W. Liu, Inorg. Chem., 2012, 51, 6577–6591 Search PubMed.
- S. Biswas, A. Pal, M. K. Jena, S. Hossain, J. Sakai, S. Das, B. Sahoo, B. Pathak and Y. Negishi, J. Am. Chem. Soc., 2024, 146, 20937–20944 Search PubMed.
- A. Nag, P. Chakraborty, M. Bodiuzzaman, T. Ahuja, S. Antharjanam and T. Pradeep, Nanoscale, 2018, 10, 9851–9855 Search PubMed.
- S. Zhou, S. Zhang, H. Li, D. Sun, J. Zhang and X. Xin, ACS Appl. Nano Mater., 2021, 4, 10911–10920 Search PubMed.
- F. Qu, L. L. Dou, N. B. Li and H. Q. Luo, J. Mater. Chem. C, 2013, 1, 4008 Search PubMed.
- S. Wang, Q. Li, S. Yang, H. Yu, J. Chai and M. Zhu, Nanoscale, 2022, 14, 16647–16654 Search PubMed.
Footnote |
| † Electronic supplementary information (ESI) available. See DOI: https://doi.org/10.1039/d4nr03074e |
| This journal is © The Royal Society of Chemistry 2024 |

