 Open Access Article
An innovative chalcogenide transfer agent for improved aqueous quantum dot synthesis†
Guillaume
Petit
a,
Cedric
Malherbe
 b,
Pauline
Bianchi
 a and
Jean-Christophe M.
Monbaliu
 *ac
*ac
aCenter for Integrated Technology and Organic Synthesis (CiTOS), MolSys Research Unit, University of Liège, B-4000 Liège (Sart Tilman), Belgium. E-mail: jc.monbaliu@uliege.be; Web: https://www.citos.uliege.be/
bMass Spectrometry Laboratory, MolSys Research Unit, University of Liège, B-4000 Liège (Sart Tilman), Belgium
cWEL Research Institute, Avenue Pasteur 6, B-1300 Wavre, Belgium
First published on 30th July 2024
Abstract
An innovative approach to chalcogenide precursor synthesis and their subsequent use for the production of CdX (X = S, Se, Te) quantum dots (QDs) in water under scalable and intensified continuous flow conditions is introduced. Herein, tris(2-carboxyethyl)phosphine (TCEP) is identified as a novel, efficient and water-soluble vehicle for chalcogenide transfer to form CdX QDs under aqueous conditions. A comprehensive exploration of critical process parameters, including pH, chalcogen excess, and residence time, utilizing a Design of Experiments (DoE) approach is reported. Reaction kinetics are investigated in real-time using a combination of in situ Raman spectroscopy and in-line 31P NMR spectroscopy. The conversion of TCEP into TCEP![[double bond, length as m-dash]](https://www.rsc.org/images/entities/char_e001.gif) X (X = S, Se, Te) species is seamlessly adapted to continuous flow conditions. TCEP
X (X = S, Se, Te) species is seamlessly adapted to continuous flow conditions. TCEP![[double bond, length as m-dash]](https://www.rsc.org/images/entities/char_e001.gif) X precursors are subsequently employed in the synthesis of CdX QDs. Scalability trials are successfully demonstrated, with experiments conducted at flow rates of up to 80 mL min−1 using a commercially available mesofluidic flow reactor with favorable metrics. Furthermore, biocompatible and aqueous CdSe/ZnS core–shell QDs are for the first time prepared in flow within a fully concatenated process. These results emphasize the potential for widespread biological or industrial applications of this novel protocol.
X precursors are subsequently employed in the synthesis of CdX QDs. Scalability trials are successfully demonstrated, with experiments conducted at flow rates of up to 80 mL min−1 using a commercially available mesofluidic flow reactor with favorable metrics. Furthermore, biocompatible and aqueous CdSe/ZnS core–shell QDs are for the first time prepared in flow within a fully concatenated process. These results emphasize the potential for widespread biological or industrial applications of this novel protocol.
Introduction
Since their discovery in the early 1980s, Quantum Dots (QDs) have attracted substantial attention from the scientific community. The recent Nobel Prize in Chemistry, awarded to Bawendi, Brus and Ekimov for their groundbreaking work related to QDs, clearly emphasizes their profound impact on the field.1–4 This interest is mainly due to their tunable optoelectronic properties. The band gap of these nanoscale semiconductors can be finely tuned by altering their size, a consequence of the quantum confinement effect on the electron–hole pairs generated within the particle. This confinement leads to an increase in the energy gap as the particle size decreases.3,5 This remarkable tunability renders QDs highly attractive for a wide range of applications, including photovoltaic devices,6,7 LEDs (QLEDs),8,9 photodetection,10,11 photocatalysts12,13 and in bioimaging.14,15Since the early 2000s, the emergence of new process technologies has set new grounds for the development of customizable and scalable methods for producing high-quality QDs. Continuous micro- and mesofluidic processes have already shown significant promise in this regard.16 It is now well-established among the Chemistry and Chemical Engineering communities that flow processes offer precise control over various reaction parameters, including heat transfer, mixing efficiency and residence time.17,18 All these reaction parameters are critical for the successful preparation of QDs.19–22
Among nanosized semiconductors, type II-VI QDs, and more specifically cadmium chalcogenides QDs (i.e., CdX where X = S, Se, Te) have been extensively studied.23 The hot-injection synthesis is the easiest method to translate under flow conditions for their preparation. This fast-heating process can be performed both in an organic or in an aqueous solvent. Most of these protocols involve the use of a soluble chalcogen transfer agent as well as stabilizing agents. Various types of chalcogen sources have been studied such as trioctylphosphochalcogenides,4,21,24–28 tributylphospho-chalcogenides20,29 and those chelated by the solvent itself (such as octadecene24). Some representative synthetic protocols under flow conditions for the preparation of QDs are illustrated in Fig. 1.
While generating QDs in an organic medium is notoriously easier to control, the use of a polar, lipophilic stabilizing agents limits their compatibility with downstream applications. This often requires additional steps, such as ligand exchange to enable compatibility with polar solvents.30,31 On the contrary, aqueous synthesis offers several advantages such as offering biocompatibility, requiring no additional ligand exchange steps, and operating at lower temperatures, compared to organic phase syntheses. However, aqueous protocols often lead to broader size distribution and lower quantum yield.32,33 Moreover, the relatively limited number of reports using aqueous protocols suggests that they are more cumbersome compared to their organic counterparts.
One of the challenges in synthesizing QDs in water lies in the preparation of a suitable reduced chalcogen source, which is essential for initiating the transfer to the cadmium precursor and producing QDs. All reported protocols involve an ex situ preparation of the chalcogenide precursor in batch, which could potentially lead to its decomposition. These protocols typically rely on the reduction of native chalcogens with ionic reductants such as NaBH4 to give air-sensitive ionic chalcogenides such as Na2S,19,34,35 Na2Se36–38 or NaHTe.37,39 Their decomposition prevents a seamless scale-up that continuous flow argues to offer. Moreover, reports dealing with the aqueous preparation of QDs in flow often do not report their photoluminescence quantum yield (PLQY).40
Capitalizing on these unmet needs for the scalable aqueous preparation of QDs and on our expertise in flow chemistry,41–46 a concrete solution for developing a robust and innovative water-soluble chalcogenide source is sought. Tris(2-carboxyethyl)phosphine (TCEP) emerged as a highly effective water-soluble vehicle for reduced chalcogens to yield CdX (X = S, Se, Te) QDs. The impact of various parameters such as pH, chalcogen excess, and residence time on the conversion toward TCEP![[double bond, length as m-dash]](https://www.rsc.org/images/entities/char_e001.gif) X is explored through a Design of Experiments (DoE) approach. The reduction kinetics and the formation of TCEP
X is explored through a Design of Experiments (DoE) approach. The reduction kinetics and the formation of TCEP![[double bond, length as m-dash]](https://www.rsc.org/images/entities/char_e001.gif) X species are studied via in situ Raman spectroscopy. This reaction is then successfully adapted to continuous flow conditions with in-line low-field 31P NMR monitoring. Subsequently, these novel water-soluble chalcogenide precursors are assessed for the synthesis of CdX QDs. Furthermore, the long-term process stability and scalability are demonstrated, with trials conducted at flow rates up to 80 mL min−1 using a commercial mesofluidic flow reactor. The results demonstrate that this intensified continuous flow aqueous process provides stable CdX QDs with short reaction times and high productivity. Additionally, in situ generation of chalcogenide precursors in flow prevents their degradation. Biocompatible CdSe/ZnS core–shell QDs are also produced within 7.25 min in a fully concatenated process. These efforts yield unprecedented process metrics for aqueous QD synthesis.
X species are studied via in situ Raman spectroscopy. This reaction is then successfully adapted to continuous flow conditions with in-line low-field 31P NMR monitoring. Subsequently, these novel water-soluble chalcogenide precursors are assessed for the synthesis of CdX QDs. Furthermore, the long-term process stability and scalability are demonstrated, with trials conducted at flow rates up to 80 mL min−1 using a commercial mesofluidic flow reactor. The results demonstrate that this intensified continuous flow aqueous process provides stable CdX QDs with short reaction times and high productivity. Additionally, in situ generation of chalcogenide precursors in flow prevents their degradation. Biocompatible CdSe/ZnS core–shell QDs are also produced within 7.25 min in a fully concatenated process. These efforts yield unprecedented process metrics for aqueous QD synthesis.
Results and discussion
Optimization of the preparation of TCEP![[double bond, length as m-dash]](https://www.rsc.org/images/entities/h3_char_e001.gif) X
X
Since its initial description by Whitesides47 in 1991, TCEP has found widespread synthetic utilities for reducing disulfide bonds in biochemistry, peptide chemistry and desulfurization/deselenization reactions.48–55 Subsequently, TCEP's utility was broadened to the reduction of various organic functional groups56,57 and for the coordination of metal cations.58 The use of TCEP in QDs synthesis, however, remains undocumented, either as chalcogen reducing agent or stabilizing phosphine. The initial phase of the project therefore aimed to demonstrate the adaptability of TCEP for reducing under aqueous conditions three key chalcogens (sulfur, selenium and tellurium) for the preparation of CdX QDs.
Preliminary experiments highlighted a stronger resistance toward air oxidation compared to common sodium-based chalcogenide precursors (Section S4.4.1 in the ESI†). Early trials also emphasized a substantial effect of the pH on the outcomes. Indeed, TCEP is a phosphine compound bearing up to 4 exchangeable protons: 3 on the carboxylic acid moieties (pKa = 2.99, 3.67, 4.36)59 and 1 on the phosphorus center itself (pKa = 7.66)59 (Fig. 2a). The latter proton plays the most influential role in modulating TCEP's reactivity.58,59
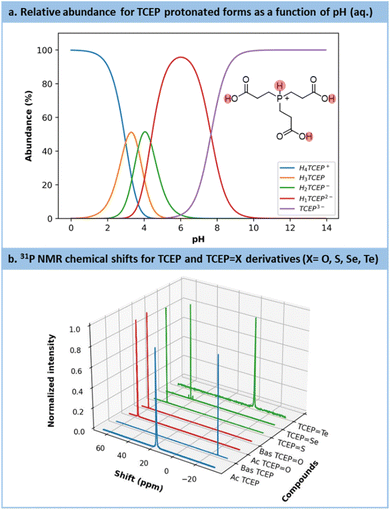 | ||
Fig. 2 (a) Calculation of the protonation distribution of TCEP species based on the pKa.45 (b) Chemical shifts for each TCEP derivates: blue = reagents (TCEP acid (Ac) and basic (Bas) forms), red = side product (TCEP![[double bond, length as m-dash]](https://www.rsc.org/images/entities/char_e001.gif) O acid (Ac) and basic (Bas) forms) and green = the products of interest (TCEP O acid (Ac) and basic (Bas) forms) and green = the products of interest (TCEP![[double bond, length as m-dash]](https://www.rsc.org/images/entities/char_e001.gif) S, TCEP S, TCEP![[double bond, length as m-dash]](https://www.rsc.org/images/entities/char_e001.gif) Se, TCEP Se, TCEP![[double bond, length as m-dash]](https://www.rsc.org/images/entities/char_e001.gif) Te). Te). | ||
The substantial impact of pH on TCEP's inherent features becomes evident when comparing the 31P NMR chemical shifts (Fig. 2b, blue spectra) of TCEP under acidic conditions (pH value from 5 to 7, δ = 17.5 ppm) and alkaline conditions (pH value from 8 to 11, δ = −20.6 ppm). TCEP's protonation state particularly exerts a profound influence on the reduction of Te. For the latter, the acidic form of TCEP is unable to act as a reductant. Fig. 2b also presents the 31P NMR spectra for TCEP![[double bond, length as m-dash]](https://www.rsc.org/images/entities/char_e001.gif) O (δ = 56.9 ppm at pH = 2.5 and 58.9 ppm at pH = 11), TCEP
O (δ = 56.9 ppm at pH = 2.5 and 58.9 ppm at pH = 11), TCEP![[double bond, length as m-dash]](https://www.rsc.org/images/entities/char_e001.gif) S (δ = 52.7 ppm), TCEP
S (δ = 52.7 ppm), TCEP![[double bond, length as m-dash]](https://www.rsc.org/images/entities/char_e001.gif) Se (δ = 41.4 ppm) and TCEP
Se (δ = 41.4 ppm) and TCEP![[double bond, length as m-dash]](https://www.rsc.org/images/entities/char_e001.gif) Te (δ = −6.8 ppm). The formation of TCEP
Te (δ = −6.8 ppm). The formation of TCEP![[double bond, length as m-dash]](https://www.rsc.org/images/entities/char_e001.gif) O as a side product is often observed when solutions of TCEP
O as a side product is often observed when solutions of TCEP![[double bond, length as m-dash]](https://www.rsc.org/images/entities/char_e001.gif) X are exposed under aerobic conditions, especially at pH > 9. Therefore, to prevent the competing formation of TCEP
X are exposed under aerobic conditions, especially at pH > 9. Therefore, to prevent the competing formation of TCEP![[double bond, length as m-dash]](https://www.rsc.org/images/entities/char_e001.gif) O, all reactions were carried out under an inert atmosphere.
O, all reactions were carried out under an inert atmosphere.
After identifying pH as the most critical parameter for the preparation of TCEP![[double bond, length as m-dash]](https://www.rsc.org/images/entities/char_e001.gif) X, a multifactorial optimization was initiated through a Design of Experiment (DoE), under batch conditions. The reaction between TCEP and elemental chalcogens is inherently heterogeneous, hence, apart from pH, 3 additional parameters are likely to influence the reaction: (a) the excess chalcogen, (b) the mixing efficiency and (c) the timeframe for the reaction.
X, a multifactorial optimization was initiated through a Design of Experiment (DoE), under batch conditions. The reaction between TCEP and elemental chalcogens is inherently heterogeneous, hence, apart from pH, 3 additional parameters are likely to influence the reaction: (a) the excess chalcogen, (b) the mixing efficiency and (c) the timeframe for the reaction.
The multifactorial optimization started with the synthesis of TCEP![[double bond, length as m-dash]](https://www.rsc.org/images/entities/char_e001.gif) S. A range of preliminary boundary conditions was selected, including pH values of 5 (representing the phosphine in its fully protonated form) and 11 (representing TCEP in its deprotonated form); an excess of chalcogen (S8) ranging from 1.5 to 3 equivalents; stirring speed set between 700 to 900 rpm. Samples were collected after 20, 40 and 60 min. Crude samples were directly analyzed by high-field 31P NMR, after the addition of deuterium oxide (50
S. A range of preliminary boundary conditions was selected, including pH values of 5 (representing the phosphine in its fully protonated form) and 11 (representing TCEP in its deprotonated form); an excess of chalcogen (S8) ranging from 1.5 to 3 equivalents; stirring speed set between 700 to 900 rpm. Samples were collected after 20, 40 and 60 min. Crude samples were directly analyzed by high-field 31P NMR, after the addition of deuterium oxide (50![[thin space (1/6-em)]](https://www.rsc.org/images/entities/char_2009.gif) :
:![[thin space (1/6-em)]](https://www.rsc.org/images/entities/char_2009.gif) 50 crude/D2O, in volume).
50 crude/D2O, in volume).
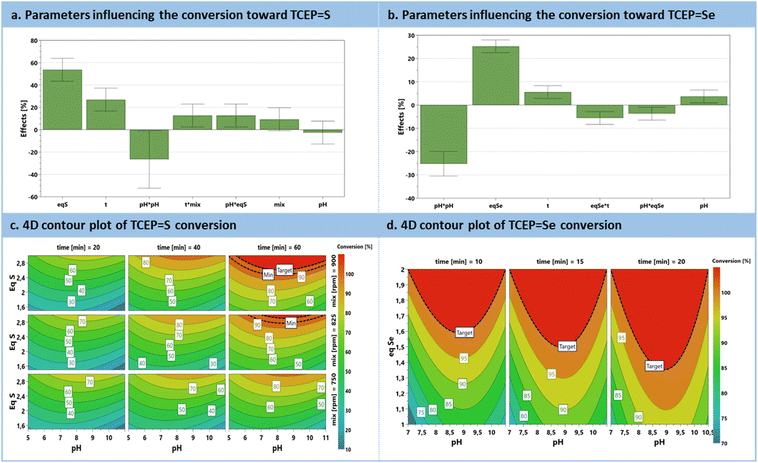
The preliminary set of results from the DoE was analyzed through an effect plot, which summarizes the relative impact of each parameter on the conversion (Fig. 3a). A model was derived and is summarized as contour plots in Fig. 3c. The effect plot shows that the most conductive parameter to enhance conversion is the excess of chalcogen, contributing to 53.6%, followed by the reaction time to 26.9%. Interestingly, pH exhibits a quadratic effect. Indeed, it was expected that an increasing pH would only have a positive impact; however, this was not the case, since more alkaline conditions triggered a competitive phenomenon, i.e., chalcogen polymerization.60 Mixing efficiency does not exert a significant direct impact with this range of rpm. However, when expressed as an interaction parameter, it shows a positive influence in conjunction with the reaction time. Moreover, pH and excess of S8 are also associated with a positive interaction. The model resulting from these results (Fig. 3c) for sulfur reduction with TCEP toward TCEP![[double bond, length as m-dash]](https://www.rsc.org/images/entities/char_e001.gif) S anticipates full conversion with the simultaneous requirement for extended reaction times (>40 min), a large excess of sulfur (>2.5 eq.) at pH values between 7.5 and 9 (graphical determination), all under vigorous stirring.
S anticipates full conversion with the simultaneous requirement for extended reaction times (>40 min), a large excess of sulfur (>2.5 eq.) at pH values between 7.5 and 9 (graphical determination), all under vigorous stirring.
Similar behavior can be drawn for the reduction of selenium with TCEP toward TCEP![[double bond, length as m-dash]](https://www.rsc.org/images/entities/char_e001.gif) Se, emphasizing a significant positive effect of the excess of Se8, and a milder positive influence of the reaction time. For the preparation of TCEP
Se, emphasizing a significant positive effect of the excess of Se8, and a milder positive influence of the reaction time. For the preparation of TCEP![[double bond, length as m-dash]](https://www.rsc.org/images/entities/char_e001.gif) Se, the pH parameter exhibits a square term with an optimum between 8 and 9.5 (graphical determination). There are also two negative interaction parameters involving the excess Se8vs. pH or reaction time (i.e., pH·Eq. and Eq.·t, Fig. 3b). The model constructed for TCEP
Se, the pH parameter exhibits a square term with an optimum between 8 and 9.5 (graphical determination). There are also two negative interaction parameters involving the excess Se8vs. pH or reaction time (i.e., pH·Eq. and Eq.·t, Fig. 3b). The model constructed for TCEP![[double bond, length as m-dash]](https://www.rsc.org/images/entities/char_e001.gif) Se predicts complete conversion within a shorter reaction time (10 min) and with a lower excess of selenium (up to 1.5 equiv.) (Fig. 3d).
Se predicts complete conversion within a shorter reaction time (10 min) and with a lower excess of selenium (up to 1.5 equiv.) (Fig. 3d).
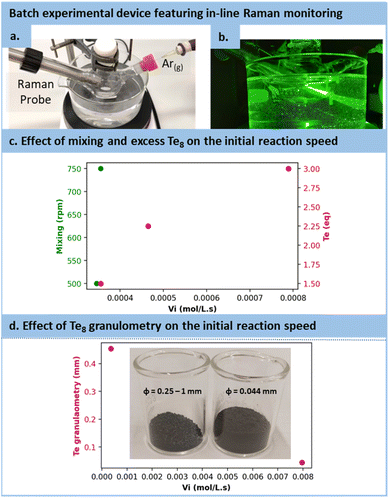
However, in the case of TCEP![[double bond, length as m-dash]](https://www.rsc.org/images/entities/char_e001.gif) Te, the optimization strategy needed adaptation. Firstly, as the protonated form of TCEP appeared incapable of reducing tellurium, TCEP in aqueous solution must be at a pH above 10 to react with Te(0). Secondly, due to the notably faster reduction rate for Te(0), the reaction with TCEP occurred within such a short timeframe that 31P NMR reaction monitoring was not doable. Instead, we selected in situ Raman spectroscopy (see Fig. 4a and b). This allowed for the assessment of various parameters and their influence on the initial reaction rate (vi), including the excess of tellurium, its granulometry and mixing efficiency. Note that these preliminary observations were made by using 200 mesh tellurium. After several trials, −18 + 60 mesh tellurium was preferred for easier monitoring.
Te, the optimization strategy needed adaptation. Firstly, as the protonated form of TCEP appeared incapable of reducing tellurium, TCEP in aqueous solution must be at a pH above 10 to react with Te(0). Secondly, due to the notably faster reduction rate for Te(0), the reaction with TCEP occurred within such a short timeframe that 31P NMR reaction monitoring was not doable. Instead, we selected in situ Raman spectroscopy (see Fig. 4a and b). This allowed for the assessment of various parameters and their influence on the initial reaction rate (vi), including the excess of tellurium, its granulometry and mixing efficiency. Note that these preliminary observations were made by using 200 mesh tellurium. After several trials, −18 + 60 mesh tellurium was preferred for easier monitoring.
As illustrated in Fig. 4c, the mixing had only a minor effect on the reaction kinetics, with a mere 2.8% increase while transitioning from 500 to 750 rpm, which confirms the observation made on the effect diagram for TCEP![[double bond, length as m-dash]](https://www.rsc.org/images/entities/char_e001.gif) S formation. The excess of Te8 had a positive effect on the reaction rate constant, accelerating it from 3.56 10−4 mol L−1 s−1 to 7.90 10−4 mol L−1 s−1 when the tellurium excess was increased (1.5 to 3 equiv.). In addition, the granulometry of tellurium had a profound impact on the reaction. When switching from −18 + 60 mesh to 200 mesh, i.e., reducing the size of particles from 454 μm (equivalent diameter on volume) to 44 μm, the reaction proceeded 22.41 times faster (from 3.56 10−4 mol L−1 s−1 with particle sizes of 454 μm to 7.96 10−3 mol L−1 s−1 with particle sizes of 44 μm), as shown in Fig. 4d.
S formation. The excess of Te8 had a positive effect on the reaction rate constant, accelerating it from 3.56 10−4 mol L−1 s−1 to 7.90 10−4 mol L−1 s−1 when the tellurium excess was increased (1.5 to 3 equiv.). In addition, the granulometry of tellurium had a profound impact on the reaction. When switching from −18 + 60 mesh to 200 mesh, i.e., reducing the size of particles from 454 μm (equivalent diameter on volume) to 44 μm, the reaction proceeded 22.41 times faster (from 3.56 10−4 mol L−1 s−1 with particle sizes of 454 μm to 7.96 10−3 mol L−1 s−1 with particle sizes of 44 μm), as shown in Fig. 4d.
To sum up the preliminary batch optimization, pH emerges as a critical factor for reaction rate, especially in the preparation of TCEP![[double bond, length as m-dash]](https://www.rsc.org/images/entities/char_e001.gif) Te. For sulfur and selenium, which exhibit a quadratic behavior, synthesis at the optimum pH, i.e. moderately basic, is also recommended. The quadratic behavior of the TCEP
Te. For sulfur and selenium, which exhibit a quadratic behavior, synthesis at the optimum pH, i.e. moderately basic, is also recommended. The quadratic behavior of the TCEP![[double bond, length as m-dash]](https://www.rsc.org/images/entities/char_e001.gif) S, Se formation is likely to be influenced by, at lower pH, the protonation rate of the TCEP and, at high pH, the formation of polymeric species.60 Mixing effects are limited, and at speeds higher than 500 rpm, their influence becomes negligible. An excess of chalcogen has a positive impact on the preparation of all 3 compounds (TCEP
S, Se formation is likely to be influenced by, at lower pH, the protonation rate of the TCEP and, at high pH, the formation of polymeric species.60 Mixing effects are limited, and at speeds higher than 500 rpm, their influence becomes negligible. An excess of chalcogen has a positive impact on the preparation of all 3 compounds (TCEP![[double bond, length as m-dash]](https://www.rsc.org/images/entities/char_e001.gif) S, Se, Te). The effect of the granulometry, which was studied only for the preparation of TCEP
S, Se, Te). The effect of the granulometry, which was studied only for the preparation of TCEP![[double bond, length as m-dash]](https://www.rsc.org/images/entities/char_e001.gif) Te, clearly shows that smaller particles lead to a drastic increase in kinetics, related to an increase in the surface area of the chalcogen. This is expected in a heterogeneous process where the rate-determining step involves homogeneous reagents (TCEP) and the chalcogen surface.
Te, clearly shows that smaller particles lead to a drastic increase in kinetics, related to an increase in the surface area of the chalcogen. This is expected in a heterogeneous process where the rate-determining step involves homogeneous reagents (TCEP) and the chalcogen surface.
In situ kinetics of the chalcogen reduction by TCEP
Following preliminary optimization and multivariate analysis, a more refined kinetic study was conducted for the reduction of all chalcogens with TCEP. Prior to these experiments, precise research on the optimum pH was sought (Fig. S14 in the ESI†). These experiments aimed to determine the reaction mechanism, specific kinetic constants and experimental activation barriers for the rate-determining step. Each substrate (TCEP![[double bond, length as m-dash]](https://www.rsc.org/images/entities/char_e001.gif) S, Se, Te) was subjected to the reaction at 30 °C, 40 °C and 50 °C, as well as 60 °C for Se and Te.
S, Se, Te) was subjected to the reaction at 30 °C, 40 °C and 50 °C, as well as 60 °C for Se and Te.
The reactions were monitored by in situ Raman spectroscopy following a protocol similar to Fig. 4, with the evolution over time of the Raman signal corresponding to the P![[double bond, length as m-dash]](https://www.rsc.org/images/entities/char_e001.gif) X (X = S, Se, Te) bond (P
X (X = S, Se, Te) bond (P![[double bond, length as m-dash]](https://www.rsc.org/images/entities/char_e001.gif) Te: 376 cm−1; P
Te: 376 cm−1; P![[double bond, length as m-dash]](https://www.rsc.org/images/entities/char_e001.gif) Se: 428 cm−1; P
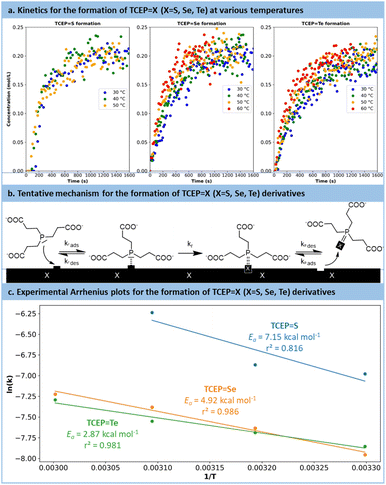
Se: 428 cm−1; P![[double bond, length as m-dash]](https://www.rsc.org/images/entities/char_e001.gif) S: 578 cm−1). The results are plotted in Fig. 5a. For each series, the temperature had a positive effect on the reaction kinetics. Similar trends were observed for the reduction of selenium and tellurium with TCEP: the reaction initiated rapidly and then slowed down after reaching a concentration of 0.15 mol L−1. The reaction with S8 followed a different pattern (Fig. S15 and 16 in the ESI†). Initially, a complex and broad signal with characteristic peaks at 500 cm−1 and 825–870 cm−1 appeared, hypothesized to be adsorbed TCEP on the surface of sulfur particles. This transient species eventually leads to the formation of the expected product (TCEP
S: 578 cm−1). The results are plotted in Fig. 5a. For each series, the temperature had a positive effect on the reaction kinetics. Similar trends were observed for the reduction of selenium and tellurium with TCEP: the reaction initiated rapidly and then slowed down after reaching a concentration of 0.15 mol L−1. The reaction with S8 followed a different pattern (Fig. S15 and 16 in the ESI†). Initially, a complex and broad signal with characteristic peaks at 500 cm−1 and 825–870 cm−1 appeared, hypothesized to be adsorbed TCEP on the surface of sulfur particles. This transient species eventually leads to the formation of the expected product (TCEP![[double bond, length as m-dash]](https://www.rsc.org/images/entities/char_e001.gif) S).
S).
The kinetic data were then used to establish the rate laws governing the preparation of TCEP![[double bond, length as m-dash]](https://www.rsc.org/images/entities/char_e001.gif) S, Se, Te. Various models were envisaged, accounting for the critical role of the TCEP adsorption of the chalcogen's surface (more details are provided in Section S5.6 of the ESI†). Despite their complexity, none of these models successfully fitted the kinetics data. Nonetheless, closer examination of the data indicated that the reaction slowed down more rapidly than predicted by the models. A plausible hypothesis to account for this deviation is a decrease in active site accessibility on the chalcogen's surface due to an increase in its porosity (Fig. 5b). This effect was integrated into the model as a decreasing exponential function (Section S5.6 of the ESI†).
S, Se, Te. Various models were envisaged, accounting for the critical role of the TCEP adsorption of the chalcogen's surface (more details are provided in Section S5.6 of the ESI†). Despite their complexity, none of these models successfully fitted the kinetics data. Nonetheless, closer examination of the data indicated that the reaction slowed down more rapidly than predicted by the models. A plausible hypothesis to account for this deviation is a decrease in active site accessibility on the chalcogen's surface due to an increase in its porosity (Fig. 5b). This effect was integrated into the model as a decreasing exponential function (Section S5.6 of the ESI†).
The revised kinetic model (eqn (1)) was effectively used to fit the experimental data using eqn (2). With this approach, the kinetic constants were derived for the preparation of TCEP![[double bond, length as m-dash]](https://www.rsc.org/images/entities/char_e001.gif) S, Se, Te at 30 °C, 40 °C, 50 °C and 60 °C (the latter temperature was only considered for TCEP
S, Se, Te at 30 °C, 40 °C, 50 °C and 60 °C (the latter temperature was only considered for TCEP![[double bond, length as m-dash]](https://www.rsc.org/images/entities/char_e001.gif) Se, Te). These constants were next used to calculate the experimental activation energies for the rate-determining step of the 3 processes using Arrhenius' equation (Fig. 5c and eqn (3)). The values obtained for each species exhibited a periodic trend: TCEP
Se, Te). These constants were next used to calculate the experimental activation energies for the rate-determining step of the 3 processes using Arrhenius' equation (Fig. 5c and eqn (3)). The values obtained for each species exhibited a periodic trend: TCEP![[double bond, length as m-dash]](https://www.rsc.org/images/entities/char_e001.gif) S (7.2 kcal mol−1) > TCEP
S (7.2 kcal mol−1) > TCEP![[double bond, length as m-dash]](https://www.rsc.org/images/entities/char_e001.gif) Se (4.9 kcal mol−1) > TCEP
Se (4.9 kcal mol−1) > TCEP![[double bond, length as m-dash]](https://www.rsc.org/images/entities/char_e001.gif) Te (2.9 kcal mol−1). These observations align well with the ones collected during the batch optimization (full conversion was achieved faster with TCEP
Te (2.9 kcal mol−1). These observations align well with the ones collected during the batch optimization (full conversion was achieved faster with TCEP![[double bond, length as m-dash]](https://www.rsc.org/images/entities/char_e001.gif) Te > TCEP
Te > TCEP![[double bond, length as m-dash]](https://www.rsc.org/images/entities/char_e001.gif) Se > TCEP
Se > TCEP![[double bond, length as m-dash]](https://www.rsc.org/images/entities/char_e001.gif) S) and are consistent with existing literature data as well, and follow HSAB theory.61
S) and are consistent with existing literature data as well, and follow HSAB theory.61
 | (1) |
 | (2) |
 | (3) |
Transposition in flow for the preparation of TCEP![[double bond, length as m-dash]](https://www.rsc.org/images/entities/h3_char_e001.gif) X
X
Considering the compelling evidence that the reaction, proceeding via the adsorption of TCEP on the chalcogen particle's surface, is dominated by surface accessibility, there are two potential options to enhance reaction kinetics: increasing the excess of chalcogen and/or reducing chalcogen particle size. These attributes can be effectively combined under continuous flow conditions. Therefore, elemental chalcogen powder was considered as a packing material suitable for packed-bed tubular flow reactors. In this setup, a feed solution of TCEP (0.2 M in water, pH = 10.7) is passed through the packed-bed column containing the elemental chalcogenides.
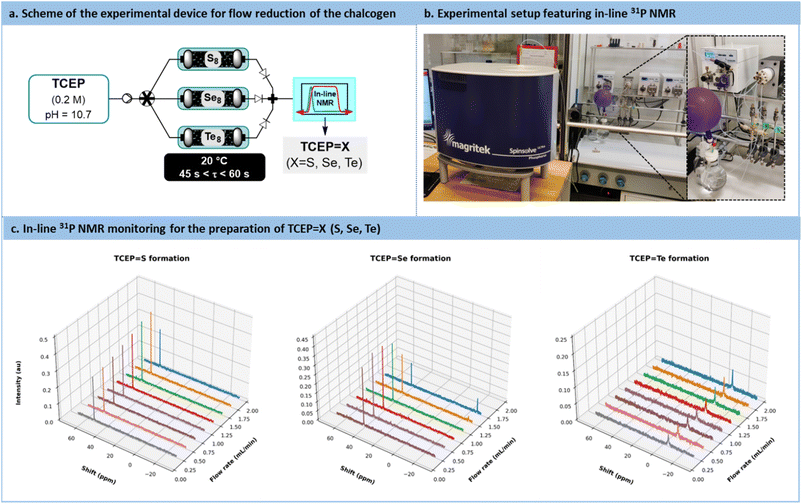
A versatile flow system was constructed, consisting of 3 columns (¼’’ stainless steel, 150 mm length) operated in parallel, each filled with either sulfur, selenium, or tellurium, respectively (Fig. 6a and b). These 3 columns were connected upstream to a single feed solution of TCEP through an automated selector valve. The valve was remotely controlled to select the appropriate chalcogen source, enabling on-demand preparation, at room temperature, of TCEP![[double bond, length as m-dash]](https://www.rsc.org/images/entities/char_e001.gif) S, TCEP
S, TCEP![[double bond, length as m-dash]](https://www.rsc.org/images/entities/char_e001.gif) Se, and TCEP
Se, and TCEP![[double bond, length as m-dash]](https://www.rsc.org/images/entities/char_e001.gif) Te. For each column, the porosity (ε) was estimated to be 0.287 (S8), 0.098 (Se8) and 0.434 (Te8) (note that −18 + 60 mesh tellurium was used), respectively. These different porosities resulted in varying reactor volumes and chalcogen ratios, thereby impacting the reactivity trends calculated with the activation barriers. The downstream section of the flow setup featured a benchtop low-field NMR operated in the 31P NMR mode to assess both productivity and stability (Fig. 6a and b).
Te. For each column, the porosity (ε) was estimated to be 0.287 (S8), 0.098 (Se8) and 0.434 (Te8) (note that −18 + 60 mesh tellurium was used), respectively. These different porosities resulted in varying reactor volumes and chalcogen ratios, thereby impacting the reactivity trends calculated with the activation barriers. The downstream section of the flow setup featured a benchtop low-field NMR operated in the 31P NMR mode to assess both productivity and stability (Fig. 6a and b).
For each chalcogen, a feed solution of TCEP (pH 10.7) was infused at flow rates ranging from 0.25 mL min−1 to 2 mL min−1. Conversion and space-time yield (STY, see Section S5.7 in the ESI† for more details) were calculated to determine the productivity boundaries of the flow system. In the case of sulfur, full conversion to TCEP![[double bond, length as m-dash]](https://www.rsc.org/images/entities/char_e001.gif) S was maintained within the range of 0.25 mL min−1 to 2 mL min−1 (STY: 45.9 g L−1 min−1 with an estimated residence time of 0.354 min at 2 mL min−1). Similar results were observed for TCEP
S was maintained within the range of 0.25 mL min−1 to 2 mL min−1 (STY: 45.9 g L−1 min−1 with an estimated residence time of 0.354 min at 2 mL min−1). Similar results were observed for TCEP![[double bond, length as m-dash]](https://www.rsc.org/images/entities/char_e001.gif) Te (STY: 61.5 g L−1 min−1 and an estimated residence time of 0.534 min at 2 mL min−1).
Te (STY: 61.5 g L−1 min−1 and an estimated residence time of 0.534 min at 2 mL min−1).
For TCEP![[double bond, length as m-dash]](https://www.rsc.org/images/entities/char_e001.gif) Se, full conversion was observed up to 1 mL min−1 (STY: 26.8 g L−1 min−1 and an estimated residence time of 0.242 min), as illustrated in Fig. 6c. These outcomes are particularly remarkable when compared to kinetic batch experiments, where full conversion required approximately 20, 23, and 26 min for sulfur, selenium, and tellurium, respectively. The substantial reduction in the timeframe and the outstanding productivity metrics required to achieve full conversion emphasize the advantages of this flow setup for the reduction of chalcogens.
Se, full conversion was observed up to 1 mL min−1 (STY: 26.8 g L−1 min−1 and an estimated residence time of 0.242 min), as illustrated in Fig. 6c. These outcomes are particularly remarkable when compared to kinetic batch experiments, where full conversion required approximately 20, 23, and 26 min for sulfur, selenium, and tellurium, respectively. The substantial reduction in the timeframe and the outstanding productivity metrics required to achieve full conversion emphasize the advantages of this flow setup for the reduction of chalcogens.
Continuous monitoring of TCEP![[double bond, length as m-dash]](https://www.rsc.org/images/entities/char_e001.gif) Te at a flow rate of 1.2 mL min−1 was conducted and sustained full conversion for a total operation time of 200 min, which is quite promising in anticipation of scalability trials for CdTe QDs (see below, and Fig. S25 in the ESI†).
Te at a flow rate of 1.2 mL min−1 was conducted and sustained full conversion for a total operation time of 200 min, which is quite promising in anticipation of scalability trials for CdTe QDs (see below, and Fig. S25 in the ESI†).
Concatenation to the downstream preparation of quantum dots
The direct concatenation of the upstream generator for TCEP![[double bond, length as m-dash]](https://www.rsc.org/images/entities/char_e001.gif) X with the downstream preparation of CdX significantly reduces the risk of precursor degradation and enhances the versatility of the flow setup (Fig. 7a). The aqueous protocol for CdX synthesis was adapted to accommodate our system, taking advantage of the distinctive features of the new chalcogenide precursor, TCEP
X with the downstream preparation of CdX significantly reduces the risk of precursor degradation and enhances the versatility of the flow setup (Fig. 7a). The aqueous protocol for CdX synthesis was adapted to accommodate our system, taking advantage of the distinctive features of the new chalcogenide precursor, TCEP![[double bond, length as m-dash]](https://www.rsc.org/images/entities/char_e001.gif) X. Typically, these protocols involve a strongly basic solution (pH > 11) and cadmium mercaptopropionate (Cd(3-MPA)2) as cadmium precursor.62
X. Typically, these protocols involve a strongly basic solution (pH > 11) and cadmium mercaptopropionate (Cd(3-MPA)2) as cadmium precursor.62
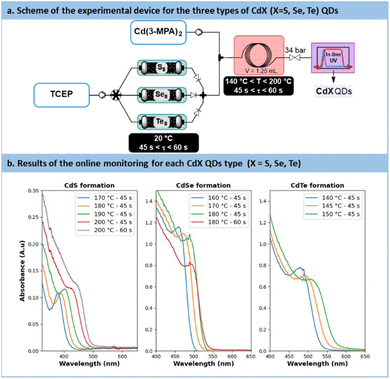 | ||
| Fig. 7 (a) Simplified flow chart for the concatenated process towards CdS, CdSe and CdTe QDs. (b) In-line monitoring with UV/vis. (A.u. = Absorbance units), path length: CdS 0.5 mm, CdSe/Te: 10 mm. | ||
In the proposed system, the TCEP![[double bond, length as m-dash]](https://www.rsc.org/images/entities/char_e001.gif) X generator (Fig. 7a) was inserted upstream of an additional static mixer. The latter allowed the stream of TCEP
X generator (Fig. 7a) was inserted upstream of an additional static mixer. The latter allowed the stream of TCEP![[double bond, length as m-dash]](https://www.rsc.org/images/entities/char_e001.gif) X to be blended with a feed solution of Cd(3-MPA)2. The resulting reaction mixture was then directed to a heated reaction coil for QD generation. The reactor effluent was thermally quenched and then connected to an in-line UV-VIS spectrometer for real-time reaction monitoring.
X to be blended with a feed solution of Cd(3-MPA)2. The resulting reaction mixture was then directed to a heated reaction coil for QD generation. The reactor effluent was thermally quenched and then connected to an in-line UV-VIS spectrometer for real-time reaction monitoring.
The results obtained during the synthesis are shown in Fig. 7b. Overall, these results demonstrate the effectiveness of fresh TCEP![[double bond, length as m-dash]](https://www.rsc.org/images/entities/char_e001.gif) X precursors as efficient chalcogenide carriers under aqueous conditions. They demonstrate the capability of TCEP
X precursors as efficient chalcogenide carriers under aqueous conditions. They demonstrate the capability of TCEP![[double bond, length as m-dash]](https://www.rsc.org/images/entities/char_e001.gif) X to readily transfer chalcogen to cadmium under relatively mild conditions. Furthermore, the findings highlight that the reactivity of TCEP
X to readily transfer chalcogen to cadmium under relatively mild conditions. Furthermore, the findings highlight that the reactivity of TCEP![[double bond, length as m-dash]](https://www.rsc.org/images/entities/char_e001.gif) X is significantly influenced by the nature of the chalcogen, establishing a reactivity hierarchy where softer chalcogens (TCEP
X is significantly influenced by the nature of the chalcogen, establishing a reactivity hierarchy where softer chalcogens (TCEP![[double bond, length as m-dash]](https://www.rsc.org/images/entities/char_e001.gif) S < TCEP
S < TCEP![[double bond, length as m-dash]](https://www.rsc.org/images/entities/char_e001.gif) Se < TCEP
Se < TCEP![[double bond, length as m-dash]](https://www.rsc.org/images/entities/char_e001.gif) Te) require lower process temperatures.
Te) require lower process temperatures.
High-resolution transmission electron microscopy (HRTEM) and powder X-ray diffraction (PXRD) analyses were conducted to provide insights into the size and morphology of the QDs (Fig. 8a). The HRTEM images revealed that the particles exhibited a spherical morphology, with estimated particle sizes of 3.31 nm for CdS, 3.35 nm for CdSe, and 4.0 nm for CdTe (Fig. 8a). Subsequently, PXRD analyses were carried out on purified QDs, utilizing zero-background substrates. For all three samples (CdX, where X![[double bond, length as m-dash]](https://www.rsc.org/images/entities/char_e001.gif) S, Se, and Te), the XRD patterns matched those of reference samples, confirming the crystalline nature of the QDs (Fig. 8b). These QDs exhibited a cubic crystal system.
S, Se, and Te), the XRD patterns matched those of reference samples, confirming the crystalline nature of the QDs (Fig. 8b). These QDs exhibited a cubic crystal system.
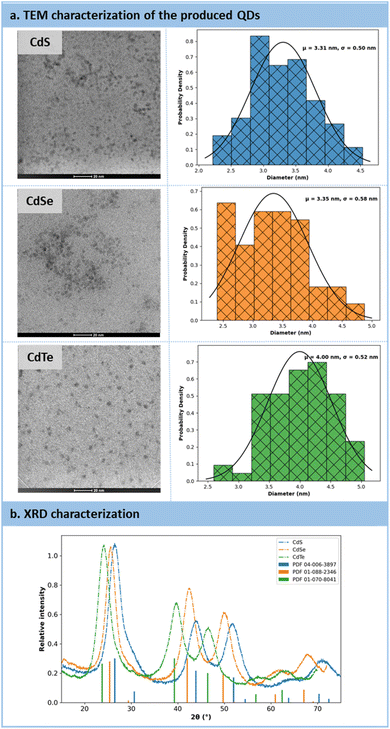 | ||
| Fig. 8 (a) Characterizations of QDs after their production by HRTEM. (b) Characterizations of QDs by Powder X-ray Diffraction analysis. | ||
The size of QDs, including their ligand corona, can also be determined through diffusion-ordered spectroscopy (DOSY) NMR experiment.63,64 DOSY correlates 1H NMR chemical shifts with diffusion coefficients, enabling precise attribution of the hydrodynamic diameters of the particles and their surface ligands. Accordingly, the following hydrodynamic diameters were attributed to each QD type: CdS 4.67 nm, CdSe: 5.67 nm, CdTe: 4.70 nm. The chemical shifts corresponding to these hydrodynamic diameters were associated with the methylene groups of 3-MPA (broad signals at approximately 2.93 ppm and 2.56 ppm). Despite thorough purification was carried out before characterization, phosphorus signals from phosphine oxide, a known stabilizing agent, were also detected. The peak width suggested their presence as “free ligands”.63 This hypothesis was confirmed by X-ray photoelectron spectroscopy (XPS), which did not show any phosphorus 2p interactions (likely lost during the high vacuum before analysis), but revealed unsaturated metal. XPS also highlighted a significant proportion of carboxylate functions, likely from 3-MPA, TCEP![[double bond, length as m-dash]](https://www.rsc.org/images/entities/char_e001.gif) O (through the 3 carboxylate functions), and acetate ions from the cadmium source. Surface analysis indicated a cadmium-to-chalcogen ratio of less than 1 (around 0.4), suggesting a surface alloy CdXnSn−1 (X = Se, Te) not detectable by XRD. Finally, the presence of a thiolate–cadmium bond was confirmed.
O (through the 3 carboxylate functions), and acetate ions from the cadmium source. Surface analysis indicated a cadmium-to-chalcogen ratio of less than 1 (around 0.4), suggesting a surface alloy CdXnSn−1 (X = Se, Te) not detectable by XRD. Finally, the presence of a thiolate–cadmium bond was confirmed.
Proof of concept with CdS QDs
In the case of CdS, a temperature range of 170 °C to 200 °C, as well as residence times ranging from 45 s to 60 s, were investigated. The UV absorbance monitoring (Fig. 7b) revealed an excitonic peak shifting from 380 nm to 435 nm, thus indicating an increase in particle size with higher temperatures and longer residence time. Moreover, absorbance values increased from 0.11 to 0.13, thus indicating an increase in particle concentration and, consequently, enhanced nucleation efficiency.However, the presence of a large Stokes shift revealed photoluminescence properties characterized by trap states instead of excitonic emission.65 This emission similar to colloidal CdS has been already reported previously66 and seems characteristic of some aqueous carboxyl-capped CdS QDs. Efforts to suppress these vacancies were unsuccessful, even by working with an excess of Cd2+ or opting for core–shell QDs. A deeper investigation is necessary for the CdS QDs formed with this method. However, to rule out the possibility of 3-MPA as a potential source for sulfur transfer under aqueous conditions, a control experiment was conducted (see Section S5.9 of the ESI†). The synthesis was repeated without TCEP![[double bond, length as m-dash]](https://www.rsc.org/images/entities/char_e001.gif) S, and it did not yield high-quality CdS QDs. With all converging proofs toward the development of a new and effective vehicle for chalcogenides under aqueous process conditions, further applications benefiting from flow technology were envisaged.
S, and it did not yield high-quality CdS QDs. With all converging proofs toward the development of a new and effective vehicle for chalcogenides under aqueous process conditions, further applications benefiting from flow technology were envisaged.
Type I CdSe/ZnS core–shell QDs
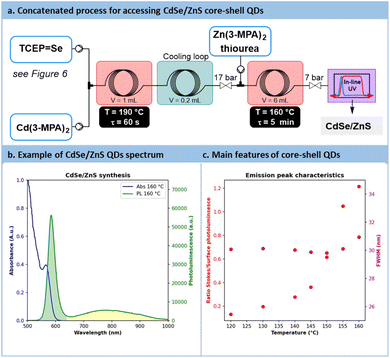
Temperatures ranging from 160 °C to 180 °C and residence times from 45 s to 60 s were explored for the preparation of CdSe QDs. With such conditions, a minor decrease in absorbance from 1.18 to 0.8 pointing out a reduction in CdSe particle concentration. Conversely, particle size increased, with a peak red-shifted from 475 nm to 500 nm. Similarly to previous reports in the literature, CdSe QDs showed poor emission spectra (Fig. S56 in the ESI†). A common strategy to passivate surface trap states is to add a semiconducting shell bearing a higher bandgap.67,68CdSe/ZnS core-shells QDs are frequently investigated for their improved photoluminescence and reduced toxicology profile.69 Our approach was amenable to a direct concatenation of the module for preparing CdSe QDs (Fig. 9a).Therefore, the reactor effluent containing CdSe was mixed with a basic feed of ZnCl2, thiourea as the sulfide donor and 3-MPA as the stabilizing agent (see Section S4.8 of the ESI†). The corresponding setup is illustrated in Fig. 9a. Adding ZnS at temperatures ranging between 120 °C and 160 °C for 5 min led to core–shell QDs with a strong excitonic peak localized around 585 nm. Trap state emission was drastically reduced. To quantify the improvement in emission, a new metric was introduced: the ratio of the fluorescence peak to the trap state emission, depicted as the green surface over the yellow surface ratio in Fig. 9b (see Section S5.12 of the ESI†). This metric, presented in Fig. 9c, revealed a constant increase of this ratio from 0.13 (120 °C) up to 1.2 (160 °C). These results demonstrate that adding a ZnS shell over the CdSe core significantly improves the emission properties, even from an initially modest starting point. Additionally, the ZnS shell appears to have a limited impact on QD size, as the full width at half maximum (FWHM) remains consistently around 30 nm across different temperatures (Fig. 9c). This new protocol offers a fully concatenated process where each operating parameter can be tuned individually, highlighting the potential of this innovative approach for preparing high-quality biocompatible nanomaterials.68 To the best of our knowledge, this is the first report on a concatenated flow protocol for the preparation of high-quality aqueous CdSe/ZnS core–shell QDs and that does not require downstream ligand exchange.28
Optimization and reaction insights for CdTe QDs synthesis
The initial trials showed that CdTe was the most promising QD core. CdTe QDs exhibited limited trap state emission under mild reaction temperatures. Those conditions are usually compatible with most commercial mesofluidic reactors, thus opening doors for potential scalability.70 Before carrying out further optimization, data were collected on the inherent mechanistic features for the preparation of CdTe. According to the literature focusing on organic phosphine-chalcogenide sources,71,72 it is generally accepted that cadmium and chalcogen sources form a complex in the initial stage of the reaction. Subsequently, this complex encounters an oxygen donor that polarizes the phosphorus–chalcogen bond leading to its rupture. This results in a cadmium–chalcogen bond and the corresponding phosphine oxide (here, TCEP![[double bond, length as m-dash]](https://www.rsc.org/images/entities/char_e001.gif) O). The proposed mechanism is illustrated in Fig. 10a.
O). The proposed mechanism is illustrated in Fig. 10a.
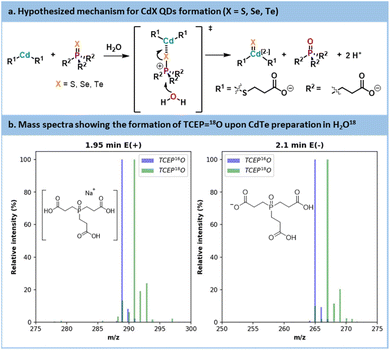 | ||
Fig. 10 (a) Hypothesized mechanism for CdX QDs formation. (b) Mass spectra of TCEP![[double bond, length as m-dash]](https://www.rsc.org/images/entities/char_e001.gif) 18O obtained from synthesis using labelled H218O and a reference of TCEP 18O obtained from synthesis using labelled H218O and a reference of TCEP![[double bond, length as m-dash]](https://www.rsc.org/images/entities/char_e001.gif) 16O. 16O. | ||
To validate this hypothesis, a CdTe synthesis was carried out in 18O-labelled water. After the reaction, the CdTe QDs were separated by sedimentation and the supernatant was analyzed by LC-MS (Fig. 10b and see Section S5.13 of the ESI†). The mass spectra are compared with a reference peak of TCEP![[double bond, length as m-dash]](https://www.rsc.org/images/entities/char_e001.gif) 16O. A +2 shift in the molecular ion was visible between the reference TCEP
16O. A +2 shift in the molecular ion was visible between the reference TCEP![[double bond, length as m-dash]](https://www.rsc.org/images/entities/char_e001.gif) 16O and the TCEP
16O and the TCEP![[double bond, length as m-dash]](https://www.rsc.org/images/entities/char_e001.gif) 18O produced during our experiment. Thus, in an aqueous environment, water acts as the oxygen donor, while in an organic environment, acetate is commonly seen as the oxygen donor.71,72 This conclusion also explains the decrease of pH that was noticed during our optimization under aqueous conditions.
18O produced during our experiment. Thus, in an aqueous environment, water acts as the oxygen donor, while in an organic environment, acetate is commonly seen as the oxygen donor.71,72 This conclusion also explains the decrease of pH that was noticed during our optimization under aqueous conditions.
Further optimization was performed to maximize the QD metrics, such as the photoluminescence quantum yield (PLQY) and the FWHM (see Section S4.9 of the ESI†). To this end, the following parameter boundaries were defined as follows: temperatures from 130 °C to 200 °C; residence time from 45 s to 60 s, and a Cd/Te ratio from 5 to 7.5. The results of this screening are presented in Fig. 11. The general trend observed is the formation of larger particles under higher temperature and longer residence time. While particle growth comes with an increased PLQY, it also broadens the size distribution (larger FWHM). At a given temperature, a longer residence time gives larger particles with an improved PLQY.
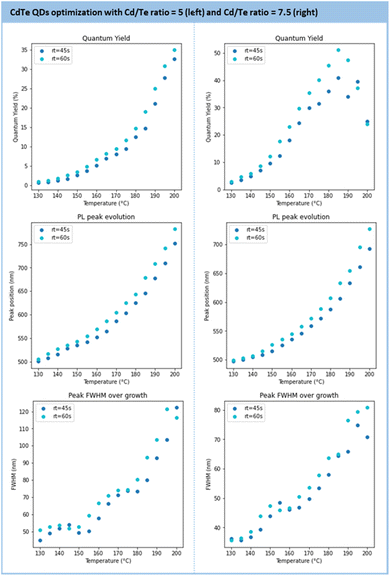 | ||
| Fig. 11 Results of the main metrics to characterize the CdTe QDs (PLQY, PL peak position, FWHM) under various temperatures and residence times for a Cd/Te ratio of 5 (left) and 7.5 (right). | ||
The series conducted with 5 and 7.5 equivalents of Cd(3-MPA)2 gave the most impactful observations. Firstly, the PLQY is higher with 7.5 equivalents (>50%) than with 5 equivalents (32%) and the emission maximum is blue-shifted from 790 nm (5 eq equiv.) to 640 nm (7.5 equiv.). The properties achieved with these particles align with recent reports on hydrothermal CdTe QDs.73–75 Secondly, a large excess of Cd precursors improves the size distribution as the FWHM is enhanced with 7.5 equivalents. However, the size range accessible with 7.5 equivalents of Cd is narrower (from 500 nm to 720 nm) compared to 5 equivalents (500 nm to 770 nm). Based on these observations, the conditions with a 7.5 Cd/Te ratio were selected for scalability trials.
Scalability trials for CdTe QDs synthesis
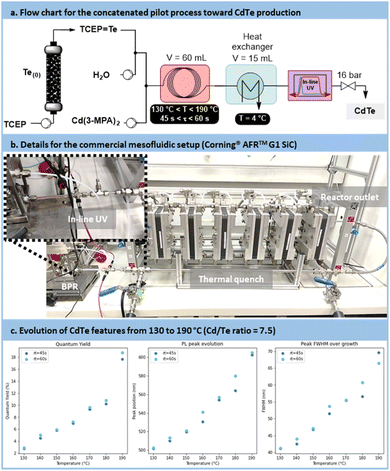
The pilot scale setup is depicted in Fig. 12a and b (for more details, see Section S4.10 of the ESI†). It consists of 2 concatenated reactors: an upstream generator of TCEP![[double bond, length as m-dash]](https://www.rsc.org/images/entities/char_e001.gif) Te, (see Fig. 7), and a downstream mesofluidic reactor for the formation of the CdTe. The latter mesofluidic reactor is a commercial pilot scale unit (Corning® Advanced-Flow™ G1 SiC Reactor, equipped with 6 Silicon Carbide fluidic modules connected in series and a 60 mL total internal volume). Postreaction operations include a tube-in-tube heat exchanger, an in-line UV/Vis flow cell with a 5 mm optical pathway and a back pressure regulator prior to sample collection.
Te, (see Fig. 7), and a downstream mesofluidic reactor for the formation of the CdTe. The latter mesofluidic reactor is a commercial pilot scale unit (Corning® Advanced-Flow™ G1 SiC Reactor, equipped with 6 Silicon Carbide fluidic modules connected in series and a 60 mL total internal volume). Postreaction operations include a tube-in-tube heat exchanger, an in-line UV/Vis flow cell with a 5 mm optical pathway and a back pressure regulator prior to sample collection.
Samples were prepared at temperatures ranging from 130 °C to 190 °C, with residence times of 45 s or 60 s. The results indicated, similar to the lab-scale trials, that higher process temperatures and longer residence times resulted in larger particles (Fig. 12c). This was evidenced by a red shift in absorbance and emission peaks, along with an increased PLQY. However, this was counterbalanced by a broader size distribution, resulting in an increase in the FWHM.
The comparison between the results obtained with the microfluidic and mesofluidic setups highlights disparities. Metrics achieved by the mesofluidic reactor were lower than those observed in the microfluidic setup. Specifically, the emission range was narrower, spanning from 500 nm to 600 nm compared to 500 nm to 650 nm. The PLQY was also reduced, reaching approximately 18%, vs. 40% at an emission of 600 nm under microfluidic conditions. Additionally, size distribution metrics were less favorable in the mesofluidic setup, with a FWHM ranging from 40 nm to 70 nm compared to 35 nm to 60 nm. This disparity was attributed to the much higher turbulence within the mesofluidic reactor. High turbulences are likely to accelerate the recombination of nuclei, resulting in higher QD concentrations but with smaller particles under similar reaction conditions. Nevertheless, this scale-up demonstrates the relevance of the concatenated approach, enabling the production of CdTe QDs at a rate of 80 mL min−1. As it is, the mesofluidic process allows the preparation of up to 40 g day−1 of CdTe QDs with a relative quantum yield of 18%.
Conclusions
This study introduces a novel water-soluble chalcogen vehicle that can be successfully transferred to a cadmium source, resulting in the formation of CdX (X = S, Se, Te) QDs in water. The preparation of TCEP![[double bond, length as m-dash]](https://www.rsc.org/images/entities/char_e001.gif) X (X = S, Se, Te) was optimized, with a focus on the influence of factors such as pH, chalcogen excess, mixing efficiency, and reagent granulometry, using a DoE approach. Following this optimization, in situ monitoring of the reaction was carried out at various temperatures using in situ Raman spectroscopy. The kinetic data generated allowed for real-time observation of the formation of TCEP
X (X = S, Se, Te) was optimized, with a focus on the influence of factors such as pH, chalcogen excess, mixing efficiency, and reagent granulometry, using a DoE approach. Following this optimization, in situ monitoring of the reaction was carried out at various temperatures using in situ Raman spectroscopy. The kinetic data generated allowed for real-time observation of the formation of TCEP![[double bond, length as m-dash]](https://www.rsc.org/images/entities/char_e001.gif) X species and the identification of the reaction mechanism, which occurs at the surface of the chalcogen particles. Over time, the reaction rate decreased due to surface degradation. Based on these observations, the process was successfully transposed in flow conditions using a packed-bed approach. Columns were filled with elemental chalcogens (S, Se, Te) and were operated in parallel for the on-demand production of the desired TCEP
X species and the identification of the reaction mechanism, which occurs at the surface of the chalcogen particles. Over time, the reaction rate decreased due to surface degradation. Based on these observations, the process was successfully transposed in flow conditions using a packed-bed approach. Columns were filled with elemental chalcogens (S, Se, Te) and were operated in parallel for the on-demand production of the desired TCEP![[double bond, length as m-dash]](https://www.rsc.org/images/entities/char_e001.gif) X (X = S, Se, Te) precursors from the same feed of TCEP. Such an innovative approach achieved impressive productivity levels and was eventually amenable to pilot-scale production.
X (X = S, Se, Te) precursors from the same feed of TCEP. Such an innovative approach achieved impressive productivity levels and was eventually amenable to pilot-scale production.
Following the successful transposition of precursor generation into a microfluidic, this step was concatenated with the preparation of CdX (X = S, Se, Te) QDs. The resulting nanoparticles were characterized using HRTEM and P-XRD, revealing nanosized spherical shapes with a cubic crystal lattice structure. Surface analysis (XPS) shows that the particles are mostly surrounded by 3-mercaptopropionic acid (thiolate and acetate groups). An alloy of CdXnSn−1 (X = Se, Te) is formed on the surface of their respective QDs.
The entire process was transposed to pilot scale in a mesofluidic reactor and demonstrated for the production of CdTe QDs. The pilot scale setup produced up to 80 mL min−1 of stable (>5 months) CdTe QDs. A daily production of up to 40 g per day of CdTe QDs exhibiting an 18% PLQY was achieved (51% PLQY at the microfluidic scale). Moreover, biocompatible CdSe/ZnS core–shell QDs were prepared with a concatenated approach. Such unprecedented processes under scalable flow conditions open new avenues for accessing aqueous QDs.
Data availability
The data supporting this article have been included as part of the ESI.†Author contributions
GP designed and performed the experiments, analyzed the results, and wrote the first draft of the manuscript and the ESI.† CM designed the Raman in-line batch experiments, provided technical assistance for the data treatment and the kinetic model and proofread the manuscript. PB designed and performed a preliminary study on the preparation of TCEP![[double bond, length as m-dash]](https://www.rsc.org/images/entities/char_e001.gif) Se, analyzed the data and contributed to the redaction of the manuscript. JCMM designed the concepts, supervised the research, and wrote the manuscript.
Se, analyzed the data and contributed to the redaction of the manuscript. JCMM designed the concepts, supervised the research, and wrote the manuscript.
Conflicts of interest
There are no conflicts to declare.Acknowledgements
This work was supported by the Service Public de Wallonie (Win2Wal 2018 Program, QD3Drops Project). Computational resources were provided by the “Consortium des Équipements de Calcul Intensif” (CÉCI), funded by the “Fonds de la Recherche Scientifique de Belgique” (F. R. S.-FNRS) under Grant No. 2.5020.11a and by the Walloon Region. The authors also thank Marc Winter and Dr Guillaume Gauron (Corning SAS) for their technical support and the loan of the pilot-scale mesofluidic equipment. The TEM pictures were realized at the CAREM microscopy facility of the University of Liège. The authors also acknowledge Dr H. Hellwig for his help with the scalability trials, Prof. B. Leyh (ULiège) for the stimulating discussions on kinetics, Prof. B. Vertruyen (ULiège) for acquiring the PXRD data, Dr P. Compère (ULiège) for the HRTEM data, Prof. S. Hermans and P. Eloy for the XPS data.Notes and references
- A. I. Ekimov and A. A. Onushchenko, JETP Lett., 1981, 34, 363–366 CAS
.
- R. Rossetti, S. Nakahara and L. E. Brus, J. Chem. Phys., 1983, 79, 1086–1088 CrossRef CAS
.
- L. Brus, J. Chem. Phys., 1984, 80, 4403–4409 CrossRef CAS
.
- C. B. Murray, D. J. Norris and M. G. Bawendi, J. Am. Chem. Soc., 1993, 115, 8706–8715 CrossRef CAS
.
- L. Brus, J. Phys. Chem., 1986, 90, 2555–2560 CrossRef CAS
.
- S. Liu, M. Li, K. Xiong, J. Gao, X. Lan, D. Zhang, L. Gao, J. Zhang and J. Tang, Nano Res., 2023, 16, 2392–2398 CrossRef CAS
.
- L. Hu, Q. Zhao, S. Huang, J. Zheng, X. Guan, R. Patterson, J. Kim, L. Shi, C. H. Lin, Q. Lei, D. Chu, W. Tao, S. Cheong, R. D. Tilley, A. W. Y. Ho-Baillie, J. M. Luther, J. Yuan and T. Wu, Nat. Commun., 2021, 12, 1–9 CrossRef PubMed
.
- L. Suhyeon, H. Donghyo, Y. Suk-Young, Y. Heesun, B. Wan Ki and K. Jeonghun, Nano Res., 2022, 15, 6477–6482 CrossRef
.
- W. Cao, C. Xiang, Y. Yang, Q. Chen, L. Chen, X. Yan and L. Qian, Nat. Commun., 2018, 9, 2–7 CrossRef PubMed
.
- S. Park, B. J. Kim, T. Y. Kim, E. Y. Jung, K. M. Lee, J. A. Hong, W. Jeon, Y. Park and S. J. Kang, J. Mater. Chem. C, 2021, 9, 2550–2560 RSC
.
- J. Leemans, V. Pejović, E. Georgitzikis, M. Minjauw, A. B. Siddik, Y. H. Deng, Y. Kuang, G. Roelkens, C. Detavernier, I. Lieberman, P. E. Malinowski, D. Cheyns and Z. Hens, Adv. Sci., 2022, 9, 1–8 Search PubMed
.
- X. Wu, S. Xie, C. Liu, C. Zhou, J. Lin, J. Kang, Q. Zhang, Z. Wang and Y. Wang, ACS Catal., 2019, 9, 8443–8451 CrossRef CAS
.
- C. Campalani, G. Petit, J. C. M. Monbaliu, M. Selva and A. Perosa, ChemPhotoChem, 2023, 7, 1–8 Search PubMed
.
- A. Kumari, A. Sharma, U. Malairaman and R. R. Singh, J. Lumin., 2018, 199, 174–182 CrossRef CAS
.
- D. Bera, L. Qian, T. K. Tseng and P. H. Holloway, Materials, 2010, 3, 2260–2345 CrossRef CAS
.
- L. J. Pan, J. W. Tu, H. T. Ma, Y. J. Yang, Z. Q. Tian, D. W. Pang and Z. L. Zhang, Lab Chip, 2018, 18, 41–56 RSC
.
- M. Guidi, P. H. Seeberger and K. Gilmore, Chem. Soc. Rev., 2020, 49, 8910–8932 RSC
.
- L. Capaldo, Z. Wen and T. Noël, Chem. Sci., 2023, 4230–4247 RSC
.
- J. B. Edel, R. Fortt, J. C. DeMello and A. J. DeMello, Chem.
Commun., 2002, 2, 1136–1137 RSC
.
- E. M. Chan, R. A. Mathies and A. P. Alivisatos, Nano Lett., 2003, 3, 199–201 CrossRef CAS
.
- B. K. H. Yen, N. E. Stott, K. F. Jensen and M. G. Bawendi, Adv. Mater., 2003, 15, 1858–1862 CrossRef CAS
.
- S. Marre, J. Park, J. Rempel, J. Guan, M. G. Bawendi and K. F. Jensen, Adv. Mater., 2008, 20, 4830–4834 CrossRef CAS
.
- Y. Pu, F. Cai, D. Wang, J. X. Wang and J. F. Chen, Ind. Eng. Chem. Res., 2018, 57, 1790–1802 CrossRef CAS
.
- M. S. Naughton, V. Kumar, Y. Bonita, K. Deshpande and P. J. A. Kenis, Nanoscale, 2015, 7, 15895–15903 RSC
.
- M. Abolhasani, C. W. Coley, L. Xie, O. Chen, M. G. Bawendi and K. F. Jensen, Chem. Mater., 2015, 27, 6131–6138 CrossRef CAS
.
- A. Toyota, H. Nakamura, H. Ozono, K. Yamashita, M. Uehara and H. Maeda, J. Phys. Chem. C, 2010, 114, 7527–7534 CrossRef CAS
.
- H. Nakamura, A. Tashiro, Y. Yamaguchi, M. Miyazaki, T. Watari, H. Shimizu and H. Maeda, Lab Chip, 2004, 4, 237–240 RSC
.
- R. Kikkeri, P. Laurino, A. Odedra and P. H. Seeberger, Angew. Chem., Int. Ed., 2010, 49, 2054–2057 CrossRef CAS PubMed
.
- M. Kawa, H. Morii, A. Ioku, S. Saita and K. Okuyama, J. Nanopart. Res., 2003, 5, 81–85 CrossRef CAS
.
- W. Wang, Y. Guo, C. Tiede, S. Chen, M. Kopytynski, Y. Kong, A. Kulak, D. Tomlinson, R. Chen, M. McPherson and D. Zhou, ACS Appl. Mater. Interfaces, 2017, 9, 15232–15244 CrossRef CAS PubMed
.
- Y. Shen, M. Abolhasani, Y. Chen, L. Xie, L. Yang, C. W. Coley, M. G. Bawendi and K. F. Jensen, Angew. Chem., Int. Ed., 2017, 56, 16333–16337 CrossRef CAS PubMed
.
- A. M. Nightingale and J. C. De Mello, J. Mater. Chem., 2010, 20, 8454–8463 RSC
.
- A. R. M. De Oliveira, L. Piovan, F. Simonelli, A. Barison, M. D. F. C. Santos and M. B. M. De Mello, J. Organomet. Chem., 2016, 806, 54–59 CrossRef
.
- I. Shestopalov, J. D. Tice and R. F. Ismagilov, Lab Chip, 2004, 4, 316–321 RSC
.
- J. Dai, X. Yang, M. Hamon and L. Kong, Chem. Eng. J., 2015, 280, 385–390 CrossRef CAS
.
- X. Yang, Q. Wang, Y. Tao and H. Xu, J. Chem. Res., 2002, 160–161 CrossRef CAS
.
- G. Emonds-alt, M. Lismont, G. Eppe and J. M. Monbaliu, J. Chem. Educ., 2017, 94, 775–780 CrossRef
.
- R. C. Mbwahnche, L. B. Matyushkin, O. A. Ryzhov, O. A. Aleksandrova and V. A. Moshnikov, J. Phys.: Conf. Ser., 2016, 741, 1–6 CrossRef
.
- D. Das and R. K. Dutta, J. Photochem. Photobiol., A, 2020, 400, 112709 CrossRef CAS
.
- S. Kubendhiran, Z. Bao, K. Dave and R. S. Liu, ACS Appl. Nano Mater., 2019, 2, 1773–1790 CrossRef CAS
.
- P. Bianchi, A. Dubart, M. Moors, D. Cornut, G. Duhirwe, J. Ampurdanés Vilanova and J. C. M. Monbaliu, React. Chem. Eng., 2023, 8, 1565–1575 RSC
.
- J. C. M. Monbaliu and J. Legros, Lab Chip, 2022, 23, 1349–1357 RSC
.
- R. Morodo, R. Riva, N. M. S. van den Akker, D. G. M. Molin, C. Jérôme and J. C. M. Monbaliu, Chem. Sci., 2022, 13, 10699–10706 RSC
.
- D. V. Silva-Brenes, N. Emmanuel, V. López Mejías, J. Duconge, C. Vlaar, T. Stelzer and J. C. M. Monbaliu, Green Chem., 2022, 24, 2094–2103 RSC
.
- Y. Chen, S. Renson and J. C. M. Monbaliu, Angew. Chem., Int. Ed., 2022, 61, e202210146 CrossRef CAS PubMed
.
- P. Bianchi, G. Petit and J. C. M. Monbaliu, React. Chem. Eng., 2020, 5, 1224–1236 RSC
.
- J. A. Burns, J. C. Butler, J. Moran and G. M. Whitesides, J. Org. Chem., 1991, 56, 2648–2650 CrossRef CAS
.
- N. Ollivier, T. Toupy, R. C. Hartkoorn, R. Desmet, J. C. M. Monbaliu and O. Melnyk, Nat. Commun., 2018, 9, 1–12 CrossRef CAS PubMed
.
- V. Agouridas, O. El Mahdi, V. Diemer, M. Cargoët, J. C. M. Monbaliu and O. Melnyk, Chem. Rev., 2019, 119, 7328–7443 CrossRef CAS PubMed
.
- D. J. Cline, S. E. Redding, S. G. Brohawn, J. N. Psathas, J. P. Schneider and C. Thorpe, Biochemistry, 2004, 43, 15195–15203 CrossRef CAS PubMed
.
- P. Kumar, T. Chiku, M. J. Carvan and D. S. Sem, Anal. Biochem., 2006, 352, 265–273 CrossRef PubMed
.
- C. R. Schlieve, A. Tam, B. L. Nilsson, C. J. Lieven, R. T. Raines and L. A. Levin, Exp. Eye Res., 2006, 83, 1252–1259 CrossRef CAS PubMed
.
- J. Ge, L. Zhou, F. Zhao and H. Dong, J. Org. Chem., 2017, 82, 12613–12623 CrossRef CAS PubMed
.
- S. Dery, P. S. Reddy, L. Dery, R. Mousa, R. N. Dardashti and N. Metanis, Chem. Sci., 2015, 6, 6207–6212 RSC
.
- N. Ollivier, A. Blanpain, E. Boll, L. Raibaut and O. Melnyk, Org. Lett., 2014, 16, 4032–4035 CrossRef CAS PubMed
.
- G. Tallec, C. Loh, B. Liberelle, A. Garcia-Ac, S. V. Duy, S. Sauvé, X. Banquy, F. Murschel and G. De Crescenzo, Bioconjugate Chem., 2018, 29, 3866–3876 CrossRef CAS PubMed
.
- A. Faucher and C. Grand-maître, Synth. Commun., 2003, 33, 3503–3511 CrossRef CAS
.
- A. Krezel, R. Latajka, G. D. Bujacz and W. Bal, Inorg. Chem., 2003, 42, 1994–2003 CrossRef CAS PubMed
.
- J. Podlaha and J. Podlahová, Collect. Czech. Chem. Commun., 1973, 38, 1730–1736 CrossRef CAS
.
- Y. Iida, T. Yamaguchi, T. Tanaka and S. Nakayama, J. Nucl. Sci. Technol., 2010, 47, 431–438 CrossRef CAS
.
- S. R. Alvarado, I. A. Shortt, H. J. Fan and J. Vela, Organometallics, 2015, 34, 4023–4031 CrossRef CAS
.
- M. A. Vairavamurthy, W. S. Goldenberg, S. Ouyang and S. Khalid, Mar. Chem., 2000, 70, 181–189 CrossRef CAS
.
- C. A. M. Bonilla, M. H. T. Flórez, D. R. Molina Velasco and V. V. Kouznetsov, New J. Chem., 2019, 43, 8452–8458 RSC
.
- B. Zeng, G. Palui, C. Zhang, N. Zhan, W. Wang, X. Ji, B. Chen and H. Mattoussi, Chem. Mater., 2018, 30, 225–238 CrossRef CAS
.
- C. Giansante and I. Infante, J. Phys. Chem. Lett., 2017, 8, 5209–5215 CrossRef CAS PubMed
.
- H. Li, W. Y. Shih and W. H. Shih, Ind. Eng. Chem. Res., 2007, 46, 2013–2019 CrossRef CAS
.
- Q. Wang, Y. Xu, X. Zhao, Y. Chang, Y. Liu, L. Jiang, J. Sharma, D. K. Seo and H. Yan, J. Am. Chem. Soc., 2007, 129, 6380–6381 CrossRef CAS PubMed
.
- G. Ramalingam, K. V. Saravanan, T. K. Vizhi, M. Rajkumar and K. Baskar, RSC Adv., 2018, 8, 8516–8527 RSC
.
- D. Mo, L. Hu, G. Zeng, G. Chen, J. Wan, Z. Yu, Z. Huang, K. He, C. Zhang and M. Cheng, Appl. Microbiol. Biotechnol., 2017, 101, 2713–2733 CrossRef CAS PubMed
.
- P. Bianchi and J.-C. M. Monbaliu, Angew. Chem., Int. Ed., 2024, 63, e202311526 CrossRef CAS PubMed
.
- H. Liu, J. S. Owen and A. P. Alivisatos, J. Am. Chem. Soc., 2007, 129, 305–312 CrossRef CAS PubMed
.
- R. García-Rodríguez and H. Liu, J. Am. Chem. Soc., 2012, 134, 1400–1403 CrossRef PubMed
.
- T. Jiawei, L. Yan, W. Jiexin, C. Jianfeng, S. Baochang and S. Lei, New J. Chem., 2015, 39, 4488–4493 RSC
.
- E. Ying, D. Li, S. Guo, S. Dong and J. Wang, PLoS One, 2008, 3, 1–7 CrossRef PubMed
.
- C. S. M. Martins, A. L. Silva, L. P. de Gouveia, I. Çaha, O. Bondarchuk, A. P. LaGrow, F. L. Deepak and J. A. V. Prior, Chemosensors, 2024, 12, 12040070 CrossRef
.
Footnote |
| † Electronic supplementary information (ESI) available: Detailed experimental protocols, microfluidic and mesofluidic setups. See DOI: https://doi.org/10.1039/d4sc01135j |
| This journal is © The Royal Society of Chemistry 2024 |


