 Open Access Article
Electrochemical valorization of HCl for the production of chlorine via a proton-filter functional covalent organic framework†
Sukhjot
Kaur‡
a,
Kayaramkodath C.
Ranjeesh‡
b,
Kalpana
Garg‡
a,
Safa
Gaber
b,
Shivangi
Mehta
a,
Tharamani C.
Nagaiah
 *a and
Dinesh
Shetty
 *bc
*bc
aDepartment of Chemistry, Indian Institute of Technology Ropar, Rupnagar, Punjab 140001, India. E-mail: tharamani@iitrpr.ac.in
bDepartment of Chemistry, Khalifa University of Science & Technology, P.O. Box 127788, Abu Dhabi, UAE. E-mail: dinesh.shetty@ku.ac.ae
cCenter for Catalysis and Separations (CeCaS), Khalifa University of Science & Technology, P.O. Box 127788, Abu Dhabi, UAE
First published on 6th March 2024
Abstract
Chlorine (Cl2) is one of the prime building blocks for several industrially important chemicals and engineering materials. HCl electrolysis is a well established technology for the production of Cl2 at the anode. However, combining it with the hydrogen evolution reaction (HER) at the cathode results in both high energy consumption and safety risks during unexpected shutdowns. Herein, we demonstrated the feasibility of integrating the chlorine evolution reaction (CER) together with the oxygen-depolarized cathode (ODC) by utilizing a nitrogen-rich two-dimensional in situ proton filter functional covalent organic framework (COF, Tta-Dfp) to suppress the HER. The as-synthesized Tta-Dfp COF was explored as a bifunctional catalyst towards the ODC and Cl2 evolution and exhibited outstanding activity towards Cl2 evolution with a faradaic efficiency of 92% and demonstrated excellent stability in a corrosive environment even under multiple shut-downs under mimicked industrial conditions. Furthermore, the visualization of the local electrocatalytic activity of the designed COF was analysed by redox competition mode of scanning electrochemical microscopy (RC-SECM) using a Pt ultra-microelectrode and extended to state-of-the-art electrocatalyst, Pt/C (20%). The 3D SECM images demonstrate the excellent stability of the Tta-Dfp catalyst in chlorine rich electrolyte. Therefore, metal-free catalysis for Cl2 production by integrating the two electrochemical processes with the added advantage of energy saving is a promising cost-effective approach.
Introduction
Chlorine (Cl2) is one of the prime building blocks for several industrially important chemicals and engineering materials which are crucial for day-to-day life. The demand for Cl2 has increased significantly in the last few decades owing to its excessive use in the fields of polymers, resins, and elastomers and sectors such as healthcare, agro-food, construction, electronics, textiles, transport, and cosmetics.1–3 The disinfectant capabilities of chlorine have significantly enhanced the quality of life for billions of individuals around the world. Chlorine is a crucial chemical component that is utilized in the production of several products that play a significant role in promoting public health and safety (chlorine-based water and kitchen disinfectants),4 advancing technology (wind turbine blades, smartphones, hybrid car batteries, etc.), enhancing nutrition, ensuring security (bullet-proof vests), and facilitating transportation (shatter-resistant windows, cables, and navigation systems). As reported by the Centers for Disease Control and Prevention (CDC 2020),5 chlorine is one of the major components that protect swimmers against waterborne pathogens.6 Also, according to the U.S. Centre for Disease Control and Prevention, the process of adding chlorine to drinking water is considered a highly important advancement in public health in the history of the United States.7 However, J. J. Rook found that halogenated organic compounds (trihalomethanes, THMs) could be generated as byproducts when chlorine combines with natural organic matter (NOM) in drinking water at a concentration up to ∼160 μg L−1 of water.8 Chlorinated surface water was found to be heavily polluted with chlorination by-products in 1975, according to the National Organics Renaissance Survey.9 Since then, studies have linked drinking chlorinated tap water with high levels of THM to a variety of negative health effects, such as bladder cancer, preterm birth, and miscarriages. But the limit to the level of THM in drinking water has been set to 80 μg L−1 by the U.S. under the Stage 1 and 2 Disinfectants and Disinfection Byproducts Rules.10 At the same time, utilities are combining primary disinfectants such as chlorine, ozone, or UV with secondary disinfectants such as chloramines rather than relying only on chlorine disinfection. Such combinations have helped reduce the formation of byproducts in drinking water. There is no doubt that the consumption of disinfection byproducts is fatal; however many alternate ways to utilize chlorine in these applications are being researched and have proven to be beneficial.11 Being an essential commercial commodity, the demand for Cl2 production is expected to reach up to approximately USD 27000 by 2030 with a compound annual growth rate (CAGR) of > 3.5% (from 2023 to 2030).12,13 Various analytical techniques such as the Deacon process14,15 and chlor-alkali electrolysis have been utilized for the production of Cl2.16,17 However, the Deacon process is limited by corrosion, high catalyst demand, limited yields, and low stability,18,19 while the chlor-alkali process is energy-intensive and consumes 50% of the total production costs.20 More importantly, chlorine also acts as a strong oxidizing agent in many organic processes and HCl is often released as a byproduct. Globally, 9.3 million tonnes of HCl are produced as byproducts each year, but only 15% is recycled back into Cl2, leaving an untapped market for Cl2 recovery that is worth 2.4 billion USD a year.13 This excess HCl production can be utilized effectively for Cl2 production rather than just quenching it with lime, which is not eco-friendly and a viable option for the large amount of produced HCl. Therefore, a smart way of valorizing HCl is recycling via electrolysis for the production of high-purity Cl2. HCl electrolysis is composed of the chlorine evolution reaction (CER) at the anode with a potential of 1.36 V vs. NHE and hydrogen production at the cathode (HER, E = 0.00 V vs. NHE) presenting sluggish kinetics with an overall potential of −1.36 V which is energy intensive and raises serious concerns considering the energy crisis.21,22In addition, the critical challenge associated with HCl electrolysis is the accumulation of H2 and Cl2 at the cathodic compartment under uncontrolled shutdown as all the membranes show a little permeability to chlorine, creating safety issues.23–25 These drawbacks can be overcome when the hydrogen production at the cathode is replaced by the oxygen reduction reaction (ORR, E = 1.23 V vs. NHE) known as the oxygen-depolarized cathode (ODC),26 while keeping the CER at the anode drastically reduces the cell voltage to −0.13 V compared to the conventional electrolysis (Ecell = −1.36 V vs. NHE), which in turn reduces the significant cost and energy saving by 30% (Scheme 1).27,28
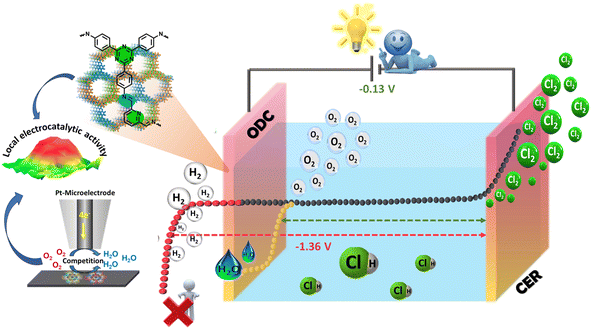 | ||
| Scheme 1 Schematic representation of the oxygen-depolarized cathode (ODC) coupled chlorine evolution reaction (CER) in HCl electrolysis. | ||
RhxSy/C29 and RuO2/TiO2 (ref. 15) have been considered the benchmark catalysts for Cl2 production, but their cost raises the expense of Cl2 generation on a pilot scale. On the other hand, Pt/C is the most efficient catalyst currently being studied for the oxygen reduction reaction (ORR);30,31 however, even in the presence of low chloride ion concentrations, it suffers from catalyst deactivation, poor stability, and dissolution.32 Till date, not much work has been reported except for a few studies on the ODC which are based on noble metal catalysts viz. Pt–Ag33 and Rh–RhSx/CNT23 and non-noble metal catalysts such as vacancy rich Ni2−xP,34 Co-NSC,35 OCNT-PVIM-ZnPOM,36, and Cu–Fe2O3/NC37 on the ODC coupled CER. Nevertheless, there is room for improvement in terms of stability and efficient bifunctionality of electrocatalysts for chlorine production.38,39 The implementation of covalent-organic frameworks (COFs) is revealing novel pathways and effective alternatives in the field of catalysis. These frameworks possess the intriguing ability to precisely adjust their chemical and physical properties at the molecular level through both synthetic and post-synthetic modifications.40–45 Adding to their positives, these framework materials show remarkable stability in corrosive acidic media. Recently, they have been utilised as efficient catalysts for the oxidative desulfurisation process.46 Moreover, with the focus on replacing the HER with the ODC, the emerging tunable proton-filter properties of COFs have been utilized to suppress the production of hydrogen (H2) and increase oxygen (O2) or nitrogen (N2) concentrations near the electrode surface.45,47 Hence, the implementation of a unified system incorporating in situ proton filtration and a catalytic centre has the potential to streamline electrode structures and enhance overall efficiency. Herein, we have explored nitrogen-rich two-dimensional in situ proton filtering Tta-Dfp COF as a bifunctional electrocatalyst for HCl oxidation and the oxygen reduction reaction. However, to the best of our knowledge this Tta-Dfp is the first metal free based catalyst for HCl electrolysis, which can perform both oxygen reduction (as ODC) and Cl2 evolution. Typically, in the pursuit of electrocatalyst advancement, conventional electrochemical methodologies such as cyclic voltammetry and rotating disc electrode measurements are commonly utilised to assess the efficacy of catalyst performance. Recently, the utilisation of scanning electrochemical microscopy (SECM) has extended to the assessment of localised catalytic activity.33,35 Presently, the in-depth analysis of the activity of the catalyst for the ORR in chorine rich media in comparison to state-of-the-art Pt/C was studied using SECM along with stability under mimicked industrial conditions.
Experimental details
![[thin space (1/6-em)]](https://www.rsc.org/images/entities/char_2009.gif) :
:![[thin space (1/6-em)]](https://www.rsc.org/images/entities/char_2009.gif) 1 v/v ratio). The reaction was conducted in a sealed pressure tube with a catalytic amount of acetic acid (50 μl, 6 M aqueous). After heating at 120 °C for five days, the yellow precipitate was collected by centrifuging and washed several times with N,N-dimethylacetamide (DMA), water, and acetone to remove any impurities and unreacted products. This was followed by drying the sample at 80 °C for 12 hours under vacuum. Tab-Dfp COF was obtained as a yellow solid with 79% of the isolated yield (Fig. S1a†).
1 v/v ratio). The reaction was conducted in a sealed pressure tube with a catalytic amount of acetic acid (50 μl, 6 M aqueous). After heating at 120 °C for five days, the yellow precipitate was collected by centrifuging and washed several times with N,N-dimethylacetamide (DMA), water, and acetone to remove any impurities and unreacted products. This was followed by drying the sample at 80 °C for 12 hours under vacuum. Tab-Dfp COF was obtained as a yellow solid with 79% of the isolated yield (Fig. S1a†).
![[thin space (1/6-em)]](https://www.rsc.org/images/entities/char_2009.gif) :
:![[thin space (1/6-em)]](https://www.rsc.org/images/entities/char_2009.gif) 1 v/v ratio). The reaction was conducted in a sealed pressure tube with a catalytic amount of acetic acid (50 μl, 6 M aqueous). After heating at 120 °C for five days, the yellow precipitate was collected by centrifuging and washed several times with N,N-dimethylacetamide (DMA), water, and acetone to remove any impurities and unreacted products. This was followed by drying the sample at 80 °C for 12 hours under vacuum. Tta-Dfp COF was obtained as a yellow solid with 82% isolated yield (Fig. S1b†).
1 v/v ratio). The reaction was conducted in a sealed pressure tube with a catalytic amount of acetic acid (50 μl, 6 M aqueous). After heating at 120 °C for five days, the yellow precipitate was collected by centrifuging and washed several times with N,N-dimethylacetamide (DMA), water, and acetone to remove any impurities and unreacted products. This was followed by drying the sample at 80 °C for 12 hours under vacuum. Tta-Dfp COF was obtained as a yellow solid with 82% isolated yield (Fig. S1b†).
Results and discussion
Material characterisation
The microstructural attributes of Tta-Dfp and Tab-Dfp were analyzed using powder X-ray diffraction (PXRD) patterns (Fig. 1a), wherein they displayed two distinct peaks: the peak at 2θ = 5.0° can be attributed to the (110) plane of the regularly ordered lattice and the broad peak centered at 2θ = 25.7° is attributed to the reflection from the (003) plane. Moreover, the best agreements between the experimental and simulated PXRD patterns were found for the layer-stacked structures (Fig. 1b) with an ABC sequence (Fig. S2,†Rwp = 3.19% and Rp = 4.85%, Table S1†).41,43,45,50 Fourier-transform infrared (FT-IR) spectra confirm the formation of imine (C![[double bond, length as m-dash]](https://www.rsc.org/images/entities/char_e001.gif) N) bonds by revealing a stretching vibration at 1690 cm−1 for both Tta-Dfp and Tab-Dfp (Fig. 1c). On comparison of FT-IR spectra of pristine monomers, the stretching bands corresponding to the aldehyde (1720–1735 cm−1) and the amine group (3300–3400 cm−1) were significantly attenuated in both COFs indicating successful imine condensation (Fig. S3†).41,43,50 It is important to note that COF polymerization may not be completely terminated and therefore a trace amount of peak was observed at 1720–1735 cm−1 for both Tta-Dfp and Tab-Dfp, which might have resulted from unreacted peripheral end functional groups in the 2D growth of COFs along with the possible defect sites.41,43,45,50 Afterward, 13carbon cross-polarization magic-angle spinning nuclear magnetic resonance (CP-MAS NMR) spectroscopy (Fig. S4 and S5†) presented a distinctive peak at ∼157 ppm corresponding to imine carbon (–C
N) bonds by revealing a stretching vibration at 1690 cm−1 for both Tta-Dfp and Tab-Dfp (Fig. 1c). On comparison of FT-IR spectra of pristine monomers, the stretching bands corresponding to the aldehyde (1720–1735 cm−1) and the amine group (3300–3400 cm−1) were significantly attenuated in both COFs indicating successful imine condensation (Fig. S3†).41,43,50 It is important to note that COF polymerization may not be completely terminated and therefore a trace amount of peak was observed at 1720–1735 cm−1 for both Tta-Dfp and Tab-Dfp, which might have resulted from unreacted peripheral end functional groups in the 2D growth of COFs along with the possible defect sites.41,43,45,50 Afterward, 13carbon cross-polarization magic-angle spinning nuclear magnetic resonance (CP-MAS NMR) spectroscopy (Fig. S4 and S5†) presented a distinctive peak at ∼157 ppm corresponding to imine carbon (–C![[double bond, length as m-dash]](https://www.rsc.org/images/entities/char_e001.gif) N), confirming the Tab-Dfp and Tta-Dfp formation.41,43,45,48–50 The carbon atoms of the phenyl, triazine, and pyridine groups are responsible for the signals at 120, 126, 130, 150, and 167 ppm respectively, confirming the Tta-Dfp's chemical structure. Similarly, the carbon atoms of the pyridine and phenyl rings of the Tab-Dfp structure are responsible for the signals at 147, 136, 126, 121, 114 ppm, confirming the Tab-Dfp's chemical structure. The UV-vis spectra of Tta-Dfp showed peaks at 430 and 475 nm which could be attributed to the π–π* transition of pyridine and n–π* transition of triazine, respectively, along with a broad band at 525 nm resulting from the delocalized π-electron cloud of Tta-Dfp (Fig. S6†). Tta-Dfp demonstrates its thermal stability up to 400 °C with < 10% weight loss (Fig. S7†) witnessed by thermogravimetric analysis (TGA). Furthermore, the N2 adsorption studies of Tta-Dfp and Tab-Dfp showed type-II adsorption isotherms with a Brunauer–Emmett–Teller (BET) surface area of 417.2 m2 g−1 (Fig. S8†) and 368.4 m2 g−1 (Fig. S10†) respectively.45–47,50 Besides, Tta-Dfp and Tab-Dfp exhibited a maximum pore size distribution of 1.53 nm and 1.55 nm respectively which are consistent with the suggested structural model and reported literature (Fig. S9 and S11†).45,48,49
N), confirming the Tab-Dfp and Tta-Dfp formation.41,43,45,48–50 The carbon atoms of the phenyl, triazine, and pyridine groups are responsible for the signals at 120, 126, 130, 150, and 167 ppm respectively, confirming the Tta-Dfp's chemical structure. Similarly, the carbon atoms of the pyridine and phenyl rings of the Tab-Dfp structure are responsible for the signals at 147, 136, 126, 121, 114 ppm, confirming the Tab-Dfp's chemical structure. The UV-vis spectra of Tta-Dfp showed peaks at 430 and 475 nm which could be attributed to the π–π* transition of pyridine and n–π* transition of triazine, respectively, along with a broad band at 525 nm resulting from the delocalized π-electron cloud of Tta-Dfp (Fig. S6†). Tta-Dfp demonstrates its thermal stability up to 400 °C with < 10% weight loss (Fig. S7†) witnessed by thermogravimetric analysis (TGA). Furthermore, the N2 adsorption studies of Tta-Dfp and Tab-Dfp showed type-II adsorption isotherms with a Brunauer–Emmett–Teller (BET) surface area of 417.2 m2 g−1 (Fig. S8†) and 368.4 m2 g−1 (Fig. S10†) respectively.45–47,50 Besides, Tta-Dfp and Tab-Dfp exhibited a maximum pore size distribution of 1.53 nm and 1.55 nm respectively which are consistent with the suggested structural model and reported literature (Fig. S9 and S11†).45,48,49
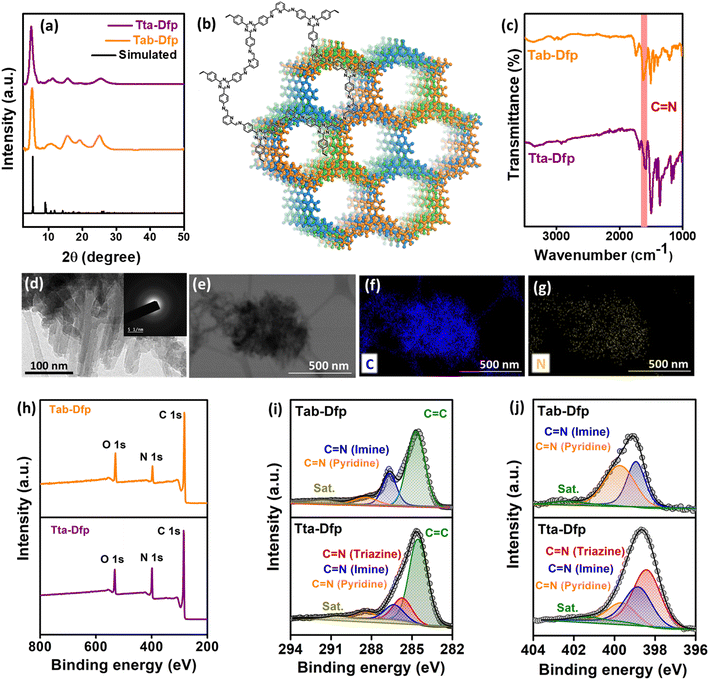 | ||
| Fig. 1 (a) Experimental and simulated P-XRD patterns of Tta-Dfp and Tab-Dfp,45 (b) ChemDraw and simulated structures of Tta-Dfp, (c) FT-IR spectra of Tta-Dfp and Tab-Dfp representing the formation of imine linkages, (d) HR-TEM image of Tta-Dfp (inset displaying the SAED pattern), (e–g) TEM-EDS scanned area and dot mapping images showing C and N, (h) XPS survey spectra, and deconvoluted (i) C 1s and (j) N 1s of Tta-Dfp and Tab-Dfp.45 | ||
The morphological aspects of Tta-Dfp and Tab-Dfp by field emission-scanning electron microscopy (FE-SEM) revealed spherical morphology with spikes (Fig. S12†). While high-resolution transmission electron microscopy (HR-TEM, Fig. 1d) exhibited a layered sheet-like/rod structure and the existence of diffuse rings in the selected area electron diffraction (SAED, inset, Fig. 1d) pattern confirms the amorphous nature of Tta-Dfp. As expected, the EDS (energy dispersive X-ray spectroscopy) dot mapping by both SEM and TEM confirms the presence of carbon and nitrogen which are dispersed homogeneously (Fig. 1e–g and S13†).45 Table S2† shows the weight percentage of C and N using EDS spectral analysis and CHN–O analysis which revealed the higher percentage of N content in Tta-Dfp due to the presence of triazine groups. The X-ray photoelectron spectroscopy (XPS) survey spectra of both Tta-Dfp and Tab-Dfp catalysts showed peaks at a binding energy (BE) of ∼284 eV, 396.9 eV and 532 eV attributing to the presence of C 1s, N 1s, and O 1s respectively (Fig. 1h). The difference in the intensity of the N 1s peak at 396.9 eV provided confirmation for the presence of a higher atomic ratio of N in Tta-Dfp as compared to Tab-Dfp.45 The deconvoluted C 1s XPS spectra in both Tta-Dfp and Tab-Dfp showed the presence of aromatic C![[double bond, length as m-dash]](https://www.rsc.org/images/entities/char_e001.gif) C, C
C, C![[double bond, length as m-dash]](https://www.rsc.org/images/entities/char_e001.gif) N (imine linkage), C
N (imine linkage), C![[double bond, length as m-dash]](https://www.rsc.org/images/entities/char_e001.gif) N (pyridine) and a carbon satellite at a BE value of 284.5, 286.4, 288.1 and 290.3 eV respectively (Fig. 1i). However, Tta-Dfp specified the presence of C
N (pyridine) and a carbon satellite at a BE value of 284.5, 286.4, 288.1 and 290.3 eV respectively (Fig. 1i). However, Tta-Dfp specified the presence of C![[double bond, length as m-dash]](https://www.rsc.org/images/entities/char_e001.gif) N (triazine) at a BE value of 285.7 eV, which was not perceived in Tab-Dfp. Moreover, N 1s XPS spectra in Tta-Dfp upon deconvoluting exhibit three peaks at a BE of 398.4, 398.8, 399.6 and 401.2 eV corresponding to C
N (triazine) at a BE value of 285.7 eV, which was not perceived in Tab-Dfp. Moreover, N 1s XPS spectra in Tta-Dfp upon deconvoluting exhibit three peaks at a BE of 398.4, 398.8, 399.6 and 401.2 eV corresponding to C![[double bond, length as m-dash]](https://www.rsc.org/images/entities/char_e001.gif) N (triazine), C
N (triazine), C![[double bond, length as m-dash]](https://www.rsc.org/images/entities/char_e001.gif) N (imine), C
N (imine), C![[double bond, length as m-dash]](https://www.rsc.org/images/entities/char_e001.gif) N (pyridine) and a satellite peak respectively (Fig. 1j), whereas Tab-Dfp signified the absence of the triazine moiety in its structure.
N (pyridine) and a satellite peak respectively (Fig. 1j), whereas Tab-Dfp signified the absence of the triazine moiety in its structure.
Electrochemical analysis
Furthermore, to investigate the faster kinetics of the electrode towards the potential-dependent electrocatalytic reaction, the Tafel slope was evaluated (Fig. S14B†). The lower Tafel slope of 348 mV dec−1 for Tta-Dfp compared to that for Tab-Dfp (402 mV dec−1) depicted the enhanced adsorption/desorption of intermediate species. The superior electrocatalytic activity of Tta-Dfp over Tab-Dfp may be attributed to the facile charge transfer at the electrode–electrolyte interface, which was estimated by electrochemical impedance spectroscopy (EIS). EIS spectra (Fig. S15 and Table S3†) show a lower charge transfer resistance (Rct) of 190.2 Ω (obtained from fitting the Nyquist plots using an equivalent circuit as shown in Fig. S16†) and a higher rate constant (1.40 × 10⁻⁵ cm s−1) for Tta-Dfp signified faster charge transfer kinetics accelerating the electrochemical activity.
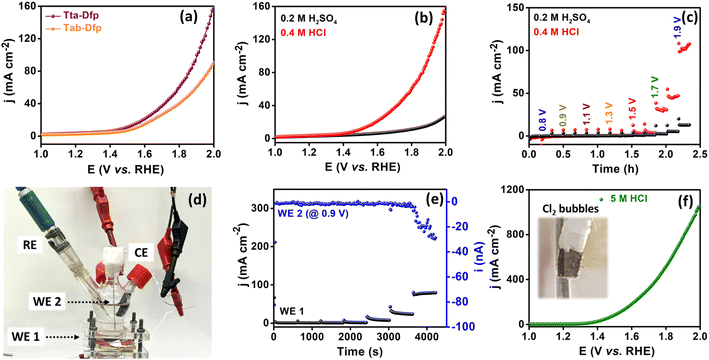
This could be attributed to the higher surface area of Tta-Dfp (Fig. S9†) and the exposure of more electrocatalytic active sites which was supported by the electrochemical surface area (ESCA, mm2) and specific surface area (SSA, mm2 mg−1) analyses. The higher ESCA (2.70 mm2) and SSA (22.5 mm2 mg−1) of Tta-Dfp in comparison to Tab-Dfp (Fig. S17 and Table S4†) validated the above conclusion. This was supported by chronoamperometry sequential (Fig. 2c) analysis performed at different potentials for 10 min each in 0.2 M H2SO4 and 0.4 M HCl. An increase in current density at 1.5 V in Cl− rich environments compared to that under Cl− free conditions confirmed the incompetence of the OER with the CER.
The produced Cl2 was further quantified using the iodometric titration method (calculations detailed in the ESI), exhibiting a high amount of Cl2 produced with a F.E. of 92%. Furthermore, the long-term stability was studied for 200 LSV cycles wherein a negligible change in the potential and cd which is further complemented by the chronoamperometry curve @ 1.5 V vs. RHE for 50 h (Fig. S18†) imposed high catalyst durability in corrosive HCl environments. Afterward, to understand the stability of the proposed catalyst under highly acidic conditions, the activity of Tta-Dfp towards the CER was probed by measuring the LSV curve in 5 M HCl (Fig. 2f), and strikingly, a high current density of about 1058 mA cm−2 was obtained at 2 V vs. RHE and the produced chlorine (Cl2) was evident by bubbles on the electrode (inset Fig. 2f).
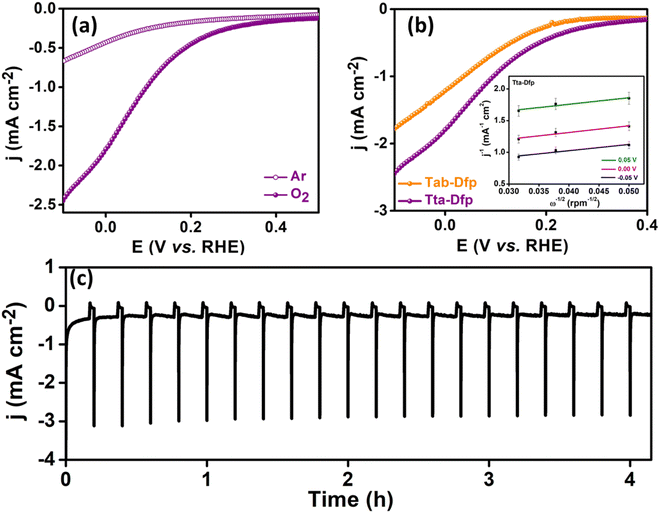
Furthermore, rotating disc electrode (RDE) tests were conducted to ascertain the kinetic characteristics of both variants towards the ORR. The RDE measurements were carried out by sweeping potential cathodically from 0.4 V to −0.1 V vs. RHE in O2 saturated 0.4 M HCl at a scan rate of 10 mV s−1 at different rotation rates varying from 0 to 1300 rpm (rotations per minute, Fig. S19A(a and b)†). The kinetic parameters were evaluated, using the Koutecky–Levich (K–L) equation. As can be seen from the K–L plots in Fig. S19c and d,† a linear relation was observed between the inverse of current density (j−1) and square root of the inverse of the rotation rate (ω−1/2) at various potentials (0.05 V, 0.00 V and −0.05 V vs. RHE), indicating the first order kinetics of the reaction. The number of electrons transferred was found to be 3.5 at 0.05 V vs. RHE for Tta-Dfp. Besides its high activity, stability studies were also carried out under the mimicked industrial shutdown conditions. For the same, chronoamperometric measurements were performed for 10 minutes of operation towards the ORR at 0.0 V vs. RHE followed by 2 minutes of shutdown at open circuit potential (OCP) in the Cl2 and O2 rich environment. As can be seen from Fig. 3c, the current response obtained for Tta-Dfp remains stable even after 20 shutdown cycles (4 hours) exhibiting high retention in the activity. Similarly, 10 shutdown cycles were recorded for benchmark electrocatalysts but as shown in Fig. S19B,† the current density relatively decreased in the first few cycles pointing towards their comparatively lower stability in corrosive HCl environments.
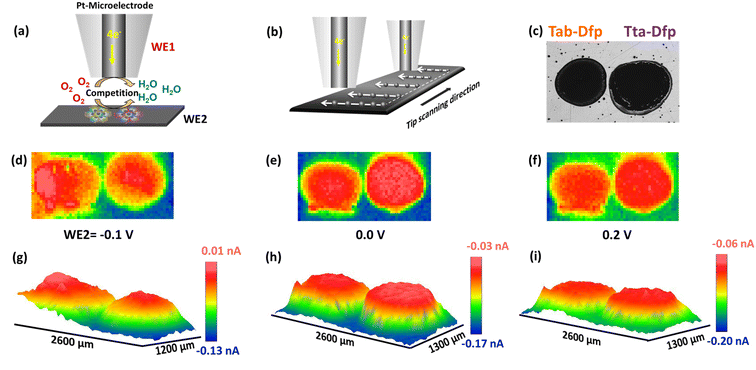
However, local electrocatalytic activity was also assessed for Tab-Dfp and higher tip current was observed as compared to Tta-Dfp.
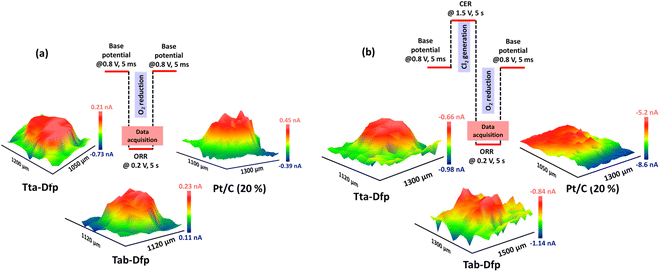
Besides the activity, the catalysts were highly stable which was witnessed from the array scan measurement performed in the x–y direction. For the same, two distinct pulse potential profiles were applied to the Pt tip (WE1) as schematically shown in Fig. 5a and b and the corresponding current response was recorded at the tip. In both the pulse profiles, the base potential (where WE1 is at rest) was chosen by recording the current at the tip with increasing potentials (Fig. S23a†). The obtained data in Fig. S23a† were further processed to obtain absolute current (absolute difference between the current measured before the first pulse and at the end of each sequential pulse) as a function of applied potential (Fig. S23b†). During the pulse profile as shown in Fig. 5a, the tip was subjected to the ORR (0.2 V) for 5 s after a base potential (0.8 V) of 5 ms while WE2 was constantly polarised at 0.2 V. As shown in Fig. 5a, Tta-Dfp showed higher activity as compared to Tab-Dfp. For comparison, the activity of the state-of-the-art catalyst of the ORR (Pt/C (20%)) was also probed using the same pulse profile. Towards the development of HCl electrolysers, a potential electrocatalyst is required with high stability; therefore accelerated degradation measurements have become mandatory. Therefore, to check the stability of both the catalysts along with Pt/C in chlorine and chloride ion rich environments, the pulse profile shown in Fig. 5b was applied on the Pt tip, wherein the ORR (0.2 V, 5 s) was preceded by the CER (1.5 V, 5 s) and base potential (0.8 V, 5 ms). As shown in Fig. 5b, the ORR activity of all the catalysts decreased, as compared to the first pulse profile, due to the replacement of localised O2 with the Cl2 generated during the second pulse profile. However, current at the Pt/C spot degraded whereas Tta-Dfp and Tab-Dfp demonstrated a stable current response. Moreover, this was also visualised from the optical microscopic images for Tta-Dfp, Tab-Dfp and Pt/C spots before and after the SECM analysis (Fig. S24†). No degradation in Tta-Dfp and Tab-Dfp was observed whereas Pt/C degraded due to the dissolution of Pt from the catalyst into the solution,21 demonstrating the superior activity of Tta-Dfp towards HCl electrolysis in Cl2 rich electrolyte.
Conclusions
In summary, we have designed in situ proton filtering Tta-Dfp and Tab-Dfp catalysts for HCl electrocatalysis for the production of chlorine. The designed catalysts were explored as bifunctional electrocatalysts towards both the ODC and CER under HCl electrolysis conditions. In situ proton filtering Tta-Dfp exhibited higher activity both in terms of onset potential and current density as an ODC simultaneously demonstrating its superior activity towards the CER and achieved high faradaic efficiency, i.e. 92% for the CER. Tta-Dfp shows excellent stability even under multiple shut-down controls under harsh acidic conditions. Furthermore, the visualization of the local electrocatalytic activity of the designed catalyst was performed by RC-SECM using a Pt ultra-microelectrode. The activity was also further extended to state-of-the-art Pt/C (20%) by RC-SECM and our proposed catalyst was shown to have excellent stability in harsh acidic circumstances. Therefore, being metal free, the developed Tta-Dfp electrocatalyst may offer a cost-effective bifunctional catalyst alternative to expensive noble-metal based electrocatalysts for HCl electrolysis.Conflicts of interest
There are no conflicts to declare.Acknowledgements
S. K. thanks CSIR (09/1005(0029)/2020-EMR-1) for fellowship. K. G. thanks the Prime Minister Research Fellowship (PMRF) for a fellowship. D. S. and R. K. C. acknowledge Khalifa University, Abu Dhabi, for the generous support of this research. S. M. thanks CSIR (09/1005(0045)/2020-EMR-1) for fellowship. DS acknowledges the financial support from the Khalifa University Competitive Internal Research Award (CIRA-2022). DS acknowledges resource support under the Center for Catalysis and Separations (CeCaS, grant RCII-2018-024). T. C. thanks the Science and Engineering Research Board (SERB, SPG/2021/002415). Dr Sushil Kumar, KU, is acknowledged for PXRD refinement. FESEM and XPS, Central Research Facility (CRF), IIT Ropar is acknowledged for characterization.References
- Y. Zhao, S. Gu, K. Gong, J. Zheng, J. Wang and Y. Yan, Angew. Chem., Int. Ed., 2017, 56, 10735–10739 CrossRef CAS PubMed
.
- M. Moser, C. Mondelli, A. P. Amrute, A. Tazawa, D. Teschner, M. E. Schuster, A. Klein-Hoffman, N. López, T. Schmidt and J. Pérez-Ramírez, ACS Catal., 2013, 3, 2813–2822 CrossRef CAS
.
- R. Stringer and P. Johnston, 2001.
- A. M. Nielsen, L. A. T. Garcia, K. J. S. Silva, L. P. Sabogal-Paz, M. M. Hincapié, L. J. Montoya, L. Galeano, A. Galdos-Balzategui, F. Reygadas, C. Herrera, S. Golden, J. A. Byrne and P. Fernández-Ibáñez, Int. J. Hyg. Environ. Health, 2022, 244, 114004 CrossRef CAS PubMed
.
- Centers for Disease Control and Prevention, 2020, https://www.cdc.gov/healthywater/drinking/public/water_disinfection.html?CDC_AA_refVal=https%3A%2F%2Fwww.cdc.gov%2Fhealthywater%2Fdrinking%2Fpublic%2Fchlorine-disinfection.html#print Search PubMed.
- The Association of Pool & Spa Professionals, 2011, https://www.phta.org/pub/?id=08fa1535-1866-daac-1599fb-f1535e1639fbe1531c1530 Search PubMed.
- M. A. Adefisoye and A. O. Olaniran, Antibiotics, 2022, 11, 564 CrossRef CAS PubMed
.
- J. Rook, Water Treat. Exam., 1972, 21, 259 CAS
.
- J. M. Symons, T. A. Bellar, J. K. Carswell, J. DeMarco, K. L. Kropp, G. G. Robeck, D. R. Seeger, C. J. Slocum, B. L. Smith and A. A. Stevens, J.–Am. Water Works Assoc., 1975, 67, 634–647 CrossRef CAS
.
-
U. E. Protection, National Primary Drinking Water Regulations: Stage 2 Disinfectants and Disinfection Byproducts Rule, Environmental Protection Agency, 2006, pp. 388–493, https://www.federalregister.gov/documents/2006/01/04/06-3/national-primary-drinking-water-regulations-stage-2-disinfectants-and-disinfection-byproducts-rule Search PubMed
.
- X.-F. Li and W. A. Mitch, Environ. Sci. Technol., 2018, 52, 1681–1689 CrossRef CAS PubMed
.
-
TI Partners, GlobeNewsWire, 2023 Search PubMed
.
- J. Pérez-Ramírez, C. Mondelli, T. Schmidt, O. F. K. Schlüter, A. Wolf, L. Mleczko and T. Dreier, Energy Environ. Sci., 2011, 4, 4786–4799 RSC
.
- D. Teschner, R. Farra, L. Yao, R. Schlögl, H. Soerijanto, R. Schomäcker, T. Schmidt, L. Szentmiklósi, A. P. Amrute, C. Mondelli, J. Pérez-Ramírez, G. Novell-Leruth and N. López, J. Catal., 2012, 285, 273–284 CrossRef CAS
.
- K. Seki, Catal. Surv. Asia, 2010, 14, 168–175 CrossRef CAS
.
- J. Crook and A. Mousavi, Environ. Forensics, 2016, 17, 211–217 CrossRef CAS
.
- S. Lakshmanan and T. Murugesan, Clean Technol. Environ. Policy, 2014, 16, 225–234 CrossRef CAS
.
- M. Mortensen, R. G. Minet, T. T. Tsotsis and S. Benson, Chem. Eng. Sci., 1996, 51, 2031–2039 CrossRef CAS
.
- C. Mondelli, A. P. Amrute, M. Moser, T. Schmidt and J. Pérez-Ramírez, Chimia, 2012, 66, 694 CrossRef CAS PubMed
.
- I. Garcia-Herrero, M. Margallo, R. Onandía, R. Aldaco and A. Irabien, Sci. Total Environ., 2017, 580, 147–157 CrossRef CAS PubMed
.
- A. Maljusch, T. C. Nagaiah, S. Schwamborn, M. Bron and W. Schuhmann, Anal. Chem., 2010, 82, 1890–1896 CrossRef CAS PubMed
.
- J. M. Ziegelbauer, A. F. Gullá, C. O'Laoire, C. Urgeghe, R. J. Allen and S. Mukerjee, Electrochim. Acta, 2007, 52, 6282–6294 CrossRef CAS
.
- C. Jin, W. Xia, T. C. Nagaiah, J. Guo, X. Chen, N. Li, M. Bron, W. Schuhmann and M. Muhler, J. Mater. Chem., 2010, 20, 736–742 RSC
.
- T. Vidakovic-Koch, I. G. Martinez, R. Kuwertz, U. Kunz, T. Turek and K. Sundmacher, Membranes, 2012, 2, 510–528 CrossRef CAS PubMed
.
- J.-L. Gustin, Chem. Health Saf., 2005, 12, 5–16 CrossRef CAS
.
- A. F. Gullá, L. Gancs, R. J. Allen and S. Mukerjee, Appl. Catal., A, 2007, 326, 227–235 CrossRef
.
- I. Moussallem, J. Jörissen, U. Kunz, S. Pinnow and T. Turek, J. Appl. Electrochem., 2008, 38, 1177–1194 CrossRef CAS
.
- S. Bechtel, A. R. Crothers, A. Z. Weber, U. Kunz, T. Turek, T. Vidaković-Koch and K. Sundmacher, Electrochim. Acta, 2021, 365, 137282 CrossRef CAS
.
-
R. J. Allen, J. R. Giallombardo, D. Czerwiec, E. S. De Castro and K. Shaikh, US Pat., US6855660B2, 2000 Search PubMed
.
- J. Zhang, Y. Yuan, L. Gao, G. Zeng, M. Li and H. Huang, Adv. Mater., 2021, 33, 2006494 CrossRef CAS PubMed
.
- M. Janssen, P. Weber and M. Oezaslan, Curr. Opin. Electrochem., 2023, 40, 101337 CrossRef CAS
.
- T. Schmidt, U. Paulus, H. A. Gasteiger and R. Behm, J. Electroanal. Chem., 2001, 508, 41–47 CrossRef CAS
.
- A. Maljusch, T. C. Nagaiah, S. Schwamborn, M. Bron and W. Schuhmann, Anal. Chem., 2010, 82, 1890–1896 CrossRef CAS PubMed
.
- Z. Zhou, Y. Kong, H. Tan, Q. Huang, C. Wang, Z. Pei, H. Wang, Y. Liu, Y. Wang, S. Li, X. Liao, W. Yan and S. Zhao, Adv. Mater., 2022, 34, 2106541 CrossRef CAS PubMed
.
- V. Singh and T. C. Nagaiah, J. Mater. Chem. A, 2019, 7, 10019–10029 RSC
.
- V. Singh, S. D. Adhikary, A. Tiwari, D. Mandal and T. C. Nagaiah, Chem. Mater., 2017, 29, 4253–4264 CrossRef CAS
.
- D. Gupta, A. Kafle, A. Chaturvedi and T. C. Nagaiah, ChemElectroChem, 2021, 8, 2858–2866 CrossRef CAS
.
- Y. Liu, C. Li, C. Tan, Z. Pei, T. Yang, S. Zhang, Q. Huang, Y. Wang, Z. Zhou, X. Liao, J. Dong, H. Tan, W. Yan, H. Yin, Z.-Q. Liu, J. Huang and S. Zhao, Nat. Commun., 2023, 14, 2475 CrossRef CAS PubMed
.
- Y. Wang, Y. Liu, D. Wiley, S. Zhao and Z. Tang, J. Mater. Chem. A, 2021, 9, 18974–18993 RSC
.
-
O. M. Yaghi, M. J. Kalmutzki and C. S. Diercks, Introduction to Reticular Chemistry: Metal-Organic Frameworks and Covalent Organic Frameworks, John Wiley & Sons, 2019 Search PubMed
.
- G. Das, F. Benyettou, S. K. Sharama, T. Prakasam, F. Gándara, V. A. de la Peña-O’Shea, N. i. Saleh, R. Pasricha, R. Jagannathan, M. A. Olson and A. Trabolsi, Chem. Sci., 2018, 9, 8382–8387 RSC
.
- L. Zhang, L. Yi, Z.-J. Sun and H. Deng, Aggregate, 2021, 2, e24 CrossRef CAS
.
- C. Krishnaraj, A. M. Kaczmarek, H. S. Jena, K. Leus, N. Chaoui, J. Schmidt, R. Van Deun and P. Van Der Voort, ACS Appl. Mater. Interfaces, 2019, 11, 27343–27352 CrossRef CAS PubMed
.
- C. Krishnaraj, H. S. Jena, K. S. Rawat, J. Schmidt, K. Leus, V. Van Speybroeck and P. Van Der Voort, ACS Appl. Mater. Interfaces, 2022, 14, 50923–50931 CrossRef CAS PubMed
.
- K. C. Ranjeesh, S. Kaur, A. K. Mohammed, S. Gaber, D. Gupta, K. Badawy, M. Aslam, N. Singh, T. Skorjanc, M. Finšgar, J. Raya, T. C. Nagaiah and D. Shetty, Adv. Energy Mater., 2024, 2303068, DOI:10.1002/aenm.202303068
.
- C. G. Piscopo, C. M. Granadeiro, S. S. Balula and D. Bošković, ChemCatChem, 2020, 12, 4721–4731 CrossRef CAS
.
- S. Liu, T. Qian, M. Wang, H. Ji, X. Shen, C. Wang and C. Yan, Nat. Catal., 2021, 4, 322–331 CrossRef CAS
.
- W. Zhao, P. Yan, B. Li, M. Bahri, L. Liu, X. Zhou, R. Clowes, N. D. Browning, Y. Wu, J. W. Ward and A. I. Cooper, J. Am. Chem. Soc., 2022, 144, 9902–9909 CrossRef CAS PubMed
.
- W. Ai, X. Du, Y. Yang, Z. Zheng, L. Zhai, B. Ma, S. Cui, P. Li, L. Mi and L. Qu, J. Mater. Chem. A, 2022, 10, 18602–18608 RSC
.
- A. M. Kaczmarek, H. S. Jena, C. Krishnaraj, H. Rijckaert, S. K. P. Veerapandian, A. Meijerink and P. Van Der Voort, Angew. Chem., Int. Ed., 2021, 60, 3727–3736 CrossRef CAS PubMed
.
- J. Liu, Y. Hu and J. Cao, Catal. Commun., 2015, 66, 91–94 CrossRef CAS
.
- L. Hao, S. Zhang, R. Liu, J. Ning, G. Zhang and L. Zhi, Adv. Mater., 2015, 27, 3190–3195 CrossRef CAS PubMed
.
- T. Sönmez, K. S. Belthle, A. Iemhoff, J. Uecker, J. Artz, T. Bisswanger, C. Stampfer, H. H. Hamzah, S. A. Nicolae, M.-M. Titirici and R. Palkovits, Catal. Sci. Technol., 2021, 11, 6191–6204 RSC
.
- J.-D. Yi, R. Xu, Q. Wu, T. Zhang, K.-T. Zang, J. Luo, Y.-L. Liang, Y.-B. Huang and R. Cao, ACS Energy Lett., 2018, 3, 883–889 CrossRef CAS
.
Footnotes |
| † Electronic supplementary information (ESI) available. See DOI: https://doi.org/10.1039/d3ta06948f |
| ‡ Equal contribution. |
| This journal is © The Royal Society of Chemistry 2024 |

