Deactivation processes of homogeneous Pd catalysts using in situ time resolved spectroscopic techniques†
Moniek
Tromp
a,
Jelle R. A.
Sietsma
a,
Jeroen A.
van Bokhoven
ac,
Gino P. F.
van Strijdonck
b,
Richard J.
van Haaren
b,
Ad M. J.
van der Eerden
a,
Piet W. N. M.
van Leeuwen
b and
Diek C.
Koningsberger
*a
aDebye Institute, Dept. Inorganic Chemistry and Catalysis, P.O. Box 80083, 3508 TB, Utrecht, The Netherlands. Fax: +31 30 251 1027; Tel: +31 30 253 7400
bInstitute for Molecular Chemistry, Nieuwe Achtergracht 166, 1018 WV, Amsterdam, The Netherlands
cLaboratory for Technical Chemistry, ETH Hönggerberg, CH-8093, Zurich, Switzerland
First published on 5th December 2002
Abstract
UV-Vis, combined with ED-XAFS shows, for the first time, the evolution of inactive Pd dimers and trimers, that are a possible first stage in the deactivation process of important palladium catalysed reactions, leading to larger palladium clusters and eventually palladium black.
Palladium is the most widely used metal in transition metal catalysed organic synthesis, as it is capable of catalysing a wide variety of reactions. While for many applications the desired selectivities and activities can be achieved, the stability of many palladium catalysts is too low for large-scale industrial processes. It is generally assumed that the deactivation of the catalyst occurs via clustering of palladium intermediates in the catalytic cycle.1 The stability towards the formation of inactive clusters and the performance of the catalyst are influenced by modification of the metal centre with a ligand, most often a phosphine ligand.
Although control of the deactivation is crucial for applications in industry, so far, very few studies to this behaviour have been reported.1 NMR techniques are not suitable to study the aggregation behaviour of the catalyst, because the palladium atom itself cannot be observed. The indirect study of the clusters via the phosphorus atoms of the ligand (31P NMR) is hampered by the high mobility of the complexes.
XAFS spectroscopy2 is a very powerful technique for the detailed determination of the local structure around an absorbing atom. Measurements can be performed in situ. Spectra can be obtained in the millisecond range, using an energy dispersive data acquisition set-up, so-called energy dispersive XAFS (ED-XAFS).3 Recently, an (ED-)XAFS study on homogenous Pd catalytic systems has been presented in literature.4 UV-Vis detects the electronic absorption by molecules both in situ and time resolved. In our case, absorption bands originating from metal-metal bonds are observed.
Here we present preliminary results of our UV-Vis‡ and ED-XAFS§ studies on the deactivation of Pd catalysts in the well-known allylic substitution reaction.5 The catalytic cycle of these reactions is drawn in the left part of Scheme 1. The size and nature of the inactive homogeneous palladium clusters formed during the reaction as a function of time, depicted on the right hand side, have been studied in detail, as will be described in this paper.
 | ||
| Scheme 1 The catalytic cycle of the allylic substitution reaction (left side) and the proposed deactivation mechanism (right side). | ||
To study the deactivation reactions, the allylic amination is carried out using different (1,1-dimethylallyl)Pd(P–P ligand)OTf complexes as the catalytic intermediate and piperidine as the nucleophile. First, stoichiometric reactions are studied by omitting the allylic substrate, thereby enhancing the rate of deactivation and moreover, decreasing the number of possible reactions. The catalytic reaction is performed using allyl acetate as the substrate. The reactions are monitored in situ at ambient conditions. In addition to different (P–P)-ligands, the deactivation behaviour in different solvents is investigated.
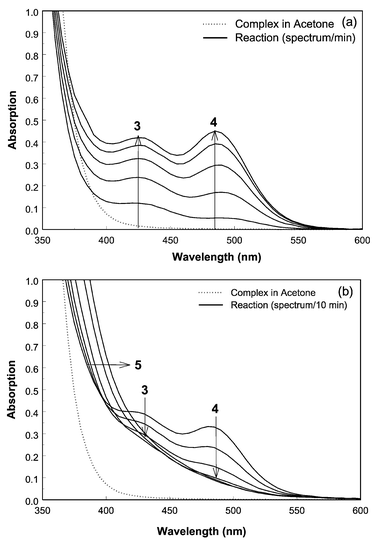
Fig. 1(a) and (b) show typical time resolved UV-Vis spectra for the reaction of 2 mM (dppe)Pd(C5H9)OTf with 10 mM piperidine in acetone (concentrations after mixing). The (dppe)Pd(C5H9)OTf, complex 1, is not UV-Vis active in the energy region >400 nm (for all solutions applied) as can be observed in Fig. 1(a) (dotted line). Up to ∼390 nm the starting complex shows strong absorptions. Immediately after addition of the piperidine, the reaction mixture changes colour from light yellow to red which is indicative for the formation of Pd–Pd interactions.6–9 This colour change is reflected in the UV-Vis spectra by the appearance of peaks at ∼430 and ∼490 nm, respectively (peaks 3 and 4 in Fig. 1). In time, peaks 3 and 4 first increase, indicated by the arrows in Fig. 1(a). Deconvolution reveals that two species are formed which are assigned to Pd dimers and trimers, respectively, based on peak position.6–9 Measurements at variable temperatures confirm the assignment of the peaks to metal–metal transitions.7,10
 | ||
| Fig. 1 Time resolved UV-Vis spectra of the allylic amination reaction of the (dppe)Pd(C5H9)OTf complex in acetone (dotted line, t = 0 s) with piperidine. (a) One spectrum every 1 min (solid lines). (b) One spectrum every 10 min (solid lines). | ||
In time, the reaction mixture turns dark red while peaks 3 and 4 disappear (Fig. 1(b)). Meanwhile, the band showing strong absorption up to ∼390 nm increases and becomes broader (peak 5) in time, suggesting the formation of large palladium clusters (colloidal palladium).11 The simultaneous disappearance of peaks 3 and 4 suggests that the dimers and trimers are intermediates in the formation of colloidal palladium. Determination of the colloidal peak is extremely difficult since the peak almost completely overlaps with absorptions of the starting complex. Eventually, Pd metal precipitates in the cuvette.
The rate of formation of dimers, trimers and further deactivation is observed to be a function of both ligand and solvent. For complexes with a small bite angle, both dimers and trimers are observed whereas for large bite angle ligands only dimers are formed. Increasing the polarity of the solvent decreases the deactivation rate.
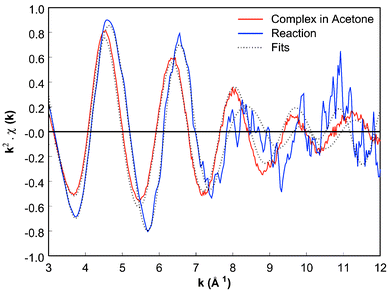
To gain more insight into the structure of the multi-Pd species, ED-XAFS experiments have been performed. The results of a complex with a large bite angle ligand are shown here, since it forms only dimer complexes and thus facilitates the EXAFS analysis. For a good signal to noise ratio, concentrations of 35 mM (Xantphos)Pd(C5H9)OTf complex and 175 mM piperidine in acetone, after mixing, were used. With the ED set-up the reaction was followed with a time resolution of ∼1.2 s, each spectrum being an average of 15 spectra with an acquisition time of 10 ms each. Since this deactivation reaction is relatively slow, the EXAFS data of both the (Xantphos)Pd(C5H9)OTf complex in solution (solid line) and the complex after ∼5 min of reaction (dotted line) are given in Fig. 2.14 EXAFS data analysis, using the difference file technique,15 of the (Xantphos)Pd(C5H9)OTf complex in solution shows a structure identical to the solid state.12–14 The ED-XAFS measurements of the reaction with piperidine confirm the appearance of a Pd–Pd interaction in time with a Pd–Pd distance of ∼2.70 Å.16,17 Moreover, EXAFS analysis shows that the Pd–ligand system is still intact and one allylic moiety C5H9 remains present in the formed palladium dimers. Since EXAFS is a bulk technique, the average of all structures is obtained complicating the analysis, especially for Pd complexes forming more different Pd clusters during reaction. Nonetheless, Pd–Pd interaction is always observed in solution. ED-XAFS confirms the rate dependence of formation of multi-Pd clusters on ligand and solvent used.
 | ||
| Fig. 2 k 2-Weighted ED-XAFS spectra of (a) (Xantphos)Pd(C5H9)OTf in acetone at t = 0 min (b) allylic substitution reaction with piperidine at t = ∼5 min. | ||
Both time resolved techniques indicate the formation of dimers, trimers and possibly larger clusters directly from the start of the catalytic allylic amination reaction. The rate of formation of Pd clusters is lower compared with the stoichiometric reaction.
Based on our EXAFS analysis and on literature of correlated Pd(P–P ligand) dimers16 and Pd(I) dimers,17 the dimer and trimer structures, as given in Scheme 1, are proposed. During the allylic amination, the (P–P ligand)Pd(allyl) complex reacts to a (P–P ligand)Pd0-complex forming dimers, trimers and bigger clusters, eventually precipitating as palladium black. This deactivation starts immediately under true catalytic conditions, as already observed during kinetic studies,18 thereby directly lowering the efficiency of the catalyst. The rates of formation and detailed structures of the different complexes are topics of investigation.
For the first time, time resolved spectroscopic techniques are used for the detailed study of deactivation processes of homogeneous Pd catalysts. Important knowledge about the deactivation mechanism is obtained, directly influencing the efficiency of the catalysts. A set-up for the simultaneous acquisition of both ED-XAFS and UV-Vis spectra is currently being tested.
We acknowledge the European Synchrotron Radiation Facility in Grenoble France for provision of synchrotron radiation facilities and Dr S. Diaz-Moreno, Dr S. G. Fiddy and Dr S. Pascarelli for assistance in using the stopped-flow equipment and beamline ID24. Professor Dr B. M. Weckhuysen is acknowledged for his helpful discussions on UV-Vis. The NRSC-Catalysis is gratefully acknowledged for the financial support for M. T.
Notes and references
- P. W. N. M. van Leeuwen, Appl. Catal. A, 2001, 212, 61 CrossRef CAS.
- X-ray Absorption, eds. D. C. Koningsberger and R. Prins, Wiley, New York, 1988 Search PubMed.
- See, for example: A. J. Dent, Top. Catal., 2002, 18(1–2), 27 Search PubMed; M. A. Newton, A. J. Dent and J. Evans, Chem. Soc. Rev., 2002, 31, 83 Search PubMed.
- J. Evans, L. O’Neill, V. L. Kambhampati, G. Rayner, S. Turin, A. Genge, A. J. Dent and T. Neisius, J. Chem. Soc., Dalton Trans., 2002, 2207 RSC.
- B. M. Trost and D. L. van Vranken, Chem. Rev., 1996, 96, 395 CrossRef CAS.
- O. L. Alves, M.-C. Vitorge and C. Sourisseau, Nouv. J. Chim., 1983, 7(4), 231 Search PubMed.
- P. D. Harvey and Z. Murtaza, Inorg. Chem., 1993, 32, 4721 CrossRef CAS.
- L. S. Benner and A. L. Balch, J. Am. Chem. Soc., 1978, 100(19), 6099 CrossRef CAS.
- R. J. H. Clark and C. Sourisseau, Nouv. J. Chim., 1980, 4(5), 287 Search PubMed.
- V. M. Miskowski, T. P. Smith, T. M. Loehr and H. B. Gray, J. Am. Chem. Soc., 1985, 107, 7925 CrossRef CAS.
- J. A. Creighton and D. G. Eadon, J. Chem. Soc., Faraday Trans., 1991, 87(24), 3881 RSC.
- M. Tromp, J. A. Van Bokhoven, R. J. van Haaren, G. P. F. van Strijdonck, A. M. J. van der Eerden, P. W. N. M. van Leeuwen and D. C. Koningsberger, J. Am. Chem. Soc., 2002 , in press.
- M. Tromp, J. A. van Bokhoven, G. P. F. van Strijdonck, P. W. N. M. van Leeuwen and D. C. Koningsberger, in preparation.
- The Fourier Transforms of the ED-XAFS data can be found in the ESI†, including the detailed analysis results.
- D. C. Koningsberger, B. L. Mojet, G. E. van Dorssen and D. E. Ramaker, Top. Catal., 2000, 10, 143 Search PubMed.
- P. H. M. Budzelaar, P. W. N. M. van Leeuwen and C. F. Roobeek, Organometallics, 1992, 11, 23 CrossRef CAS.
- P. Leoni, M. Pasquali, T. Beringhelli, G. D’Alfonso and A. P. Minoja, J. Organomet. Chem., 1995, 488, 39 CrossRef CAS.
- R. van Haaren, Thesis, University of Amsterdam, The Netherlands, 2001.
- M. Hagelstein, C. Ferraro, U. Hatje, T. Ressler and W. Metz, J. Synchrotron Radiat., 1995, 2, 174 CrossRef CAS.
Footnotes |
| † Electronic supplementary information (ESI) available: EXAFS data and Fourier Transform. See http://www.rsc.org/suppdata/cc/b2/b206758g/ |
| ‡ The UV-Vis spectra were recorded on a Varian Cary 50 UV-VIS spectrophotometer. The time resolved measurements were carried out with an optical fibre probe. |
| § ED-XAFS experiments are performed at beamline ID24 of the ESRF, Grenoble, France, using a commercially available BioLogic SFM-4 stopped-flow apparatus in the Energy Dispersive set-up of ID24. Data were acquired using a Laue monochromator.19 Energy calibration was carried out using a palladium foil. Data are collected using a masked Peltier cooled Princeton CCD camera. |
| This journal is © The Royal Society of Chemistry 2003 |
