Generation of ROS in cells on exposure to CW and pulsed near-infrared laser tweezers
Samarendra Kumar
Mohanty
*,
Mrinalini
Sharma
and
Pradeep Kumar
Gupta
Biomedical Applications Section, R & D BLOCK D, Centre for Advanced Technology, Indore, 452 013, India. E-mail: smohanty@cat.ernet.in; Fax: 0091-731-2488430
First published on 6th December 2005
Abstract
We report the results of a study on generation of reactive oxygen species (ROS) and changes in the membrane potential of mitochondria of carcinoma of cervix (HeLa) and Chinese hamster ovary (CHO) cells following exposure to continuous wave (cw) or pulsed Nd: YAG laser (1064 nm). For a given laser irradiation, the generation of ROS and induced changes in the membrane potential of mitochondria were more pronounced for HeLa cells as compared to CHO cells. However, in both the cells the laser dose required to elicit a given change was much lower with pulsed laser exposure compared to that required with a cw laser exposure. This suggests involvement of photothermal effects in the laser irradiation induced changes. Mechanistic studies using quenchers for ROS suggest that laser irradiation leads to generation of hydroxyl radicals.
Introduction
Considerable interest exists in the use of laser micromanipulation techniques for various applications in biological research and technology. While continuous wave (cw) lasers are being used for applications like, sorting of cells, manipulation of sub-cellular organelles, measuring the mechanical properties of cytoskeletal assemblies and membranes,1 pulsed lasers are being used for microsurgery2 and injection of exogenous material into cells.3,4 Cellular components have strong absorption in the UV and visible region because of nucleic acids and proteins. Water, the other major constituent of cells, has significant absorption beyond about 1100 nm. In the near infrared spectral region (700–1100 nm) only some chromophores of the respiratory chain enzymes (notably cytochrome c oxidase)5 have relatively weak absorption. Because of the much reduced absorption by cells in the near infrared spectral range (700–1100 nm), lasers operating in this spectral range are preferred for manipulation of cells with minimal damage. However, even with the use of lasers in this spectral region, the possibility of adverse effects on the cells being manipulated is a matter of concern. Indeed adverse effects like a decrease in cloning efficiency6 and DNA damage7 have been reported in cells exposed to near IR optical trapping beam. The decrease in cloning efficiency and increased NADH fluorescence observed8 in cells trapped at 760 nm have been attributed6,8 to photochemical reactions arising from two-photon absorption in cellular chromophores. While involvement of reactive oxygen species in the near infrared wavelength (800 nm) induced cellular damage has also been shown recently,9 at wavelengths longer than 800 nm, transient local heating10 of cellular targets is believed to be responsible for cellular damage. Indeed, damage observed at 810 nm was attributed to photothermal process as confirmed by experiments11 on Caenorhabditis elegans carrying heat shock responsive reporter gene. We report in this paper the results of our investigations on the relative role of photochemical and photothermal processes in the influence of 1064 nm beam on trapped cells. For this purpose we have investigated the generation of oxidative stress and the site of ROS generation under different exposure conditions—pulsed and cw.Material and methods
Cell culture
Carcinoma of cervix (HeLa) and Chinese hamster ovary (CHO) cells were obtained from the National Center of Cell Sciences (NCCS), Pune, India. These were grown in Eagle's minimal essential medium (EMEM) and Rosewell Park Institute medium (RPMI) (Himedia, India) supplemented with 10% fetal bovine serum (Himedia, India) and antibiotics respectively. Cultures were maintained at 37 °C in an incubator with 5% CO2 atmosphere. Cells grown in monolayer for 48 h were trypsinized (0.25%, Himedia, India) and after suitable dilution, the cell suspension was placed on glass cover slips of thickness of ∼0.10 mm for irradiation.Detection of reactive oxygen species (ROS)
To study the generation of ROS by laser irradiation, cells were labeled with a reactive oxygen species marker, dihydrofluorescin (DCDHF, Molecular Probes), that produces a green fluorescence when it gets oxidized.12 Before exposing the cells to laser, these were incubated with 20 µM of DCDHF for 20 min at 37 °C, washed twice to remove the unbound dye. Labeled cells were visualized by epifluorescence microscopy (excitation, 450–490 nm; emission, 515–565 nm). In order to identify the type of reactive species involved, cells were also irradiated in the presence of a hydroxyl radical quencher (manitol, 20 mM) or singlet oxygen quencher (sodium azide, 1 mM). By subjecting the DCDHF labeled cell suspension to different temperatures, the effect of heating of CHO and HeLa cells on ROS generation was studied.Assessment of mitochondrial integrity
Estimation of mitochondrial membrane potential was carried out using fluorescent probe, rhodamine 123 (Molecular Probes). This enters the mitochondria and the retention of this probe in mitochondria depends on electrochemical and proton gradient.13 As potential decreases, the marker is progressively excluded from the mitochondria. Cells were incubated with rhodamine 123 (1 µg ml−1) at 37 °C for 5 min and subsequently washed twice to remove the unbound dye and then placed on a cover slip. Randomly selected cells were exposed to the laser beam. In order to monitor fluorescence of rhodamine 123, the cells were excited using a 450–490 nm band pass filter and a 515–565 nm band pass filter for emission.Laser irradiation set up
A conventional laser tweezers-microbeam set up was used for exposing cells to cw and pulsed laser irradiation. The setup (Fig. 1) comprised of a Q-switched Nd: YAG laser (pulse energy <50 mJ; repetition rate ≤10 Hz, Solid State Laser Division, CAT, Indore, India) coupled to the epifluorescence port of the microscope. A convex lens (f = 100 mm), added externally into the epifluorescence illumination path along with the lens present in the path constituted a 2× beam expander. A dichroic mirror (DM) having high reflectivity at near infrared laser wavelengths and high transmittance for the UV and visible wavelengths was used to ensure that the sample could be simultaneously exposed to the excitation light from the epi-illumination source and the pulsed 1064 nm laser beam. A cw Nd: YAG laser (1064 nm, 5 W, Solid State Laser Division, CAT, Indore, India) was also coupled to the 100× objective via the base port of the inverted microscope (Axiovert 135 TV, Carl Zeiss GmbH, Jena, Germany). A concave lens (f = −50 mm), added externally into the path and the tube lens of the microscope constituted a 4× beam expander. The dichroic beam splitter (DBS) in the path of the cw Nd: YAG laser beam reflects the emitted fluorescence or transmitted visible light to the CCD. An infrared cut off filter was placed before the CCD to reject the back-scattered laser light. The 50/50 beam splitter (BS) was used to combine the pulsed and cw Nd: YAG laser beams. The cells could be trapped using both the cw and pulsed beam.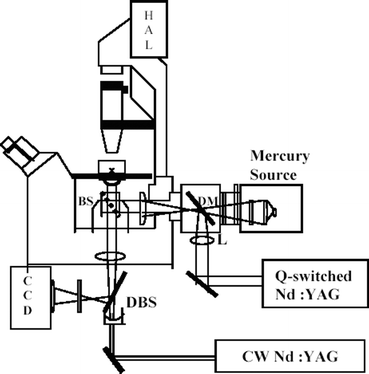 | ||
| Fig. 1 Schematic diagram of laser micromanipulation set up. For details see text. | ||
Calibration of trapping laser beam power
The cw Nd: YAG laser trapping beam power was adjusted to provide powers of up to 200 mW at the focal plane of the objective. For pulsed Nd: YAG laser, energy of the beam was varied so as to obtain energy of up to 200 µJ (pulse width: 16 ns, peak intensity: 24.8 × 10³ W µm−2) at the trapping plane. The trapping laser beam power at the back aperture of the objective was monitored with a power meter (Scientech, USA). For estimating the transmission factor of the objective, the dual objective method14 was used to correct for the total internal reflection losses at the objective–oil–glass–water interfaces. The transmission factor of two cascaded objectives was found to be 0.333. From this the transmission factor of a single l00× Plan Neofluor phase Zeiss objective was estimated to be (0.333)1/2i.e. 0.577. The diffraction limited spot size for the laser beams was estimated to be ∼0.8 µm using the relation (d = 1.22 × wavelength/numerical aperture). The time of exposure was varied from 0 to 30 min in interval of 3 min for both cw and pulsed irradiation.Image acquisition and analysis
Generation of ROS and damage to mitochondria was monitored using fluorescence and video microscopy respectively. Fluorescence images of cells labeled with DCDHF and rhodamine 123 were captured using CCD and frame grabber (DT3155) and quantitated using 4spec image analysis software (Stanford Computer Optics Inc).Results
Generation of ROS by 1064 nm laser tweezers/microbeam
In Fig. 2 we show the fluorescence image of DCDHF labeled HeLa cells trapped for various durations with pulsed laser (160 µJ pulse−1, 10 Hz). At this power level of trapping beam, DCDHF fluorescence was observed in HeLa cells, after 3 min of laser exposure indicating generation of ROS. Cells not exposed to laser did not show DCDHF fluorescence. A line scan (panel B) of fluorescence intensity from the cell, along horizontal and vertical directions passing through the point of irradiation (shown, marked by a circle, in image 2c), after it was subjected to 3 min of laser exposure, showed that the intensity around the point of irradiation was much larger than the surrounding region suggesting that ROS generation was initiated at the laser focal point. With increase in laser exposure, fluorescence was observed from the entire cell (image 2d). Leakage of dye from the cell was observed on further increase in exposure duration (images e and f). Qualitatively similar results were obtained in CHO cells exposed to laser at same power levels. However, in these cells, fluorescence was observed after longer laser exposure than HeLa cells. The possibility that ROS might get generated by two-photon absorption of DCDHF was also checked by irradiating a solution of DCDHF (20 µM) with the pulsed 1064 laser (160 µJ, 10 Hz). No detectable fluorescence was observed (data not shown) confirming that endogenous sources contribute to the observed generation of ROS in cells.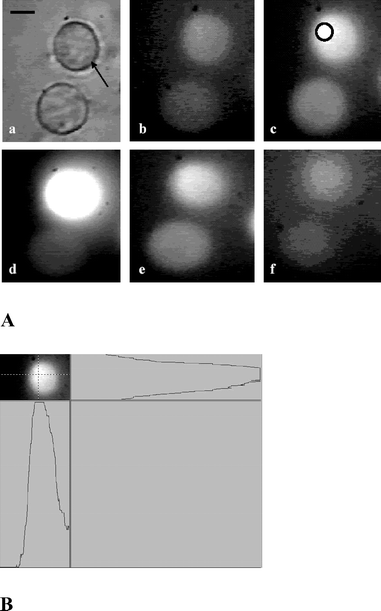 | ||
| Fig. 2 Digitized time-lapse images of DCDHF labeled HeLa cell optically trapped by pulsed Nd: YAG laser beam. Panel A: Bright field image. (a) The trapped cell is marked by arrow. Fluorescence image of cell without laser exposure (b), fluorescence images after exposure of 3 min (c), 12 min (d), 24 min (e) and 30 min (f). The circle in image (c) shows site of origin of ROS generation. A line scan of fluorescence intensity from the cell, along horizontal and vertical directions passing through the point of irradiation (shown, marked by a circle, in image 2c), is shown in panel B. All images are recorded at the same magnification. Scale bar: 10 µm. | ||
In Fig. 3, we show the measured DCDHF fluorescence intensity as a function of exposure time at different laser beam powers. Results obtained when cells were exposed to laser in presence of manitol are also presented. These are discussed later. It is evident from the figure that for a given exposure duration, the DCDHF fluorescence intensity and hence the ROS generation increases with increasing average power of laser. When cells were exposed to pulsed laser at an average laser power of 2 mW, the fluorescence intensity of DCDHF reached its maximum at 12 min. For cells exposed to lower laser powers, the maximum fluorescence intensity was observed after longer durations. At all power levels, a reduction in DCDHF fluorescence was observed in cells exposed to laser for longer duration. The reduction in fluorescence intensity was faster when higher laser powers were used. In cells exposed to laser beam of average power <1 mW, increase in DCDHF fluorescence was not observed even up to 5 min of irradiation. However, fluorescence was observed in these cells after a period of 5–10 min of switching off the laser (data not shown). In HeLa cells trapped by cw Nd: YAG laser beam (200 mW) DCDHF fluorescence was weak (Fig. 3) even for trap durations up to 30 min. In CHO cells no significant fluorescence was observed even up to 30 min of exposure (data not shown).
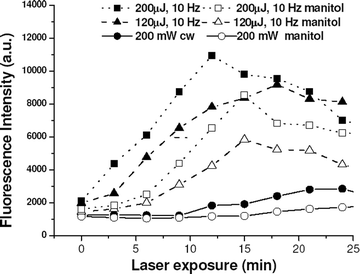 | ||
| Fig. 3 Time course of change in DCDHF fluorescence of HeLa cell trapped at different laser powers in presence of manitol (open symbols) and without manitol (closed symbols). | ||
Mechanistic studies on ROS generation
In order to identify the laser irradiation induced reactive oxygen species, cells were exposed to laser in the presence of manitol or sodium azide. The presence of manitol led to significant reduction of DCDHF fluorescence at lower exposure times (Fig. 3). However, at longer exposure times the quenching of ROS by manitol was less effective (Fig. 3). This may be attributed to the fact that at higher exposure times, the concentration of manitol inside the cell would get reduced by its utilization for quenching of the generated ROS. As would be expected, this effect was more pronounced for cells exposed to higher laser power (200 µJ, 10 Hz) as compared to those exposed to lower powers (120 µJ, 10 Hz).In cells exposed to cw laser at low exposures, because the DCDHF fluorescence (marker of ROS generation) was already at its base level, manitol had no significant effect. However, at longer exposures, DCDHF fluorescence intensity reduced significantly in the presence of manitol. Sodium azide had little effect on ROS generation (data not shown). These results suggest the generation of hydroxyl radicals on near infrared laser micro-irradiation.
Laser induced mitochondrial damage
Since mitochondria are believed to be an important site of ROS generation,15 alterations in mitochondrial functions following exposure to 1064 nm laser radiation were studied. Mitochondrial damage was assessed by monitoring the changes in mitochondrial potential in cells labeled with rhodamine 123, a mitochondrial specific fluorescent probe. In Fig. 4, we show fluorescence images of rhodamine 123 labeled HeLa cells exposed to pulsed laser at average power of 1.6 mW for different durations. In these experiments the laser beam was focused on the cytoplasm of cells. Cells not exposed to laser showed bright fluorescence in the cytoplasm. The fluorescence intensity of laser exposed cell gradually decreased with time and disappeared after 15 min. At higher power levels, faster disappearance of fluorescence was observed. The exposure of rhodamine solution (1 µg ml−1) to the pulsed 1064 laser (160 µJ, 10 Hz) did not lead to any detectable change in the fluorescence (data not shown). In Fig. 5 we show the measured decrease in fluorescence intensity of rhodamine 123 labeled cells as a function of exposure time at different cw and pulsed laser power levels. To account for the photobleaching of rhodamine fluorescence, the ratio of fluorescence intensity of trapped cell to the cells not exposed to trap (control) has been plotted. The decrease in fluorescence intensity following laser exposure indicates a decrease in mitochondrial membrane potential. The decrease in fluorescence intensity was not significant in CHO cells even after 20 min of exposure at similar laser power levels.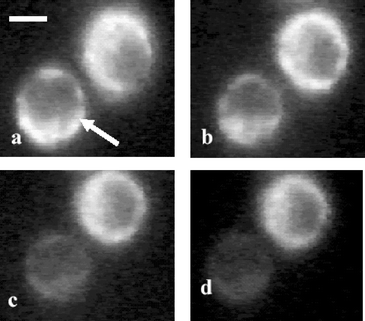 | ||
| Fig. 4 Digitized time-lapse fluorescence images of rhodamine 123 stained HeLa cell exposed to pulsed trapping beam. The trapped cell is marked by an arrow. Fluorescence images of cell without laser exposure (a), after exposure of 3 min (b), 9 min (c) and 12 min (d). All images are recorded at the same magnification. Scale bar: 10 µm. | ||
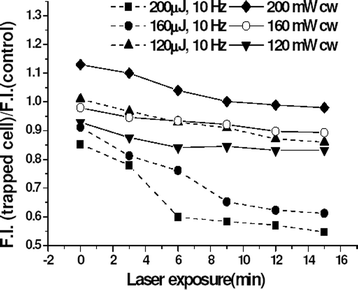 | ||
| Fig. 5 Decrease in rhodamine 123 fluorescence of HeLa cell as a function of trap duration. The ratio of fluorescence from the trapped cell with respect to the control cell is plotted for different trap duration. | ||
We also investigated the effect of manitol and sodium azide on alterations in mitochondria of cells exposed to 1064 nm laser after staining with rhodamine 123. Further, in order to verify the site of generation of ROS, the 1064 nm laser beam (160 µJ, 10 Hz) was focused in the cytoplasm of the stained cell or on its nucleus. The measured changes in rhodamine fluorescence with time in presence of manitol and sodium azide under these two irradiation conditions are shown in Fig. 6 and 7 respectively. In the presence of manitol no significant change in rhodamine 123 fluorescence was observed irrespective of whether cytoplasm (first row of Fig. 6) or nucleus (second row of Fig. 6) was irradiated. However, in the presence of sodium azide the rhodamine fluorescence was observed to decrease when cytoplasm was irradiated (first row of Fig. 7) and no significant decrease was observed when the nucleus was irradiated (second row of Fig. 7).
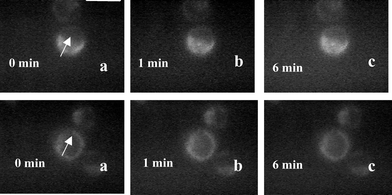 | ||
| Fig. 6 Digitized time-lapse fluorescence images of rhodamine 123 stained HeLa cell exposed to pulsed trapping beam in the presence of manitol. The trapped cell is marked by an arrow. First row: fluorescence images of cells when the laser was focused on the cytoplasm: without laser exposure (a), after exposure of 1 min (b), 6 min (c). Second row: laser focused over the nucleus: without laser (a), after exposure of 1 min (b) and 6 min (c). All images are recorded at the same magnification. Scale bar: 20 µm. | ||
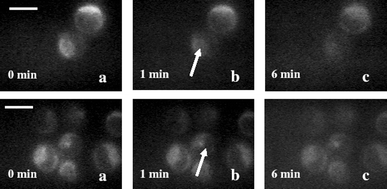 | ||
| Fig. 7 Digitized time-lapse fluorescence images of rhodamine 123 stained HeLa cell exposed to pulsed trapping beam in the presence of sodium azide. The trapped cell is marked by an arrow. (A) Fluorescence images of cells when the laser was focused on the cytoplasm: without laser exposure (a), after exposure of 1 min (b) and 6 min (c). Second row: laser focused over the nucleus: without laser (a), after exposure of 1 min (b) and 6 min (c). All images are recorded at the same magnification. Scale bar: 20 µm. | ||
Effect of ambient temperature on ROS generation
In Fig. 8, we show the effect of rise in temperature of the surrounding medium on ROS generation in HeLa and CHO cells. With increase in temperature, bright fluorescence of DCDHF labeled cells was observed in both CHO and HeLa cells. However, this effect was more pronounced in HeLa cells as can be seen from the higher DCDHF fluorescence (Fig. 8b) at a temperature of 45 °C as compared to that of CHO cells at the same temperature (Fig. 8d).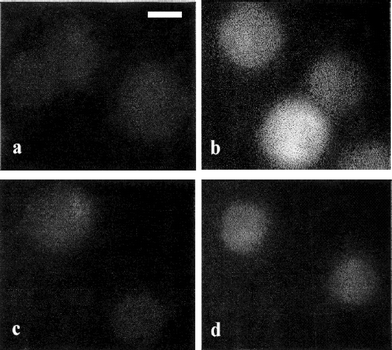 | ||
| Fig. 8 Digitized fluorescence images of HeLa and CHO cells kept at different ambient temperatures. DCDHF fluorescence in HeLa cells at room temperature (a) and at a temperature of 45 °C (b); CHO cells at room temperature (c) and at a temperature of 45 °C (d). All images are recorded at the same magnification. Scale bar: 10 µm. | ||
Discussion
The results presented in Fig. 2 and 3 show fluence and dose dependent generation of ROS in cells exposed to pulsed/cw 1064 nm laser beam. It is known that photochemical reactions involving endogenous or exogenously added photosensitizer can induce oxidative stress. However, cells do not have significant single photon absorbers at 1064 nm, and in contrast to near infrared region (700–800 nm) where several endogenous chromophores like flavins, NADH, and proteins have significant two-photon absorption, molecular targets for two-photon absorption at 1064 nm are less abundant in cells. Only cytochromes, with absorption band around 520–620 nm, can account for two-photon absorption at this wavelength. This fact and the observation that we did not find any correlation between the rate of ROS generation in CHO and HeLa cells and the lower absorption of HeLa cells measured by us at 532 nm (unpublished data) would suggest that generation of ROS at this wavelength is not mediated by photochemical reactions involving endogenous chromophores. It is pertinent to note that the weak single photon absorption by heme proteins in the near infrared region may also contribute to the generation of ROS. A wavelength dependent study on ROS generation in near infrared region should prove very useful to understand the relative role of the different chromophores that may have single or two-photon absorption in this range.It appears more likely that the oxidative stress observed at 1064 nm occurs through localized heating of water. The absorption coefficient of water at 1064 nm is significantly higher (∼0.15 cm−1) than that at 700–850 nm (0.0067–0.042 cm−1). An approximate transient temperature rise of 100 °C was estimated in CHO cells due to the pulsed trapping using 1064 nm Nd: YAG laser (40 µJ pulse−1, pulse width 100 ns).10 The transient rise in temperature will be even higher under the experimental condition used in this study (160 µJ pulse−1, pulse width 16 ns). For the ∼10 µm diameter cell, the transient increase in temperature is expected to get dissipated within a time scale of ∼250 µs. However, this time scale is sufficient for ROS generation. At longer exposures and/or higher power levels, higher ROS generation may lead to membrane damage. This is evident from the leakage of DCDHF observed at longer exposure of cells to pulsed laser trap/microbeam. The time, at which DCDHF leakage was observed, was also observed to increase with lowering of the average power of the trap beam.
In cells trapped with cw Nd: YAG laser, the level of ROS generation was observed to be lower even at high doses (200 mW for 10 min) as compared to pulsed laser (1.2 mW for 10 min). This is consistent with the fact that the temperature rise due to a cw laser beam is expected to be much smaller than that due to a pulsed laser beam. The temperature rise in CHO cells was estimated16 to be 1.15 °C/100 mW of 1064 nm, cw laser power. This small temperature rise may not be enough to cause detectable ROS generation in cells exposed for shorter duration and longer exposure of cells to cw trapping beam were required for detectable ROS levels (Fig. 3). These results are in agreement with recent observation of Leitz et al.11 They studied the expression of heat shock responsive reporter gene in Caenorhabditis elegans on exposure to different trapping wavelengths (700–850 nm). In animals exposed to 810 nm laser, the stress responsive gene expression could not be observed up to power of 360 mW, even for the largest exposure time investigated.11 This observation was interpreted to imply that the mechanism of stress generation at this wavelength is primarily of photothermal origin and up to these powers; the required temperature for activation of the promoter was not reached even by increasing the exposure time. In contrast, stress response in animals exposed to 760 nm laser at power levels varying from 240 to 480 mW was observed to increase with laser power and irradiation time, indicative of a photochemical mechanism for induction of stress.11
Our mechanistic study showed involvement of hydroxyl radical in laser induced photothermal stress. However, the observation of reduced quenching effect of manitol at longer exposure and dye leakage at higher doses suggests that lipid peroxides and other free radicals may also be involved. It is pertinent to note that sodium azide is a mitochondrial inhibitor and incubation of cells with sodium azide would lead to generation of ROS which is dependent on concentration and incubation time of sodium azide.17 Duranteau et al.17 have observed 50% increase in ROS generation in cells incubated with sodium azide (1 mM) only after 90 min of incubation. However, we did not observe significant change in ROS generation when cells were irradiated in the presence of sodium azide. This may be due to the shorter incubation period used in the present study.
Results presented in Fig. 6 and 7 show that compared to sodium azide, manitol was able to better protect changes in the mitochondrial membrane potential. This suggests that ROS generation occurs preferentially in mitochondria. Similar results have also been reported for visible laser irradiation of astrocytes.18 It is important to note that mitochondrial dysfunction resulting from a decrease in mitochondrial membrane potential as shown in Fig. 4 and 5 is expected to lead to leakage of electrons from the respiratory chain and result in more ROS generation. This might explain the observation that for exposure with beam of average power <1 mW (i.e. pulse energy <100 µJ, 10 Hz), although increase in DCDHF fluorescence was not observed even up to 5 min of irradiation, fluorescence was observed in these cells after a period of 5–10 min of switching off the laser. This suggests that the low levels of ROS generated at short exposure to lower beam powers, got enhanced with time to become detectable later. Although there is no direct evidence of laser induced thermal stress generating ROS, several studies have shown exposure of tissues and cells to laser induces local heating of targets and would result in alterations in metabolism, enzyme inactivation, conformational changes in molecular structure.19 Hyperthermia is known to promote free radical formation and mitochondria are believed to be the main source of ROS in cells. Enhanced formation of oxygen derived free radicals like superoxide has been reported in mitochondria subjected to heat stress.15 The increase in antioxidant enzymes like glutathione peroxidase, SOD20 and oxidized form of xanthine dehydrogenase,21 an important source of oxygen derived free radical, during thermal stress further supports heat induced ROS generation. Laser induced heating may depend on absorption coefficients and antioxidant enzymes status in different types of cells and may be the cause of the observed difference in level of ROS generation in the two cell types studied here.
It should be noted that ROS generated during laser exposure could promote the opening of the mitochondrial permeability transition pores, induce apoptosis in cells. These events may lead to a decrease in viability of optically trapped cells such as DNA damage as well as decrease in cloning efficiency as reported in several studies. Another important point worth emphasizing is that the present study was carried out on trypsinised cells. Although proper controls were used to establish the generation of ROS by the 1064 nm trap beam the possibility that trypsinization makes the cells more susceptible to ROS formation during irradiation can not be ruled out. It would therefore be desirable to repeat these experiments on naturally non-adherent cells.
Conclusion
Our results indicate that pulsed or cw 1064 nm laser trapping beam can lead to oxidative stress and mitochondrial membrane damage in trapped cells. For exposure times of less than 5 min, as used in most applications, very little generation of ROS and damage to mitochondria was observed with cw laser beam of power up to 200 mW. However, with pulsed laser beam even with much lower average power considerably larger generation of ROS as well as damage to mitochondria has been observed. The results suggest that photothermal effects are primarily responsible for oxidative stress observed at 1064 nm.Acknowledgements
The authors would like to thank Shri T.P.S. Nathan, Head, Solid State Laser Division and members of his division for providing the Nd: YAG laser systems and their help in smooth-running of the laser systems. The authors are also thankful to Dr Uday K. Tirlapur, F.S.U., Jena, Germany for providing the dyes used in the experiments.References
- K. O. Greulich, Micromanipulation by light in biology and medicine, in The laser microbeam and optical tweezers, Birkhauser, Basel, Boston, Berlin, 1999 Search PubMed.
- H. Liang, W. H. Wright, S. Cheng, W. He and M. W. Berns, Micromanipulation of chromosomes in PTK2 cells using laser microsurgery (optical scalpel) in combination with laser-induced optical force (optical tweezers), Exp. Cell Res., 1993, 204, 110–120 CrossRef CAS.
- S. K. Mohanty, M. Sharma and P. K. Gupta, Laser-assisted microinjection into targeted animal cells, Biotechnol. Lett., 2003, 25, 895–899 CrossRef CAS.
- U. K. Tirlapur and K. Konig, Targeted transfection by femtosecond laser, Nature, 2002, 418, 290–291 CrossRef CAS.
- T. Karu, Primary and secondary mechanisms of action of visible to near-IR radiation on cells, J. Photochem. Photobiol., B, 1999, 49, 1–17 CrossRef CAS.
- H. Liang, K. T. Vu, P. Krishnan, T. C. Trang, D. Shin, S. Kimel and M. W. Berns, Wavelength dependence of cell cloning efficiency after optical trapping, Biophys. J., 1996, 70, 1529–1533 CrossRef CAS.
- S. K. Mohanty, A. Rapp, S. Monajembashi, P. K. Gupta and K. O. Greulich, COMET assay measurement of DNA damage in cells by laser micro-beams and trapping beams with wavelength spanning a range of 308 nm to 1064 nm, Radiat. Res., 2002, 157, 378–385 CAS.
- K. Konig, Y. Liu, G. J. Sonek, M. W. Berns and B. J. Tromberg, Autofluorescence spectroscopy of optically trapped cells during light stress, Photochem. Photobiol., 1995, 62, 830–835 CAS.
- U. K. Tirlapur, K. Konig, C. Peuckert, R. Krieg and K. Halbhuber, Femtosecond near-infrared laser pulses elicit generation of reactive oxygen species in mammalian cells leading to apoptosis-like death, Exp. Cell Res., 2001, 263, 88–97 CrossRef CAS.
- Y. Liu, G. J. Sonek, M. W. Berns and B. J. Tromberg, Physiological monitoring of optically trapped cells: assessing the effects of confinement by 1064 nm laser tweezers using microfluorometry, Biophys. J., 1996, 71, 2158–2167 CrossRef CAS.
- G. Leitz, E. Fallman, S. Tuck and O. Axner, Stress Response in Caenorhabditis elegans Caused by Optical Tweezers: Wavelength, Power, and Time Dependence, Biophys. J., 2002, 82, 2224–2231 CrossRef CAS.
- V. Lanord, B. Brugg, P. Michel, Y. Agid and M. Ruberg, Mitochondrial free radical signal in ceramide dependent apoptosis: a putative mechanism for neuronal death in parkinson's disease, J. Neurochem., 1997, 69, 1612–1621.
- L. V. Johnson, M. L. Walsh and L. B. Chen, Localization of mitochondria in living cells with rhodamine 123, Proc. Natl. Acad. Sci. USA, 1980, 77, 990–994 CAS.
- H. Misawa, M. Koshioka, K. Sasaki, N. Kitamura and H. Masuhara, Three-dimensional optical trapping and laser ablation of a single polymer latex particle in water, J. Appl. Phys., 1991, 70, 3829–3835 CrossRef CAS.
- D. Salo, C. Donovan and K. Davies, HSP70 and other possible heat shock or oxidative stress proteins are induced in skeletal muscle, heart, and liver during exercise, Free Radical Biol. Med., 1991, 11, 239–246 CrossRef CAS.
- Y. Liu, D. K. Cheng, G. J. Sonek, M. W. Berns, C. F. Chapman and B. J. Tromberg, Evidence for localized cell heating induced by infrared optical tweezers, Biophys. J., 1995, 68, 2137–2144 CrossRef CAS.
- J. Duranteau, J., N. S. Chandel, A. Kulisz, Z. Shao and P. T. Schumeker, Intracellular signaling by reactive oxygen species during hypoxia in Cardiomyocytes, J. Biol. Chem., 1998, 279, 11619–11624 CrossRef.
- T. Peng and M. Jou, Mitochondrial swelling and generation of reactive oxygen species induced by photoirradiation are heterogeneously distributed, Ann. N. Y. Acad. Sci., 2004, 1011, 112–122 CrossRef CAS.
- J. Roegener, CP Lin, Photomechanical effects experimental studies of pigment granule absorption, cavitation and cell damage, Proc. SPIE-Int. Soc. Opt. Eng., 2000, 3902, 35–41.
- E. Abdalla, M. Cata, K. Guice, D. Hinshaw and K. Oldham, Arterial levels of oxidized glutathione (GSSG) reflect oxidative stress in vivo, J. Surg. Res., 1990, 48, 291–296 CrossRef CAS.
- J. L. Skibba, A. Stadnicka, J. H. Kablfleisch and R. H. Powers, Effects of hyperthermia on xanthine oxidase activity and glutathione levels in the perfused rat liver, J. Biochem. Toxicol., 1989, 4, 119–125 CrossRef CAS.
| This journal is © The Royal Society of Chemistry and Owner Societies 2006 |
