Microfabricated valveless devices for thermal bioreactions based on diffusion-limited evaporation†‡
Fang Wang§a, Ming Yang§a and Mark A. Burns*ab
aDepartment of Chemical Engineering, University of Michigan, Ann Arbor, MI 48109
bDepartment of Biomedical Engineering, University of Michigan, Ann Arbor, MI 48109. E-mail: maburns@umich.edu; Fax: +1 (734) 763 0459; Tel: +1 (734) 764 4315
First published on 31st October 2007
Abstract
Microfluidic devices that reduce evaporative loss during thermal bioreactions such as PCR without microvalves have been developed by relying on the principle of diffusion-limited evaporation. Both theoretical and experimental results demonstrate that the sample evaporative loss can be reduced by more than 20 times using long narrow diffusion channels on both sides of the reaction region. In order to further suppress the evaporation, the driving force for liquid evaporation is reduced by two additional techniques: decreasing the interfacial temperature using thermal isolation and reducing the vapor concentration gradient by replenishing water vapor in the diffusion channels. Both thermal isolation and vapor replenishment techniques can limit the sample evaporative loss to approximately 1% of the reaction content.
Introduction
Many reactions used for biochemical analysis are temperature-controlled and require relative high operating temperatures. One of the most well known thermal reactions is the polymerase chain reaction (PCR), an enzyme-catalyzed DNA amplification cycles through three different temperatures (denaturation (∼94 °C), annealing (∼55 °C) and extension (∼72 °C)). Sanger cycle sequencing is another thermocycling reaction (∼95 °C, ∼55 °C, ∼60 °C) that utilizes the termination function of dideoxynucleotide triphosphates (ddNTPs) on DNA chain elongation.1 Ligase chain reaction (LCR) and ligase detection reaction (LDR), techniques are used to detect single base mutations, both require elevated temperatures.2 Restriction of DNA strands into shorter fragments for DNA analysis is an isothermal reaction but still requires temperatures up to ∼75 °C. Traditionally, these biochemical assays have been carried out in bench-top equipment (e.g., thermocyclers) and, although there are many potential applications, the techniques have not been widely disseminated, particularly for point-of-care applications.In recent years, microfabrication technologies have paved the way for the development of rapid and inexpensive bioreaction systems. A miniaturized bioreaction system presents several advantages over the bench-top equivalent: reduced reagent, labor and equipment costs, decreased reaction time, reduced risk of contamination, and simplified sample handling. There are two major types of miniaturized bioreaction systems: batch-based systems where the stationary reaction solution is heated or thermocycled inside a reaction chamber by either external heaters3–16 or integrated on-chip heaters,17–24 and continuous flow-based systems where the sample flows through certain temperature zones with well-defined flow rates.25–30 Other novel approaches, such as on-chip rotary reactions,31 noncontact infrared-mediated reactions,32–34 electrokinetically synchronized reactions,35 electrowetting-based reactions36 and Rayleigh-Bénard convection-based reactions37,38 have also been reported. Recent trends in miniaturized bioreaction systems are to integrate bioreactions with sample preparation, fluidic handling, and product detection to produce systems that can rapidly, conveniently, and economically extract information from raw biological samples with greatly reduced cost.4,7,11,12,17–20,23,39
One technical challenge in miniaturizing bioreaction systems is preventing or reducing evaporative loss during thermocycling. Although mineral oils,4–16,10,26 adhesive tapes19,22 and silicone rubber gaskets21 have all been used in miniaturized bioreaction devices, most integrated systems reported so far have used microvalves to prevent evaporative loss. These microvalves seal the reaction chamber using pneumatically or mechanically actuated diaphragms,7–9,11,15,17,18,40–43 thermally actuated phase-change pistons,12,19,39,44 or polyacrylamide gels.19 Because all microvalves need to provide some kind of physical confinement and most require some kind of actuations to operate, they often add complexity to the microfabrication and fluidic operations. In addition, simple microfluidic assays are often open or unsealed systems to allow the introduction and/or the withdrawal of fluids. Therefore, a simple technique to reduce the evaporative loss without valves is highly desirable for microfluidic reaction systems.
We have fabricated microfluidic devices that use diffusion-limited evaporation mechanisms to suppress liquid loss during thermal reactions. Eliminating the use of microvalves, oil or gaskets, the basic design uses long narrow diffusion channels in the fluidic network to slow down the diffusion of water vapor through the channel openings. The vapor evaporation rate can be further reduced by decreasing the driving force for liquid evaporation. This reduction is achieved either by decreasing the sample interfacial pressure using thermal isolation or by decreasing the vapor concentration gradient using vapor replenishment.
Theory and design principles
The principle of valveless reaction devices is based on the concept of diffusion-limited evaporation. In the design, the input and output channels to the heated reaction chamber provide a resistance that decreases the evaporation rate from the reaction fluid (see Fig. 1(a)). Vapor that evaporates from the reaction solution meniscus must diffuse through the microchannels before it can escape through sample loading holes into the ambient environment. The evaporation rate is limited by this vapor diffusion rate since the phase change at the liquid surface (i.e., liquid to vapor) is quite rapid and there is no convective flow of air in the channel.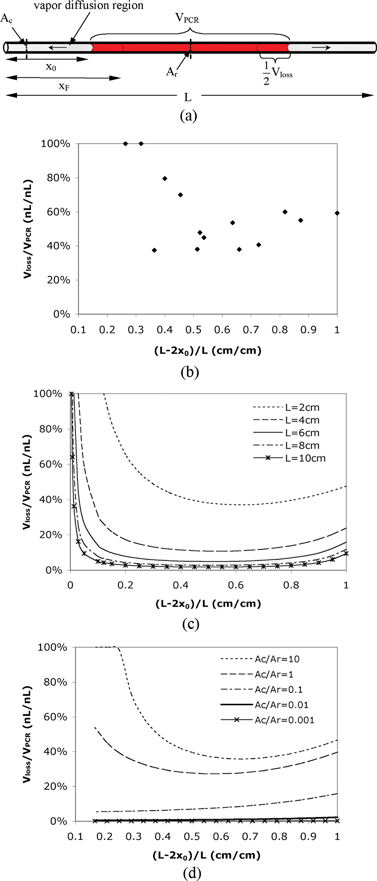 | ||
| Fig. 1 (a) Schematic of the simple reactor. x0 is the initial diffusion length; xF is the final diffusion length; Ac is the cross-section area of the diffusion path; Ar is the cross-section area of the reaction region; L is the total length of the channel. (b) Experimental relative evaporative loss Vloss/VPCR in a 2 cm straight uniform channel with varying fractional filled length (L – 2x0)/L. (c) Calculated relative evaporative loss Vloss/VPCR in a straight uniform channel with different channel lengths. (d) Calculated relative evaporative loss Vloss/VPCR in a channel–chamber–channel design with different cross-sectional area ratios Ac/Ar. The total length of the channels and chamber is 2.4 cm and the reaction chamber is 0.4 cm long. | ||
The diffusion-limited evaporation rate can be evaluated using mass transfer equations. At any given time, there is a vapor-pressure gradient along the diffusion path, from the equilibrium interfacial vapor pressure at the liquid meniscus to the ambient vapor pressure at the outlets. As evaporation proceeds, the sample interface recedes in the channel, resulting in an increased diffusion length over time. According to Fick's law, the total diffusion flux of vapor NA in the channel (in the x direction) is determined by
 | (1) |
 and pA is the partial vapor pressure); Dv is vapor diffusivity in air; T is liquid interfacial temperature; and R is the ideal gas constant. Integrating eqn (1), we obtain the total diffusion flux of vapor at any given moment,
 | (2) |
 | (3) |
 | (4) |
For a thermocycling reaction, eqn (4) must be modified to include periodically changed sample interfacial temperatures, Ti, and reaction time, tF. The vapor pressure, pv, and vapor diffusivity, Dv, also need to be changed periodically because they are temperature dependent.45,46 For example, three sets of Ti, pv, tF and Dv are needed for PCR that consists of three-step thermocycling. The total evaporative volume loss during a three-step thermocycling reaction, Vloss, is then calculated using eqn (5),
 | (5) |
Materials and methods
Device design and fabrication
The long-armed device with thermal isolation contains a 4 mm long, 2 mm wide and 100 µm deep reaction chamber with a rough volume of 800 nL, and two 1 cm long, 200 µm wide and 20 µm deep channels connected to the reaction chamber. The reaction chamber is surrounded by a 1 µm thick and 1 mm wide silicon nitride diaphragm. The device with vapor replenishment consists of a serpentine reaction channel (with a designed volume of 500 nL) with two 5 mm long and 100 µm wide straight channels on either end. All channels in this device are 50 µm deep except that there are two 150 µm deep liquid stop structures near the T-junctions in the water channels.The devices are assembled by bonding silicon and glass substrate components. The fluid networks are fabricated in a glass wafer using two photolithography and two-step wet chemical etching due to the non-uniform depth. The detailed procedures for photolithography and wet etching have been outlined elsewhere.32 In the fabrication process of the thermally isolated long-armed device, the first lithography is carried out to only pattern the deeper features (i.e., the reaction chamber), followed by etching away the exposed metal film. The remaining photoresist is then stripped away. The second lithography is carried out to pattern the whole fluid network. The glass wafer is then etched to generate the reaction chamber with a depth of 80 µm in hydrofluoric acid (49%, CMOS grade; J. T. Baker, Philipsburg, NJ). After removing the metal film that protects the channels, the second glass etching is conducted to an additional depth of 20 µm. Then the remaining photoresist and metal film are removed. The fabrication of fluid network in the vapor-replenished device follows a similar procedure, except that the etching depth in each etching step is different according to the design. Sample access holes are drilled by a homemade electrochemical discharge drilling system. Finally, the glass wafer is coated with 5 µm parylene in a parylene coating system (PDS-2010 LABCOTER®2, SCS Cookson Electronics, Indianapolis, IN), and diced to yield the individual devices.
Silicon fabrication process of the vapor-replenished device is the same as described in previous work.38 Silicon fabrication of the thermally isolated long-armed device begins with depositing a 1 µm thick low stress silicon nitride on a silicon wafer (〈100〉, 500 µm thick) by low pressure chemical vapor deposition (LPCVD). The lithography and liftoff for the heaters and sensors have also been described in previous work.38 To thermally isolate the reaction chamber another lithography is carried out on the backside of the silicon wafer. The exposed silicon nitride layer is then removed by the CF4/CHF3 plasma RIE process. Next, a deep reactive ion etching (DRIE) process is carried out to selectively remove the silicon substrate and thus obtain a 1 µm thick silicon nitride diaphragm.
The procedure to assemble the glass-silicon device has also been described in detail elsewhere.38 Briefly, individual silicon devices are fixed on the custom designed printed circuit board (PCB, Advanced Circuits, Aurora, CO), and then wire bonded (Kulicke & Soffa 4124 Ball Bonder) using 1.0 mil gold wire. Next, the assembly is coated with 5 µm parylene. The silicon and glass components are visually aligned and then bonded using UV curable optical glue. Finally, the wirebonds are encapsulated with a non-fluorescent epoxy (EP939; Thermoset, Indianapolis, IN).
Instrumentation
The setup for reaction temperature control consists of a DC power supply (B+K Precision Model 1760, Yorba Linda, CA), two data acquisition (DAQ) boards (National instruments PCI 6031E and PCI-6704, Austin, TX), two connector blocks (National instruments SCB-100 and SCB-68, Austin, TX), a signal conditioning circuit, a computer and two LabVIEW programs (National instruments, Austin, TX). The temperature sensors are calibrated by heating the device in a convection oven and recording the temperature-resistance data in a LabVIEW program. The slope and intercept from a linear fit of the temperature and resistance data is read into the control algorithms that use a proportional-integral (PI) module to control temperature. The heaters are connected to the power supply through the signal conditioning circuit that boosts the supply voltage from the computer with an op-amp gain of 3. During the experiments, the device is placed on a copper block that sits on a probe station chuck at room temperature. Lab air supply, controlled by a pressure regulator (Matheson Gas Products Inc, Irving, TX, Model Number 3701), provides the pneumatic pressure used for fluidic operations.PCR amplification and analysis
PCR amplification of the influenza viral strain A/LA/1/87 DNA samples is performed on the devices. The hemaggultinin gene (HA1) region of influenza viral RNA is reverse transcribed, amplified, ligated into the pGEM-T vector, and cloned into E. coli. The cloned plasmid is used to synthesize RNA in vitro with T7 RNA polymerase. The RNA samples are then subject to reverse transcription to produce the DNA samples that are used in the device. The reaction mixture consists of 2 ng µL–1 DNA template, 0.2 mM each dNTP, 60 mM Tris-HCl, 15 mM NH4SO4, 1.5 mM MgCl2, 0.3 mM of each primer and Taq DNA polymerase at 50 units mL–1 (Invitrogen, Carlsbad, CA). The sequences of the forward and reverse primers are 5′-GTTTGTTTCTCTGGTACATTCCGC-3′ and 5′-CAACTGTTACCCTTATGATGTGCC-3′, respectively. A DNA fragment of 690 bp is amplified. The thermocycling protocol used by the on-chip PCR consists of 30 cycles of 94 °C for 5 s, 55 °C for 10 s, 72 °C for 20 s, and 72 °C for 30 s after 30 cycles. The reaction solution is then collected and analyzed with a 1% agarose gel electrophoresis prestained with ethidium bromide.Results and discussions
Based on the principle of diffusion-limited evaporation, three approaches are proposed to reduce the sample evaporative loss in a microfluidic device during thermal reactions. First, long channels with small cross sections at both ends of a reaction chamber increase the diffusion path of the evaporated vapor, greatly reducing the vapor diffusion rate. Second, a thin silicon nitride diaphragm surrounding a reaction chamber thermally isolates the high-temperature reaction region from the rest of the device, significantly lowering the temperature and vapor pressure at the liquid interface as well as the driving force for evaporation. Third, a pure water meniscus, pinned at the edge of a deep pit that connects to the diffusion channel, is heated synchronously with the reaction chamber to increase the vapor concentration in the diffusion channel and therefore decrease the concentration gradient (i.e., the driving force for evaporation). Each of these techniques is described in the following sections.Diffusion channel geometry and initial diffusion length
For thermal reactions in microfluidic systems such as PCR, evaporative loss can be significant compared to the reaction volume if valves or seals are not used. Fig. 1(b) shows the evaporative loss (Vloss) during thermocycling as a function of the amount of liquid that is initially present in the reactor. For these experiments we used a simple reactor design consisting of a straight channel with uniform cross-sectional area (Fig. 1(a)). The evaporative loss is measured by heating the entire channel using the PCR protocol mentioned previously. As shown in Fig. 1(b), the evaporative loss (Vloss) in a straight uniform channel during thermocycling (30 cycles of 94 °C for 5 s, 55 °C for 10 s, 72 °C for 20 s) is approximately 40% ∼100% of the original reaction volume (VPCR).Using eqn (5), we also calculated the relative sample evaporative loss (Vloss/VPCR) in a uniform channel with different channel lengths (L) and initial diffusion lengths (x0) when the channel is thermocycled. The temperatures used in the cycling, and the vapor pressure and diffusivity at different temperatures are listed in Table 1. The results in Fig. 1(c) show that with the same fractional filled length ((L – 2x0)/L), the evaporative loss is reduced dramatically by increasing the channel length (i.e., the length of the diffusion regions). For a certain percentage of sample evaporative loss, the optimal initial diffusion length and the minimal channel length can be determined using Fig. 1(c). For example, to keep the evaporative loss to no more than 10%, the channel should be at least 4 cm long with a fractional filled length of 0.5 (i.e., x0 = 1 cm on both ends). The plot also indicates that in most cases, designing the channel so that the reaction solution fills it half way ((L – 2x0)/L = 0.5) will result in less relative evaporative loss than if the channel is filled completely ((L – 2x0)/L = 1) or hardly at all ((L – 2x0)/L ≤ 0.1). In fact, although the absolute value of evaporative loss is very small when the channel is almost empty, Vloss/VPCR is still large due to the small initial reaction volume.
| PCR steps | Variables | Uniform straight channel | Long-armed device without thermal isolation | Long-armed device with thermal isolation |
|---|---|---|---|---|
| denaturation | Ti1/K | 367 | 360 | 313 |
| pv1/Pa | 81![[thin space (1/6-em)]](https://www.rsc.org/images/entities/char_2009.gif) 447 447 | 62![[thin space (1/6-em)]](https://www.rsc.org/images/entities/char_2009.gif) 660 660 | 7375 | |
| Dv1/m2 s–1 | 3.62 × 10⁻⁵ | 3.50 × 10⁻⁵ | 2.74 × 10⁻⁵ | |
| tF1/s | 5 | 5 | 5 | |
| annealing | Ti2/K | 328 | 325 | 303 |
| pv2/Pa | 15![[thin space (1/6-em)]](https://www.rsc.org/images/entities/char_2009.gif) 737 737 | 14![[thin space (1/6-em)]](https://www.rsc.org/images/entities/char_2009.gif) 000 000 | 4240 | |
| Dv2/m2 s–1 | 2.97 × 10⁻⁵ | 2.92 × 10⁻⁵ | 2.59 × 10⁻⁵ | |
| tF2/s | 10 | 10 | 10 | |
| extension | Ti3/K | 345 | 340 | 308 |
| pv3/Pa | 33![[thin space (1/6-em)]](https://www.rsc.org/images/entities/char_2009.gif) 944 944 | 28![[thin space (1/6-em)]](https://www.rsc.org/images/entities/char_2009.gif) 000 000 | 5626 | |
| Dv3/m2 s–1 | 3.25 × 10⁻⁵ | 3.16 × 10⁻⁵ | 2.66 × 10⁻⁵ | |
| tF3/s | 20 | 20 | 20 |
In addition to the channel length and initial diffusion length, the cross-sectional area of the channel also affects the Vloss/VPCR ratio as predicted in Fig. 1(d). In this calculation using eqn (5), we divide the channel into three regions: a reaction region with the cross-sectional area Ar, and two diffusion regions on either end of the reaction region with the cross-sectional area Ac. The results show that the smaller the value of Ac/Ar is, the less the evaporative loss will be, implying that narrow diffusion channels with large reaction chambers are preferred. Note that actual evaporation rates may increase in narrow channels due to the increased extent of liquid film wetting on the channel wall.48
Driving force for liquid evaporation
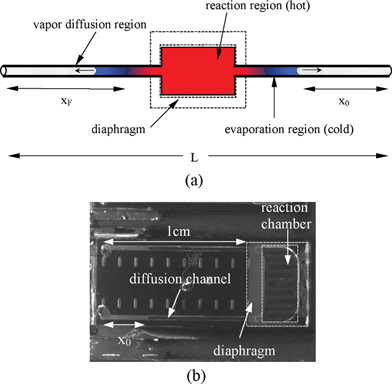 | ||
| Fig. 2 (a) Schematic of the long-armed device with thermal isolation. The color gradient conceptually represents the temperature gradient. The actual temperature gradient is shown in Figure 1(e)–(g) in ESI†. (b) Picture of the microfabricated device. | ||
The interfacial temperature, Ti, during a thermal bioreaction is predicted using steady-state heat transfer simulations. Both devices that we simulated contain a long-armed chamber (i.e., a large reaction chamber with two long narrow channels on both ends). In addition, the chamber in one device is thermally isolated with a thin diaphragm as depicted in Fig. 2(a) (also see Figure 1 in ESI†). As was demonstrated before,47 the temperature throughout the device without thermal isolation is significantly higher than with thermal isolation (see Figure 1 in ESI†). This temperature difference is mostly due to a more than three orders of magnitude difference in the thermal conductivities of silicon and air (150 W m–1 K–1vs. 0.026 W m–1 K–1).
To investigate the evaporative loss in a long-armed device with thermal isolation, the relative evaporative loss (Vloss/VPCR) is calculated theoretically and experimentally. The theoretical Vloss/VPCR ratios are calculated using eqn (5) and the simulated results of the interfacial temperature (listed in Table 1). The experimental Vloss/VPCR ratios are measured during the reaction in a long-armed device with and without thermal isolation. Both theoretical and experimental Vloss/VPCR ratios are plotted in Fig. 3(a). The plot indicates that the experimental data fit fairly well with the theoretical results, and that the thermally isolated device significantly reduces the evaporative loss compared to the device without thermal isolation. In most cases, with (L – 2x0)/L < 0.83 (i.e., x0 > 2 mm), the evaporative loss in the device without thermal isolation is more than 5 folds higher than that in the thermally isolated device.
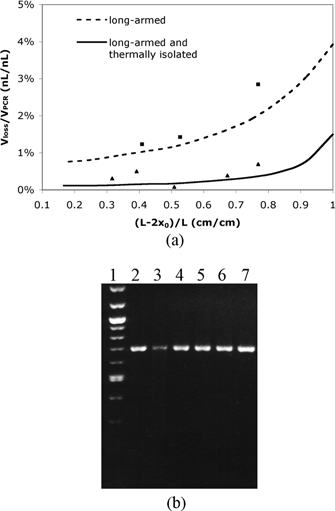 | ||
| Fig. 3 (a) Calculated and experimental relative evaporative loss Vloss/VPCR as a function of the fractional filled length (L – 2x0)/L. The cross-sectional areas of the reaction chamber Ar and the diffusion channel Ac used in the calculation and experiment are 0.2 mm2 and 0.004 mm2, respectively. ■ experimental data in a long-armed device without thermal isolation; ▲ experimental data in a long-armed device with thermal isolation. (b) Gel electrophoresis of PCR products in the long-armed device with thermal isolation. Lane 1, the 100 bp DNA ladder. Lane 2–lane 6, on-chip PCR products. The extra sample volumes in the channels are 7.2%, 6.1%, 4.1%, 2.7% and 1.8% of the reaction volume, respectively. The corresponding values of relative evaporative loss and fractional filled length refer to the experimental data points (from right to left) shown in (a). Lane 7, a positive PCR control carried out in a commercial thermocycler. Lane 3 exhibits lower fluorescent intensity due to sample volume loss during the sample collection process. | ||
The gel electrophoresis of the PCR products collected from the thermally isolated devices shows that most on-chip PCR exhibits similar amplification efficiency to the off-chip positive control (Fig. 3(b)). No byproduct bands have been detected from both on-chip and off-chip PCR and the yield (brightness analysis) of amplification increases with the reduction of the evaporative loss. This result is understandable since evaporative loss changes not only the reaction volume, but also the sample and reagent concentrations. However, amplification from different template DNAs requires different optimal concentration and thermocycling conditions. Thus, the effect of reducing the evaporative loss on the PCR yield may vary for other DNA samples.
A potential problem associated with this thermal isolation device is that part of the reaction solution (i.e., the sample in the long narrow channels) will not be amplified because it does not experience the desired thermocycling temperatures. However, the results in Fig. 3(b) indicate that the unreacted sample volume in the channels will not significantly affect the overall PCR fidelity and efficiency because the narrow channels have limited volume of extra solution (less than 10% of the total reaction volume).
To facilitate the reduction of evaporative loss while assuring the reaction efficiency, some key design factors need to be optimized. The width of the silicon nitride diaphragm is one factor that can significantly affect the interfacial temperature. As shown in Fig. 4(a), a wider diaphragm is expected to provide better thermal isolation and further reduce the evaporative loss. This improvement, however, becomes negligible when the diaphragm is wider than 1.5 mm. In addition, larger diaphragms may require longer fabrication time and are sometimes more difficult to handle, implying an optimal width between 1 mm and 1.5 mm. According to the previous discussions, complete removal of the silicon under the reaction chamber will provide better thermal isolation because it further reduces the heat conduction between the chamber and the rest part of the device.47 However, heat transfer simulations reveal that in such a design the temperature uniformity in the reaction chamber will be poor compared to the current design in which the chamber is supported by silicon (see Fig. 2 in ESI†).
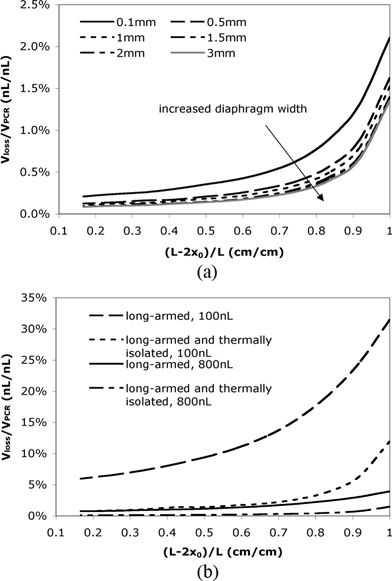 | ||
| Fig. 4 (a) The relative evaporative loss in a thermally isolated long-armed devices with different diaphragm widths. (b) The relative evaporative loss Vloss/VPCR for different reaction volumes in a long-armed device with and without thermal isolation. | ||
The reaction volume also plays an important role in designing long-armed devices with thermal isolation. The result in Fig. 4(b) indicates that the difference in evaporative loss of a long-armed device with and without thermal isolation is much more prominent for a smaller reaction volume (or smaller cross-sectional area of the reaction chamber). In the current design with a relatively large reaction volume (∼800 nL), even a device containing long diffusion channels without thermal isolation can reduce the evaporative loss to less than 4%. However, if the reaction chamber volume is reduced to 100 nL, the evaporative loss is 20% when (L – 2x0)/L = 0.83 (i.e., x0 = 2 mm) in the device without thermal isolation, while it is only 4% in a thermally isolated device. Therefore, it is more advantageous to use a thermally isolated device for small volume reactions.
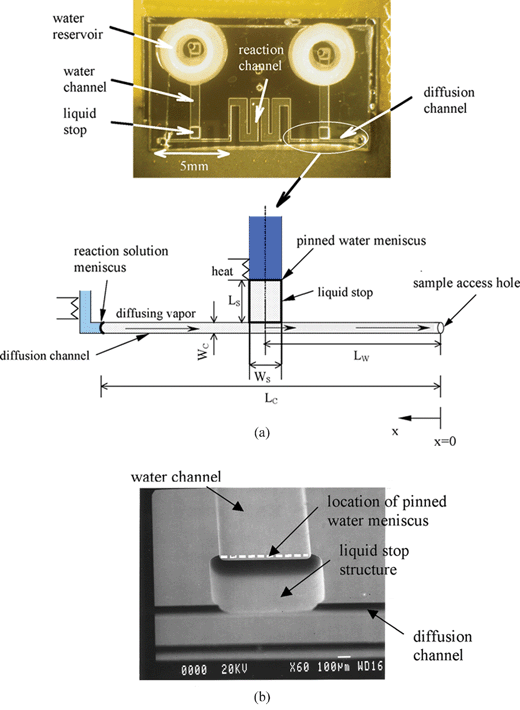 | ||
| Fig. 5 (a) Picture of the device with vapor replenishment. Lw is the distance from the sample access hole to the centerline of the liquid stop; Lc is the distance from the sample access hole to the reaction solution meniscus; Wc is the width of the diffusion channel; Ls and Ws are the length and width of the liquid stop, respectively. (b) A SEM image of the liquid stop structure. | ||
Steady-state mass transfer simulations confirm the reduction of the water vapor concentration gradient and flux in the diffusion channels using vapor replenishment. The results of concentration and flux values along the centerline of the diffusion channel when the reaction solution is at 94 °C are plotted in Fig. 6(a) and 6(b). Without vapor replenishment, the vapor concentration decreases from the reaction solution meniscus (x = 5 mm) to the sample access hole (x = 0 mm) (Fig. 6(a)), while the total vapor flux is constant along the channel (Fig. 6(b)). The results in Fig. 6(a) also indicate that adding vapor into the diffusion channel reduces the vapor concentration gradient between the liquid stop and the reaction solution meniscus and thus the driving force for liquid evaporation. Clearly the vapor replenishment increases the total vapor flux from the liquid stop to the sample access hole (0 < x < 2.5 mm), but decreases the flux from the reaction volume (2.5 mm < x < 5 mm) in comparison to a constant flux in a straight channel design (Fig. 6(b)).
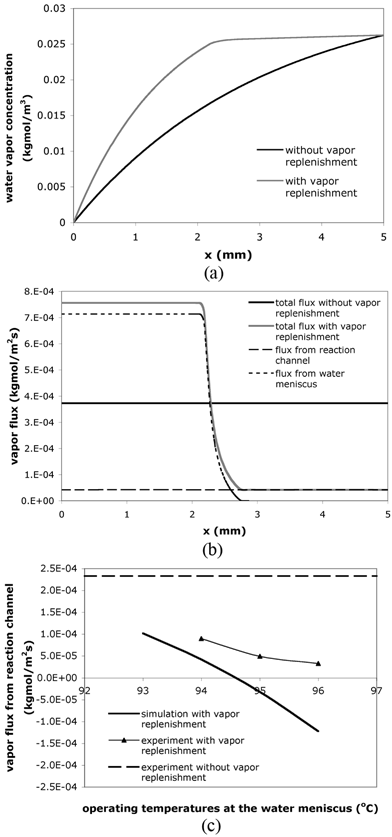 | ||
| Fig. 6 (a) Vapor concentration and (b) vapor flux along the centerline of the diffusion channel in the simulation results. Lc = 5 mm; Wc = 100 µm; Ls = 1 mm; Ws = 0.6 mm. Lc, Wc, Ls and Ws are defined in the captions of Fig. 5(a). (c) Vapor flux from the reaction channel with different operating temperatures at the pinned water meniscuses. Note that a positive flux represents an inbound flux (toward the sample access hole) while a negative flux represents an outbound flux (toward the reaction solution meniscus). | ||
Both simulation and experimental results demonstrate that the operating temperatures at the pinned water meniscus significantly affect the water vapor flux, as shown in Fig. 6(c). In fact, when the operating temperature is higher than 95 °C and the reaction temperature remains at 94 °C, theory predicts that water vapor will condense at the reaction solution meniscus. Experimental results show the same trend as the theory but the experimental fluxes are positive for all temperature points tested. This difference could be due to an assumption in the simulations—fixed reaction solution meniscus position—that does not match the real reaction conditions. Moreover, the reaction solution meniscus may be heated above 94 °C due to thermal crosstalk from the heated (i.e., above 95 °C) water meniscus, a situation that can be eliminated with proper device design. On-chip PCR with different water-meniscus operating temperatures produced similar amplification efficiency to off-chip positive controls (data not shown). In addition, similar to the results obtained in the thermally isolated device, no byproducts have been detected, and less evaporative loss also leads to higher amplification yield.
Design factors such as the geometry and location of the liquid stop play an important role in minimizing the vapor flux and the evaporative loss. As shown in Fig. 7(a), the total vapor flux from the reaction solution meniscus decreases with decreasing liquid stop length. A shorter liquid stop reduces the distance between the vapor source (the pinned water meniscus) and the T-junction in the diffusion channel, thus increasing the vapor concentration at the T-junction. This increase will decrease the vapor concentration gradient between the reaction solution meniscus and the T-junction, resulting in less vapor flux from the reaction solution. A wider liquid stop (i.e., a larger surface area of the pinned water meniscus) also facilitates the reduction of vapor flux from the reaction solution by increasing the vapor concentration at the T-junction (Fig. 7(b)). Moreover, the lowest total flux from the reaction solution is achieved when the liquid stop intersects the diffusion channel at the midpoint (Fig. 7(c)).
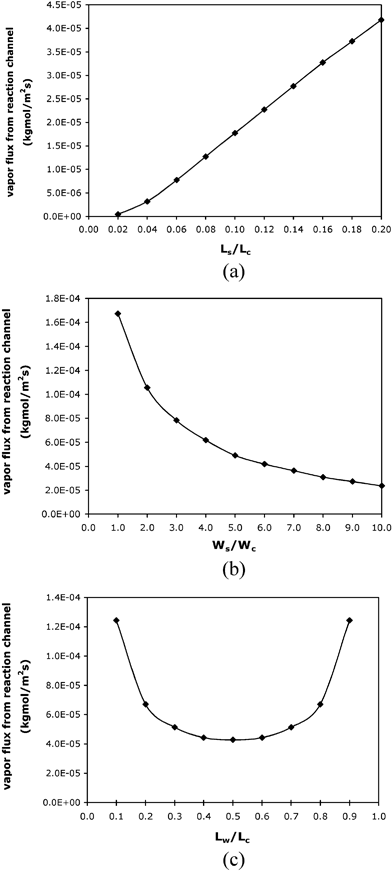 | ||
| Fig. 7 Simulation results of vapor fluxes from the reaction channel (a) when different lengths of the liquid stop is used; (b) when different widths of the liquid stop is used; (c) when the location of the liquid stop varies with Ls = 1 mm and Ws = 0.6 mm. All the simulations use 94 °C as the operating temperature at the water meniscus, Lc = 5 mm and Wc = 100 µm. Lc, Wc, Lw, Ls and Ws are defined in the caption of Fig. 5(a). | ||
Conclusion
We have developed valveless strategies to reduce the sample evaporative loss during microfluidic thermal reactions using the principle of diffusion-limited evaporation. The microchannels on both sides of the reaction region provide long narrow diffusion paths that reduce the evaporation rate. Decreasing the driving force for evaporation by either increasing the thermal isolation of the reaction chamber or by increasing the concentration of water vapor in the diffusion channel will also limit the evaporation. Both theoretical and experimental results demonstrate that the proposed strategies can effectively reduce the evaporation rate during thermocycling and successfully perform PCR without using microvalves. Although PCR has been taken as an example to demonstrate the capability of the devices, the novel miniaturized methodologies provided by these devices can also be applied in microfluidic devices for other chemical and biochemical reactions. Moreover, these methodologies can be readily integrated into more advanced devices such as integrated analysis systems.Acknowledgements
The authors would like to gratefully acknowledge the funding of this work through several grants from NHGRI (most recently P01-HG001984) and a grant from NIAID (R01-AI49541) at the National Institutes of Health. The authors would like to acknowledge Brian N. Johnson, Rohit Pal, Nimisha Srivastava, Dylan Heldsinger, Kenneth J. Chomistek, S. Zafar Razzacki, Kenneth Alfano, Zheng Chen, Prasanna Thwar, Kyung Eun Sung, Onnop Srivannavit, Zhishan Hua, Sang-Hyun Lee and Myung-Gyu Kang for their assistance with reagent preparation, device fabrication, computer programming, SEM imaging, lab maintenance, electronic interface development and general discussion.References
- F. Sanger, S. Nicklen and A. R. Coulson, Proc. Natl. Acad. Sci. U. S. A., 1977, 74, 5463 CAS.
- F. Barany, Proc. Natl. Acad. Sci. U. S. A., 1991, 88, 189 CAS.
- A. T. Woolley, D. Hadley, P. Landre, A. J. DeMello, R. A. Mathies and M. A. Northrup, Anal. Chem., 1996, 68, 4081 CrossRef CAS.
- L. C. Waters, S. C. Jacobson, N. Kroutchinina, J. Khandurina, R. S. Foote and J. M. Ramsey, Anal. Chem., 1998, 70, 158 CrossRef CAS.
- L. C. Waters, S. C. Jacobson, N. Kroutchinina, J. Khandurina, R. S. Foote and J. M. Ramsey, Anal. Chem., 1998, 70, 5172 CrossRef CAS.
- J. Khandurina, T. E. Mcknight, S. C. Jacobson, L. C. Waters, R. S. Foote and J. M. Ramsey, Anal. Chem., 2000, 72, 2995 CrossRef CAS.
- R. C. Anderson, X. Su, G. J. Bogdan and J. Fenton, Nucleic Acids Res., 2000, 28, e60 CrossRef CAS.
- E. T. Lagally, P. C. Simpson and R. A. Mathies, Sens. Actuators, B, 2000, 63, 138 CrossRef.
- E. T. Lagally, I. Medintz and R. A. Mathies, Anal. Chem., 2001, 73, 565F.
- J. W. Hong, T. Fujii, M. Seki, T. Yamamoto and I. Endo, Electrophoresis, 2001, 22, 328 CrossRef CAS.
- P. K. Yuen, L. J. Kricka, P. Fortina, N. J. Panaro, T. Sakazume and P. Wilding, Genome Res., 2001, 11, 405 CrossRef CAS.
- Y. Liu, C. B. Rauch, R. L. Stevens, R. Lenigk, J. Yang, D. B. Rhine and P. Grodzinski, Anal. Chem., 2002, 74, 3063 CrossRef CAS.
- Y. S. Shin, K. Cho, S. H. Lim, S. Chung, S. J. Park, C. Chung, D. C. Han and J. K. Chang, J. Micromech. Microeng., 2003, 13, 768 CrossRef CAS.
- L.-M. Fu and C.-H. Lin, Biomed. Microdevices, 2007, 9, 277 CrossRef CAS.
- R. G. Blazej, P. Kumaresan and R. A. Mathies, Proc. Natl. Acad. Sci. U. S. A., 2006, 103, 7240 CrossRef CAS.
- J. Cheng, M. A. Shoffner, K. R. Mitchelson, L. J. Kricka and P. Wilding, J. Chromatogr., A, 1996, 732, 151 CrossRef CAS.
- E. T. Lagally, C. A. Emrich and R. A. Mathies, Lab Chip, 2001, 1, 102 RSC.
- E. T. Lagally, J. R. Scherer, R. G. Blazej, N. M. Toriello, B. A. Diep, M. Ramchandani, G. F. Sensabaugh, L. W. Riley and R. A. Mathies, Anal. Chem., 2004, 76, 3162 CrossRef CAS.
- C. G. Koh, W. Tan, M. Q. Zhao, A. J. Ricco and Z. H. Fan, Anal. Chem., 2003, 75, 4591 CrossRef CAS.
- R. H. Liu, J. N. Yang, R. Lenigk, J. Bonanno and P. Grodzinski, Anal. Chem., 2004, 76, 1824 CrossRef CAS.
- D. S. Yoon, Y. S. Lee, Y. Lee, H. J. Cho, S. W. Sung, K. W. Oh, J. Cha and G. Lim, J. Micromech. Microeng., 2002, 12, 813 CrossRef CAS.
- Z. Zhao, Z. Cui, D. Cui and S. Xia, Sens. Actuators, A, 2003, 108, 162 CrossRef.
- I. Rodriguez, M. Lesaicherre, Y. Tie, Q. Zou, C. Yu, J. Singh, L. T. Meng, S. Uppili, S. F. Y. Li, P. Gopalakrishnakone and Z. E. Selvanayagam, Electrophoresis, 2003, 24, 172 CrossRef CAS.
- H. Wang, J. Chen, L. Zhu, H. Shadpour, M. L. Hupert and S. A. Soper, Anal. Chem., 2006, 78, 6223 CrossRef CAS.
- M. Hashimoto, M. L. Hupert, M. C. Murphy and S. A. Soper, Anal. Chem., 2005, 77, 3243 CrossRef CAS.
- D. S. Lee, S. H. Park, H. Yang, K. H. Chung, T. H. Yoon, S. J. Kim, K. Kim and Y. T. Kim, Lab Chip, 2004, 4, 401 RSC.
- M. U. Kopp, A. J. De Mello and A. Manz, Science, 1998, 280, 1046 CrossRef CAS.
- P. J. Obeid, T. K. Christopoulos, H. J. Crabtree and C. J. Backhouse, Anal. Chem., 2003, 75, 288 CrossRef CAS.
- N. Park, S. Kim and J. H. Hahn, Anal. Chem., 2003, 75, 6029 CrossRef CAS.
- M. Hashimoto, P. C. Chen, M. W. Mitchell, D. E. Nikitopoulos, S. A. Soper and M. C. Murphy, Lab Chip, 2004, 4, 638 RSC.
- J. Liu, M. Enzelberger and S. Quake, Electrophoresis, 2002, 23, 1531 CrossRef CAS.
- R. P. Oda, M. A. Strausbauch, A. F. R. Huhmer, N. Borson, S. R. Jurrens, J. Craighead, P. J. Wettstein, B. Eckloff, B. Kline and J. P. Landers, Anal. Chem., 1998, 70, 4361 CrossRef CAS.
- A. F. R. Huhmer and J. P. Landers, Anal. Chem., 2000, 72, 5507 CrossRef CAS.
- B. C. Giordano, J. Ferrance, S. Swedberg, A. F. R. Huhmer and J. P. Landers, Anal. Biochem., 2001, 291, 124 CrossRef CAS.
- J. Chen, M. Wabuyele, H. Chen, D. Patterson, M. Hupert, H. Shadpour, D. Nikitopoulos and S. A. Soper, Anal. Chem., 2005, 77, 658 CrossRef CAS.
- M. G. Pollack, P. Y. Paik, A. D. Shenderov, V. K. Pamula, F. S. Dietrich and R. B. Fair, µTAS, 2003, 619 Search PubMed.
- M. Krishnan, V. M. Ugaz and M. A. Burns, Science, 2002, 298, 793 CrossRef.
- E. K. Wheeler, W. Benett, P. Stratton, J. Richards, A. Chen, A. Christian, K. D. Ness, J. Ortega, L. G. Li, T. H. Weisgraber, K. Goodson and F. Milanovich, Anal. Chem., 2004, 76, 4011 CrossRef CAS.
- R. Pal, M. Yang, R. Lin, B. N. Johnson, N. Srivastava, S. Z. Razzacki, K. J. Chomistek, D. Heldsinger, R. M. Haque, V. M. Ugaz, P. Thwar, Z. Chen, K. Alfano, M. Yim, M. Krishnan, A. O. Fuller, R. G. Larson, D. T. Burke and M. A. Burns, Lab Chip, 2005, 5, 1024 RSC.
- P. K. Yuen, L. J. Kricka and P. Wilding, J. Micromech. Microeng., 2000, 10, 401 CrossRef.
- W. H. Grover, A. M. Skelley, C. N. Liu, E. T. Lagally and R. A. Mathies, Sens. Actuators, B, 2003, 89, 315 CrossRef.
- T. Thorsen, S. J. Maerkl and S. R. Quake, Science, 2002, 298, 580 CrossRef CAS.
- J. Liu, C. Hansen and S. R. Quake, Anal. Chem., 2003, 75, 4718 CrossRef CAS.
- R. Pal, M. Yang, B. N. Johnson, D. T. Burke and M. A. Burns, Anal. Chem., 2004, 76, 3740 CrossRef CAS.
- R. H. Perry and D. W. Green, Perry's Chemical Engineers' Handbook, 1997, 7th edn, pp 2–49 Search PubMed.
- C. J. Geankoplis, Transport Processes and Unit Operations, 1993, 3rd edn, p. 396 Search PubMed.
- M. Yang, R. Pal and M. A. Burns, J. Micromech. Microeng., 2005, 15, 221 CrossRef CAS.
- S. Jin and K. S. Breuer, IMECE, 2003, 44135 Search PubMed.
- P. F. Man, C. H. Mastrangelo, M. A. Burns and D. T. Burke, MEMS '98, Heidelberg, Germany, 1998, pp 45–50 Search PubMed.
Footnotes |
| † Electronic supplementary information (ESI) available: Supplementary figures. See DOI: 10.1039/b711770a |
| ‡ The HTML version of this article has been enhanced with colour images. |
| § These authors contributed equally to this work. |
| This journal is © The Royal Society of Chemistry 2008 |
