Microfluidic flow-encoded switching for parallel control of dynamic cellular microenvironments†
Kevin R.
King
ab,
Sihong
Wang
b,
Arul
Jayaraman
c,
Martin L.
Yarmush
ab and
Mehmet
Toner
ab
aHarvard-MIT, Division of Health Science and Technology, 51 Blosson St. Rm 408, Boston, MA 02114, USA. E-mail: mtoner@hms.harvard.edu; Fax: +1 (617) 371-4950; Tel: +1 (617) 371-4882
bSurgical Services and Center for Engineering in Medicine, Massachusetts General Hospital, Harvard Medical School, and Shriners Hospital for Children, Boston, MA 02114, USA
cDepartment of Chemical Engineering, Texas A&M University, College Station, TX 77843-3122, USA
First published on 29th November 2007
Abstract
The temporal pattern of a biological stimulus is an important determinant of the resulting cellular response. We present a microfluidic parallel perfusion culture system for controlling the dynamics of soluble cell microenvironments while simultaneously performing live-cell imaging of cellular responses. A “Flow-encoded Switching” (FES) design strategy is developed to simultaneously deliver many different temporal profiles of stimuli, including pulse train widths, lengths, and frequencies, to downstream adherent cells using a single input control. The design strategy uses principles of laminar flow and diffusion-limited mixing to encode the state of the network (the instantaneous stimulus concentrations in each channel) into the ratio of two flow rates, which is controlled by a single differential pressure. To demonstrate the utility of this experimental system, we investigated the effect of dynamic stimuli on NFκB transcriptional activation and cell fate determination. Our results illustrate that transcriptional responses and cell fate decisions depend both quantitatively and qualitatively on the timing of the stimulus. In summary, by encoding dynamic stimuli in a single input pressure, microfluidic flow-encoded switching offers a scalable experimental method for systematically probing the functional significance of temporally patterned cellular environments.
Introduction
The soluble cellular microenvironment is highly dynamic. Stress-induced cytokine waves,1 post-prandial changes in metabolism,2 and diurnal variations in hormone levels3 are just some of the many time-varying stimuli found in vivo. The relationship between dynamic extracellular signals and the resulting intracellular dynamics is a reflection of the underlying signal transduction machinery. Understanding the normal operation of this machinery as well as the disregulations that cause disease is central to the problem of developing effective therapeutic interventions. Unfortunately, it is not straightforward to predict cellular responses to time-varying stimuli because of nonlinearities, feedback, and cross-talk inherent in cell signaling cascades.4,5 As a result, dynamic responses cannot be simply extrapolated from steady-state responses to constant stimulus levels. Instead, one must experimentally traverse a large parameter space of stimulus concentrations, temporal profiles, and molecular contexts.5 Mathematical models can be helpful in predicting stimulus-response dynamics of complex systems, however experimental validation of such models remains limited by the paucity of dynamic experimental data.6 Because of the challenging nature of dynamic experiments, investigations have been limited to signaling pathways for which there exists a high degree of suspicion that timing of inputs affects cellular responses. Encouragingly, results from these limited studies have provided preliminary evidence that biological processes ranging from kinase activation to gene expression can depend critically on the duration and frequency of extracellular stimuli and their intracellular mediators7–9 To broaden investigations to other dynamic stimuli, it will be necessary to simplify and parallelize these experiments.In vitro cell culture is often used as a model system to simulate the in vivo environment while offering the benefit of precise experimental control. Unfortunately, conventional cell culture techniques are not well-suited for delivering time-varying stimuli. Dynamic soluble stimuli can be approximated in vitro using carefully timed pipetting. However this approach is both labor-intensive and complicated by the need for multiple rinse steps to completely remove stimuli in mid-experiment. Perfusion culture systems have been used to overcome many of these obstacles by replenishing culture medium continuously; however most continuous-flow chambers accommodate only one experimental condition at a time, and as a result, they also limit throughput. To date, large scale studies of temporally varying stimuli remain prohibitively tedious and impractical. In order to efficiently study the biological significance of dynamic soluble microenvironments, scalable parallel perfusion culture systems are needed. Therefore, we sought to develop a scalable perfusion culture system with a flexible stimulus control strategy to enable efficient investigation of cells as they decode their dynamic environment.
Microfluidics, a technology that enables fabrication of micron-scale channel networks using photolithography and polymer replica molding, offers a powerful toolkit for constructing high-throughput perfusion cell culture systems. Precise geometries coupled with laminar flow and purely diffusive mixing have enabled development of diverse fluid control strategies ranging from subcellular stimulus localization10 to flexible concentration gradient generators.11,12 These and other microscale tools have been used to explore diverse cellular phenomena including bacterial growth dynamics,13 differentiation,14chemotaxis,15 and spatially heterogeneous cell signaling.16 Initial advances in cell-based microdevices concentrated on controlling spatial aspects of stimuli, however more recently, efforts are being directed at controlling temporal aspects of stimuli. Most dynamic cell stimulation studies have been performed in short experiments, one condition at a time, focusing primarily on non-adherent cells. For example, in a recent report, time-varying stimulation was achieved by moving a single cell through a steady-state heterogeneous concentration field.17 This creative approach, while ideal for studying individual non-adherent cells, cannot be readily applied to large numbers of adherent cells. Recently, a valve-controlled device was used to rapidly switch a single chemotactic gradient to study neutrophil chemotaxis.12 However, to date there is no method for simultaneously controlling parallel delivery of many different dynamic stimulus regimens in long-term adherent mammalian cell experiments.
In this work, we show how microfluidic network design can enable different temporal stimulus profiles Si(t) to be simultaneously controlled with a single input signal χ(t) for studying dynamic cell responses Rj(t) (Fig. 1). The design strategy, termed “Flow Encoded Switching” (FES), encodes the state of the network (the instantaneous concentrations of stimuli in each experimental channel) into a single flow control parameter (the inlet pressure difference or inlet flow ratio). By modulating the inlet flow ratio in time, the state of the network can be controlled dynamically, and cells throughout the network can be exposed to different stimulus regimens. To demonstrate the utility of this approach, we combined it with real-time imaging of a stable fluorescent NFκB reporter cell line and quantified dynamic stimulus-response relationships in living cells. In a second study, we used the FES networks to investigate cell fate following various combination treatment regimens of heat shock and cytokine stress. Together, these studies demonstrate flow-encoded switching as a versatile method for controlling delivery of temporally patterned stimuli in order to systematically probe cellular decoding of the dynamic soluble microenvironment.
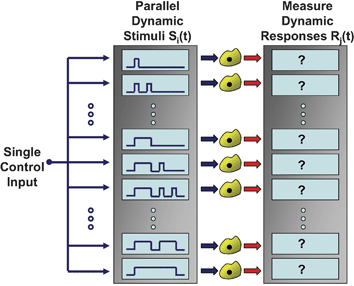 | ||
| Fig. 1 Parallel dynamic cell stimulation. Microfluidic flow-encoded switching networks enable delivery of many different temporal stimulus patterns to downstream cells using a single input control variable. The ability to simultaneously deliver dynamic stimuli and measure dynamic cellular responses in an integrated experimental platform enables high-throughput investigations of living cells as they decode their local microenvironment. | ||
Results and discussion
Flow-encoded switching device design and operation
Microfluidic flow-encoded switching networks (Fig. 2A), are designed to enable delivery of different dynamic soluble stimulus regimens Si(t) to each channel of the cell array using a single input control pressure, where S is the stimulus concentration, i is the channel number, and t is time. Each network consists of two inlets and one outlet connected by a series of alternating parallel channels termed ‘experimental channels’ and ‘gap channels’, with fluidic resistances Rei and Rgi, as shown in Fig. 2A and B and the ESI.† Because each channel behaves as a purely resistive fluidic circuit element, the network can be modeled using the electrical equivalent circuits as detailed in the ESI. Experimental channels function as cell-visualization channels, whereas the interleaved gap channels are designed to enhance the stability of stimulus control by isolating fluid with ambiguous concentrations as shown in Fig. 2B. Soluble stimuli are delivered through one inlet (left) at a flow rate of Qstimulus while basal culture medium is delivered through the other inlet (right) at a flow rate of Qmedium. Due to the laminar nature of low Reynold's number microfluidic flow, there is minimal mixing between the two solutions prior to entering the parallel channel network. Nevertheless, some diffusive mixing will inevitably occur at the interface between the two flows, so we designed gap channels between each experimental channel to carry the partially-mixed interface as shown in Fig. 2B. Using this design, the normalized stimulus concentration θi = (Si – Smin)/(Smax – Smin) in experimental channeli is either maximal (θi = 1) or minimal (θi = 0) depending on the flow ratio, χ = Qstimulus/(Qstimulus + Qmedium). At low values of χ, only the left-most channels are exposed to stimulus. However, as χ increases, additional cell-containing channels are exposed to stimulus from left to right. Eventually, as χ approaches unity, all channels become exposed. In practice, χ can be experimentally controlled in two ways; (1) explicitly using two syringe pumps, or (2) indirectly, by controlling the inlet pressure difference, ΔP = Pstimulus – Pmedium, with fluid drawn from the outlet at a constant flow rate Q0 as detailed in the ESI.†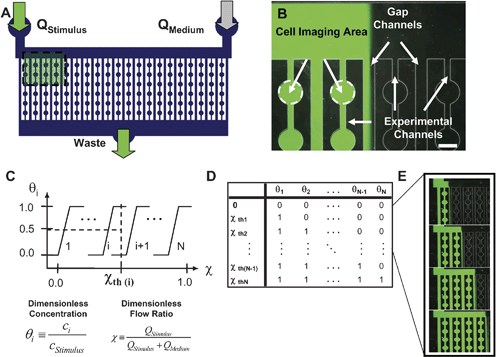 | ||
| Fig. 2 Microfluidic flow-encoded switching. (A) Layout of an example flow-encoded switching device with two input channels and one output. Inlets and outlets are connected by parallel channels that allow seeding and visualization of cells. (B) Microscopic image of an FES device in operation. Fluorescein dye is used to visualize the stimulus. The relative flow rates of stimulus-containing medium and basal culture medium determine the location of the interface. Experimental channels are used for cell visualization and gap channels serve to isolate the ambiguous concentration at the stimulus interface. Thus, experimental channels are exposed to fully concentrated stimulus or no stimulus. Scale bar (lower right) is 300 µm. (C) Relationship between the input flow ratio and the normalized concentration in each channel. We define a series of flow ratio thresholds as the values at which the dye interface is centered in a gap channel. (D) Mapping of the network state (the normalized concentration in each channel) to each flow ratio threshold. (E) Fluorescence microscopy of the device operated at the first four thresholds. | ||
Each of the N experimental channels is characterized by a unique ‘transfer function’ relating the normalized stimulus concentration θi to the inlet flow ratio χ or pressure difference ΔP as shown in Fig. 2C. By designing the relative resistances of experimental and gap channels, one can predictably control the shape of the transfer function. For example, as the experimental channel resistances increase with respect to gap channel resistances, the transfer function becomes increasingly switch-like. Each channel can then be characterized by a transition threshold (χth or ΔPth) as illustrated in Fig. 2E. Taken together, the stimulus concentrations in each experimental channel define a global ‘network state’ (θi, i = 1…N, where N is the number of channels), and one can experimentally transition between network states simply by changing ΔP or χ. We call this design strategy “Flow-encoded switching” (FES) because the state of the network is encoded into the flow rate ratio. The mapping of network states to input control parameters is illustrated in Fig. 2D and a device is shown operated in several states in Fig. 2E. It should be noted that there are topological restrictions on the range of states that can be achieved using the current FES design. For example, stimulation of channelj requires that all channels i of lower index (i < j) be stimulated at the same time.
Temporal stimulus control
Dynamic stimulation can be achieved by varying the inlet pressure difference ΔP or flow ratio χ in time as illustrated in Fig. 3A–C. Figs. 3D–H illustrate several input signals or ‘excitation sequences’ χ(t) that generate dynamic stimuli θi(t) commonly used in cell biology experiments. For example, it is often useful to study the cellular response to a transient stimulus of controlled duration, as in a “wash-out” or “pulse-chase” experiment. Fig. 3B illustrates how the FES network can be used to simultaneously screen a range of stimulus durations. First the flow ratio is rapidly increased until all channel thresholds are exceeded and all experimental channels are synchronously exposed to stimulus (θi = 1). Optionally, the last channel can be left unexposed as a negative control. At regular intervals, the flow ratio is progressively decreased in a step-wise fashion, to the next lowest threshold, removing the stimulus exposure from another channel (θi = 0), and effectively delivering a different duration of stimulus to any cells contained. Another commonly used stimulus pattern involves conditioning cells with a ‘pretreatment’ and studying their response to a subsequent ‘primary stimulus’. In many cases, the cellular response to paired stimuli depends on the time interval separating the two stimuli.18Fig. 3C illustrates an FES excitation sequence that allows systematic variation of the interval between pretreatment and primary-stimuli. First, all channels are synchronously exposed and then unexposed to create the pretreatment stimulus. Next, the control pressure is progressively increased at regular intervals, exposing a new experimental channel each time and generating stimulus pairs with variable recovery periods.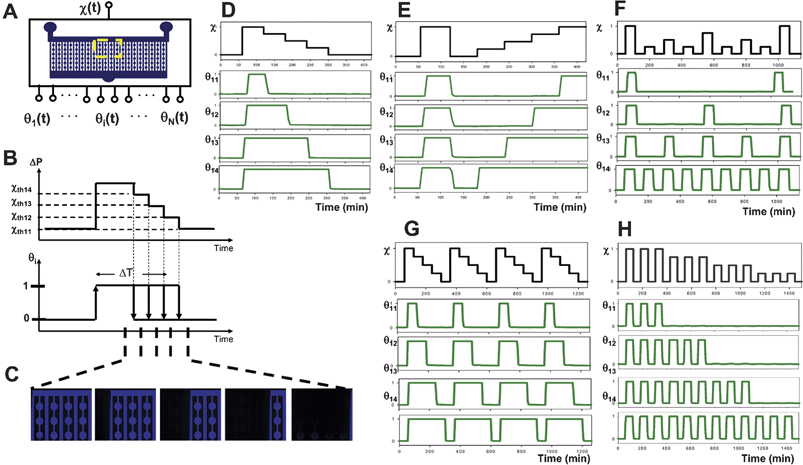 | ||
| Fig. 3 Parallel control of dynamic stimulation. (A) Dynamic control of the single input flow ratio generates different temporal concentration profiles in each experimental channel output. (B) Schematic of duration control sequence. The flow ratio is increased past several thresholds and then progressively decreased one threshold at a time. This delivers a different duration of exposure to each channel. (C) Fluorescent microscopy visualization of the network at various stages of a duration experiment (here, stimulus enters from right). (D)–(H) Experimental measurement of fluorescence in four adjacent experimental channels at the region indicated in (A). Excitation sequences and the resulting experimentally measured stimulus profiles are shown for (D) duration control, (E) recovery interval control, (F) pulse frequency control, (G) pulse trains of different pulse width and (H) length. | ||
One of the most intriguing and yet poorly understood temporal patterns in living systems is the periodic stimulus. Rapid neuronal spike trains,19intracellular calcium waves,20 and pulsatile hormone release21 are some of the many oscillatory signalings experienced by cells. Nevertheless, despite the prevalence of periodic stimuli, the encoding and decoding of information in these dynamic soluble signals remain poorly understood. Fig. 3D illustrates how microfluidic flow-encoded switching networks can be used to deliver many different stimulus frequencies to cell-containing experimental channels for studying periodic biological signals. One can use similar excitation schemes to vary pulse train length or pulse width as shown in Figs. 3G–H. As the excitations increase in complexity and the number of channels scales, they enable delivery of stimulus regimens that would be impractical to control by manual stimulus removal and discrete washing steps. For example, to deliver the conservative stimulus regimen shown in Fig. 3F using a 10-channel FES network would require pipetting frequencies > 1 Hz (assuming 3 wash steps requiring 9 pipetting steps per well—4 channels × 6 replicate wells per channel × 9 pipetting steps per well divided by 120 second switching period = 1.8 Hz). Together, these demonstrations illustrate the versatility of the flow-encoded switching approach, that excitation of a single network of parallel experimental channels with a single input can generate a wide range of useful modes of operation.
The FES networks used in these studies were designed for stimulus stability and controllability over long experiments. However, they were not optimized for rapid switching. In the future, switching speeds can be increased by reducing total channel volume and using higher flow rates. The operating conditions used in these studies were chosen conservatively to limit cell surface shear stress (<0.1 dyne cm–2) and resulted in characteristic switching times of 10–60 s. However, switching speed and cell surface shear stress can be decoupled to improve future designs by recessing cells in wells to lower cell surface shear stress at any given flow rate. Therefore, switching thresholds and other device parameters can be flexibly designed and controlled to achieve a range of sensitivities specifically tailored to the requirements of the experiment.
Multi-stage flow-encoded switching networks
Single stage FES networks are limited to screening stimulus attributes one at a time (e.g. duration or frequency, etc.). However, because the FES design is modular, it can be cascaded with other modular microfluidic networks to allow simultaneous screening of multiple stimulus attributes (e.g. duration and concentration, or pulse frequency and pulse train length). Figs. 4 and 5 show examples of two-layer multi-stage flow-encoded switching networks. The first network, shown in Fig. 4, enables combined screening of stimulus concentration (magnitude) and timing. In this case, the experimental channels of the first FES stage are routed to the inlets of 4 concentration generating modules, a previously described microfluidic circuit that relies on lateral diffusion of adjacent laminar flow streams to generate 7 graded outlet concentrations for each input.15 An identical FES network in layer 2 is used to deliver the diluent at the same flow rate as the stimulus. Fig. 4A shows a block diagram of the cascaded networks. Fig. 4B illustrates the mapping of the input flow ratio to the 28 outlet concentrations (θA1-7, θB1-7, θC1-7, θD1-7). Fig. 4C and D shows macro- and microscopic images of the dye-filled channels operated in the various network states, illustrating how the FES network can control which dilution blocks are on and off. Detailed device design is shown in Fig. 4E. In contrast to single state FES devices, the gap channels have been reflected to exit opposite the experimental channels, leaving room for the second stage. In addition, a high resistance serpentine channel is placed in experimental and gap channels to ensure they are much more resistant than the large interconnecting channel. Fig. 4F illustrates fluorescence measurements from each channel of the network as it is operated in duration mode. Just as in single-stage FES networks, modulation of a single input flow ratio generates different dynamic stimuli, however in this case, it does so for a range of different concentrations.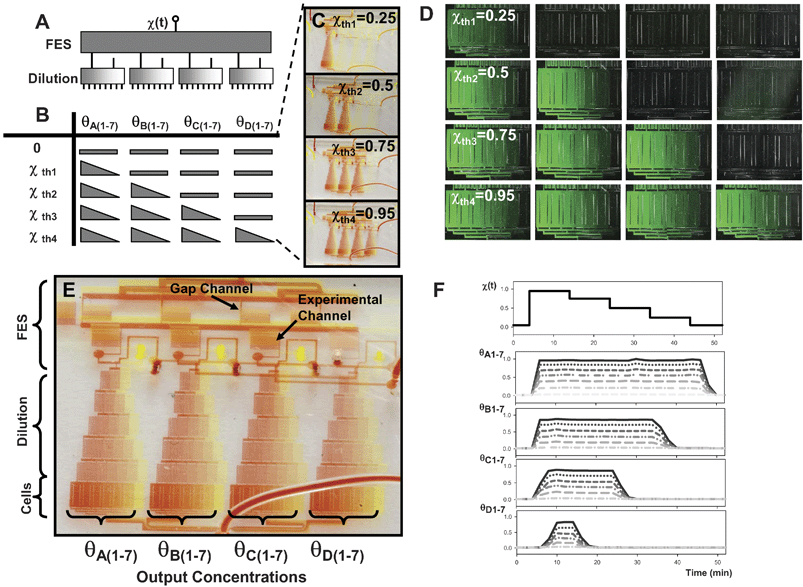 | ||
| Fig. 4 Multi-stage FES-dilution network for concentration and timing control. (A) A FES network and a dilution network are cascaded to achieve simultaneous control of stimulus concentration and timing. A block diagram illustrates that a single input control parameter can control 28 outputs (7 different concentrations at 4 temporal profiles). (B) Mapping of flow ratio thresholds to output concentrations (triangles indicate gradient in concentration). (C) Macroscopic image of dye-filled two-layer network operated in 4 different states. The state of the stage 1 FES network determines which of the stage 2 dilution blocks are on and off. (D) Fluorescence microscopy of the 28 experimental channels at the device outlet at 4 different flow ratios. (E) Detailed image of dye-filled two-layer device in the state where all dilution modules are filled with stimulus. (F) Parallel control of concentration and timing. Using the single excitation sequence shown at the top, 28 different combinations of stimulus duration and concentration are generated. | ||
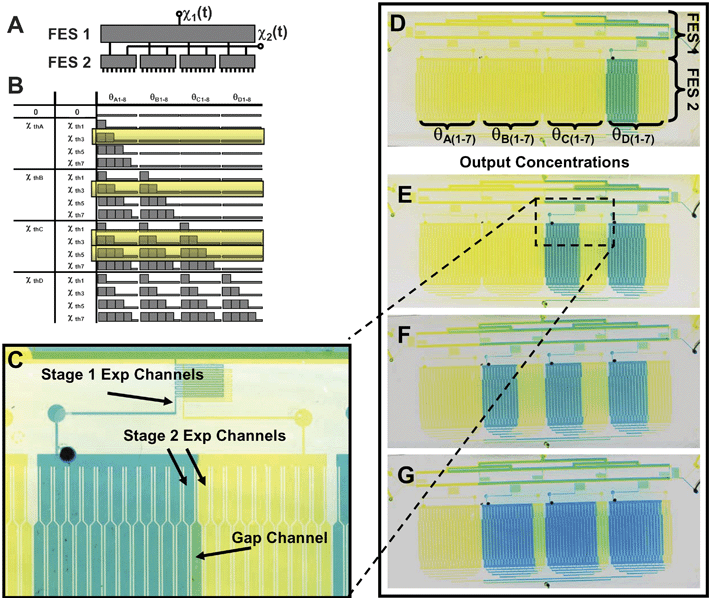 | ||
| Fig. 5 Multi-stage FES-FES network. (A) Two FES networks are cascaded such that two input flow ratios determine the state of 80 output channels (4 blocks of the optimized 20-channel FES design are detailed in the ESI†). (B) Schematic illustrating the diversity of states that can be controlled by only two input flow ratios. (C) Detailed view of the two-layer device showing the inlets to the stage 2 FES network with blue representing the stimulus. Note that the first stage establishes that the second FES block is on (indicated by blue dye traversing the serpentine channel and entering the stimulus inlet at the left in stage 2). (D)–(G) The FES–FES network at three different values of flow ratio 1 and F–G at two different values of flow ratio 2. Note that flow ratio 1 controls the number of stage 2 blocks that receive stimulus while flow ratio 2 controls the number of channels in the block that receive stimulus. (D) χ1 = 0.25, χ2 = 0.5, (E) χ1 = 0.5, χ2 = 0.5, (F) χ1 = 0.75, χ2 = 0.5 and (G) χ1 = 0.75, χ2 = 0.75. | ||
Fig. 5 shows a multistage network in which two FES designs are cascaded by routing experimental channels of the first FES stage to inputs of subsequent FES stages. In this case, the states of the two FES stages are controlled using separate input flow ratios. Therefore two flow ratios are needed to control the two-stage device as indicated in the block diagram in Fig. 5A. The mapping of inputs and outputs shown in Fig. 5B illustrates the wide range of states that cascaded FES networks can achieve. Figs. 5C–E show how χ1 can be used to turn on stage 2 FES units (stimulus is represented by blue dye). Fig. 5E–F shows how variations in χ2 alter the number of channels exposed to stimulus within each FES block turned on by χ1.
Living cell FES reporter assays
Using the FES strategy, cells in experimental channels can be reliably exposed to a variety of dynamic all-or-none pulse sequences controlled by a single input pressure difference. To demonstrate the utility of FES for stimulating living cells, we examined the effect of two temporally patterned stimuli: (1) NFκB activity in response to different durations of transient TNF-α cytokine stimulation and (2) TNF-α-induced apoptosis following various heat shock preconditioning regimens.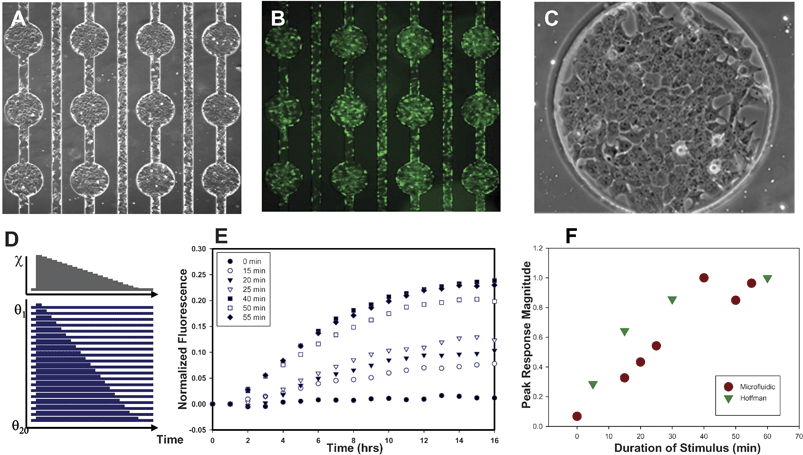 | ||
| Fig. 6 FES Network screening of GFP reporter responses to transient cytokine stimulation. (A) H35 NFkB reporter cells seeded in the fibronectin-coated FES network. Each circular cell visualization area is 420 µm diameter. (B) Cells loaded with calcein AM demonstrate high confluency and high viability. (C) Microscopic image detailing cell morphology in a circular cell visualization area. (D) Schematic of the excitation sequence used to deliver different durations to each experimental channel of cells. (E) Total fluorescence of the NFkB reporter cell visualization well as a function of time for various durations of 10 ng ml–1TNF-alpha cytokine stimulation. (F) Peak GFP fluorescence versus stimulus duration compared to predictions by Hoffmann et al.26 | ||
Reporter fluorescence responses followed a well-conserved time course as shown in Fig. 6E. The normalized fluorescence measured in each cell chamber increased from baseline at ∼2 h at a rate that depended on the stimulus duration, and peaked at ∼10 h for all stimulus conditions. Interestingly, this suggests that the duration of the stimulus determines the magnitude of the response but not its timing. Inspection of the relationship between stimulus duration and peak fluorescence level revealed two distinct response regimes for the TNF-α durations analyzed. Cytokine exposures of less than one hour resulted in peak magnitudes that increased with increasing stimulus duration (Fig. 6E). In contrast, the timing of peak fluorescence was independent of stimulus duration (Fig. 6F). However, when cells were exposed to TNF-α for longer than one hour, the rate of fluorescence increase and the peak timing were found to be independent of cytokine duration (Fig. 6F). These results are consistent with the predictions of Hoffmann and complement conventional DNA binding results with a more distal measure of NFκB transactivation, reporter protein expression. This experiment illustrates how FES networks can be used to efficiently study live cell responses to different stimulus regimens in a single microfluidic experiment by controlling a single input. Because the microfluidic FES system allows automated dynamic measurement of living cell responses to many different temporal regimens, one can rapidly traverse large stimulus parameter spaces and ultimately identify the most important time points and stimulus regimens for more detailed investigation using conventional techniques.
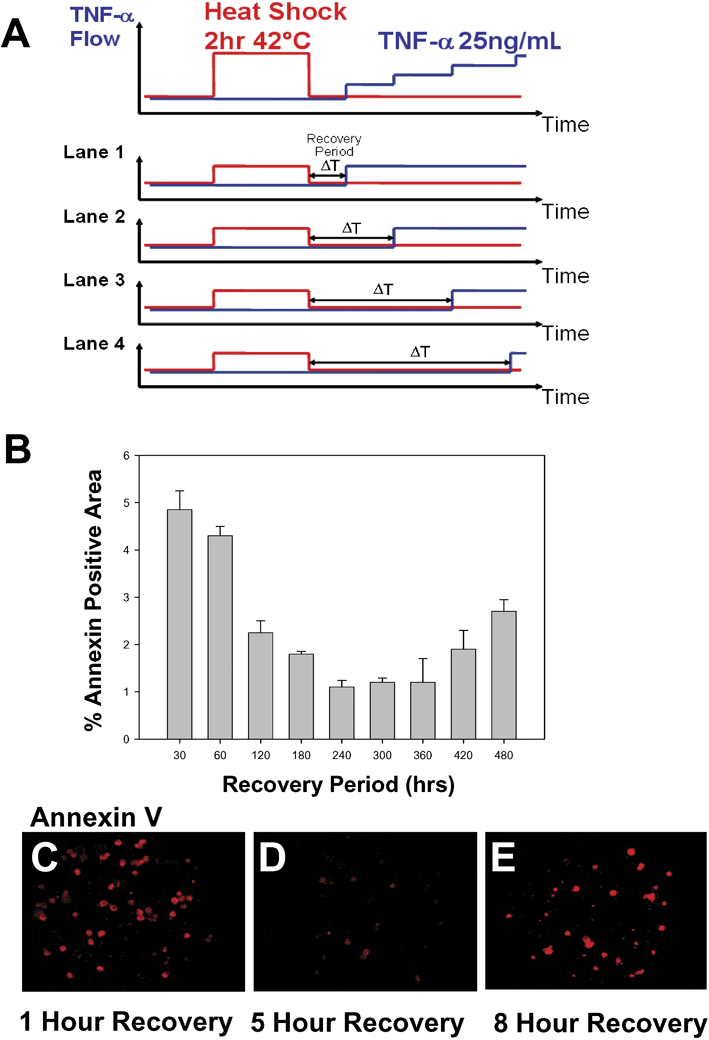 | ||
| Fig. 7 FES Network screening of heat shock–cytokine recovery interval. (A) Schematic of the excitation sequence used to control the interval between 2 h 42 °C heat shock (HS) stimulation and 25 ng ml–1TNF-alpha stimulation. (B) Fractional area of Annexin V positive staining. Error bars represent standard deviation of 5 cell visualization fields. (C)–(E) Fluorescence microscopy of Annexin V staining at various HS-TNF recovery intervals; (C) 1 h, (D) 5 h, and (E) 8 h of recovery. | ||
We found that short (1–3 h) and long (8–12 h) heat shock recovery regimens resulted in significant Annexin V positive staining area. However, when cells were allowed to recover for 4–7 h, they were comparatively ‘protected’, exhibiting up to 5-fold less Annexin V positive staining area. The complex cell fate response curve is not entirely unexpected. This optimal recovery interval is in close agreement with results obtained using conventional TUNEL assays and measured by flow cytometry (unpublished results). TNF is known to simultaneously activate pro-apoptotic pathways through death receptor signaling and pro-survival pathways through activation of NFκB.24 Meanwhile, heat shock is also well known to modulate the activity of NFκB as well as directly affect cell fate.23 These studies demonstrate the utility of FES networks in studying a nonlinear problem such as this, however additional studies will be necessary to provide a detailed mechanistic explanation for these results. Nevertheless, FES networks offer an attractive tool for screening complex parameter spaces and in the future, might provide useful strategies for dissecting the roles of heat shock and NFκB in cell fate decisions.
In the past, perfusion culture experiments were performed serially, which imposed significant limitations on the length and number of studies that could be performed. The parallel nature of microfluidic FES assays now allows many experimental conditions to be examined simultaneously. Microfluidic FES complements the existing cell biology ‘toolkit’ with a powerful experimental platform for obtaining stimulus-response time-series data from cells. It has the potential to enable systematic investigation of the significance of timing in a wide range of biological signaling systems including growth factors, cytokines, and immunogenic stimuli, and it is poised to aid in the development and validation of dynamic cell signaling models. In summary, this platform has the potential to greatly expand our understanding of the biological decoding schemes that allow cells to detect, interpret, and respond to their dynamic soluble microenvironments.
Materials and methods
Microfluidic device fabrication
Devices are fabricated using polymer replica molding from SU-8 masters as previously described. Briefly, electronic drawings are generated in AUTOCAD and printed at high resolution (minimum feature size <10 µm) on mylar films (Fine-line Imaging). Conventional photolithography is used to pattern 50 µm thick SU-8 photoresist on polished silicon wafers according to the manufacturer’s directions (MicroChem). PDMS is cast to a thickness of ∼1 cm, cured at 65 °C for 3 h, and permanently bonded to glass after oxygen plasma surface treatment. For multi-layer devices, both layers are cast ∼0.5 cm thick, removed from the silicon support, and holes are drilled for interconnection of layers and for inlets and outlets. After plasma treatment, the PDMS layers are placed in contact and heated at 90 °C for 20 min to ensure bonding. Once bonded, the multilayer PDMS stack is again plasma treated and bonded to a glass slide.Chemicals and proteins
All fluids were prepared as aqueous solutions. During device characterization, flow was visualized using a fluorescein salt solution (Sigma) and food coloring dye (McCormick). Culture medium consisted of DMEM 10% FBS, P/S, with 25 mM HEPES to chemically buffer medium during time-lapse experiments on an incubated microscope stage. The cytokine stimulus, rrTNF-α (R&D Systems) was stored in BSA solution and dissolved in culture medium at 25 µg ml–1 for cytokine stimulation of living cells. During live cell reporter experiments, flow was visualized by diluting yellow food coloring 1 : 100 in the stimulus-containing culture medium.Microfluidic cell culture
The stable clonal NFκB reporter cell line was described previously.25 Briefly, H35 hepatoma cells were stably transfected with a plasmid containing a green fluorescent reporter protein under the transcriptional control of 4 repeat NFκB promoters and a minimal promoter. A subpopulation of transfected cells exhibiting low baseline expression and strong TNF-induced fluorescence was selected by FACS and subcloned to obtain a clonal cell line. Cells were cultured in DMEM with 10% FBS and 10 µg ml–1Penicillin/Streptomysin. Medium was changed every two days and cells were trypsinized and passaged 1 : 20 every seven days.Prior to cell seeding, fluidic networks were autoclave sterilized, filled with 25 µg mL–1 fibronectin (Sigma), clamped and pressurized to drive air bubbles through the gas-permeable PDMS device walls, incubated at 37 °C for 2 h to allow fibronectin coating, and rinsed with culture medium. Reporter cells were trypsinized resuspended at 5 × 10⁶cells ml–1 for seeding. Cell suspensions were pulled into the channels using negative pressure, and inlets and outlets were clamped to prevent flow disturbances during cell sedimentation and spreading. After 2 h, devices were rinsed with fresh medium and syringes were changed and tubing was rinsed thoroughly. Microfluidic cultures were maintained for up to two weeks in an incubator using either continuous flow 0.1 µL min–1 or by discrete medium changes 2–3 times per day until needed for experiment.
FES–stimulation experiments
Devices were moved to an incubated microscope stage at 37 °C for time-lapse experiments. Stimulation was performed by drawing a constant negative flow rate from the device outlet using a syringe pump (Harvard Apparatus). Meanwhile, the two inlet reservoirs were held at different heights to control the pressure difference and thereby the location of the interface between the stimulus and culture medium. For flow control experiments, two syringe pumps were controlled manually. During cell experiments, yellow food coloring was added to the stimulus solution and was periodically visualized under brightfield microscopy to verify stimulus control.TNF-α transcriptional dynamics and apoptosis imaging and quantification
Microscale flows were visualized using a Ziess200 Axiovert microscope equipped with an AxioCAM CCD camera and an automated programmable stage. Images were analyzed in batch mode using custom MATLAB image analysis routines. Briefly, the routine corrects for fluorescence excitation fluctuations, subtracts background, integrates the total fluorescence (for GFP reporter assays) and averages the fluorescence intensity of pixels above the calculated background threshold. Time lapse data was normalized to initial fluorescence to correct for variations in cell number. This rests on the assumption that uninduced cells are the dominant source of fluorescence above background. Apoptosis progression was evaluated by performing an Annexin V assay (Pharmingen) as recommended by the manufacturer. Images were captured at 18 hours, thresholded, and the total number of pixels above threshold were calculated to estimate the area of Annexin V positive staining. We measured fluorescence levels of 5 replicate cell colonies each hour for 25 hours after exposure to 10 durations of 25 ng ml–1 TNF-α in each of 3 separate unattended experiments. To parameterize response durations, each GFP response curve was defined as the distance between the two second derivative extrema calculated from each smoothed fluorescence time course. This value represents the time between the beginning of the fluorescence increase and the attainment of the peak fluorescence level. Sources of variability in quantifying reporter dynamics by time lapse imaging and automated analysis have been previously discussed.25Acknowledgements
We thank Mr Octavio Hurtado and Mr Pohun Chris Chen for technical support. The work was partially supported by the National Institute of Biomedical Imaging and Bioengineering under Grant No. P41 EB002503 (BioMEMS Resource Center), by NIH Grants GM065474 and AI063795, and a grant from Shriners Hospital.References
- L. Ulloa and K. J. Tracey, Trends Mol. Med., 2005, 11, 56–63 CrossRef CAS.
- M. Tschop, R. Wawarta, R. L. Riepl, S. Friedrich, M. Bidlingmaier, R. Landgraf and C. Folwaczny, J. Endocrinol. Invest., 2001, 24, RC19–21 Search PubMed.
- B. O. Yildiz, M. A. Suchard, M. L. Wong, S. M. McCann and J. Licinio, Proc. Natl. Acad. Sci. U. S. A., 2004, 101, 10434–10439 CrossRef CAS.
- S. Ogawa, J. Lozach, C. Benner, G. Pascual, R. K. Tangirala, S. Westin, A. Hoffmann, S. Subramaniam, M. David, M. G. Rosenfeld and C. K. Glass, Cell, 2005, 122, 707–721 CrossRef CAS.
- S. L. Werner, D. Barken and A. Hoffmann, Science, 2005, 309, 1857–1861 CrossRef CAS.
- U. S. Bhalla, J. Chem. Neuroanat., 2003, 26, 81–86 CrossRef.
- M. J. van Stipdonk, G. Hardenberg, M. S. Bijker, E. E. Lemmens, N. M. Droin, D. R. Green and S. P. Schoenberger, Nat. Immunol., 2003, 4, 361–365 CrossRef.
- L. O. Murphy and J. Blenis, Trends Biochem. Sci., 2006, 31, 268–275 CrossRef CAS.
- R. E. Dolmetsch, K. Xu and R. S. Lewis, Nature, 1998, 392, 933–936 CrossRef CAS.
- S. Takayama, E. Ostuni, P. LeDuc, K. Naruse, D. E. Ingber and G. M. Whitesides, Nature, 2001, 411, 1016 CrossRef CAS.
- D. Irimia, D. A. Geba and M. Toner, Anal. Chem., 2006, 78, 3472–3477 CrossRef CAS.
- D. Irimia, S. Y. Liu, W. G. Tharp, A. Samadani, M. Toner and M. C. Poznansky, Lab Chip, 2006, 6, 191–198 RSC.
- F. K. Balagadde, L. You, C. L. Hansen, F. H. Arnold and S. R. Quake, Science, 2005, 309, 137–140 CrossRef.
- E. M. Lucchetta, J. H. Lee, L. A. Fu, N. H. Patel and R. F. Ismagilov, Nature, 2005, 434, 1134–1138 CrossRef CAS.
- N. Li Jeon, H. Baskaran, S. K. Dertinger, G. M. Whitesides, L. Van de Water and M. Toner, Nat. Biotechnol., 2002, 20, 826–830 CAS.
- A. Sawano, S. Takayama, M. Matsuda and A. Miyawaki, Dev. Cell, 2002, 3, 245–257 CrossRef CAS.
- J. Olofsson, H. Bridle, J. Sinclair, D. Granfeldt, E. Sahlin and O. Orwar, Proc. Natl. Acad. Sci. U. S. A., 2005, 102, 8097–8102 CrossRef CAS.
- M. Fotin-Mleczek, F. Henkler, D. Samel, M. Reichwein, A. Hausser, I. Parmryd, P. Scheurich, J. A. Schmid and H. Wajant, J. Cell Sci., 2002, 115, 2757–2770 CAS.
- X. Han and E. S. Boyden, PLoS ONE, 2007, 2, e299 Search PubMed.
- A. C. Carvalho, J. Sharpe, T. R. Rosenstock, A. F. Teles, R. J. Youle and S. S. Smaili, Cell Death Differ., 2004, 11, 1265–1276 CrossRef CAS.
- X. Bonnefont, A. Lacampagne, A. Sanchez-Hormigo, E. Fino, A. Creff, M. N. Mathieu, S. Smallwood, D. Carmignac, P. Fontanaud, P. Travo, G. Alonso, N. Courtois-Coutry, S. M. Pincus, I. C. Robinson and P. Mollard, Proc. Natl. Acad. Sci. U. S. A., 2005, 102, 16880–16885 CrossRef CAS.
- M. Imao, M. Nagaki and H. Moriwaki, Lab. Invest., 2006, 86, 959–967 Search PubMed.
- H. M. Beere, J. Clin. Invest., 2005, 115, 2633–2639 CrossRef CAS.
- M. Karin and A. Lin, Nat. Immunol., 2002, 3, 221–227 CrossRef CAS.
- K. R. King, S. Wang, D. Irimia, A. Jayaraman, M. Toner and M. L. Yarmush, Lab Chip, 2007, 7, 77–85 RSC.
- A. Hoffmann, A. Levchenko, M. L. Scott and D. Baltimore, Science, 2002, 298, 1241–1245 CrossRef CAS.
Footnote |
| † Electronic supplementary information (ESI) available: Five movie files and further experimental details. See DOI: 10.1039/b716962k |
| This journal is © The Royal Society of Chemistry 2008 |
