Combinatorial synthesis and high-throughput photopotential and photocurrent screening of mixed-metal oxides for photoelectrochemical water splitting
Jordan E.
Katz
,
Todd R.
Gingrich
,
Elizabeth A.
Santori
and
Nathan S.
Lewis
*
Beckman Institute and Kavli Nanoscience Institute, Division of Chemistry and Chemical Engineering, 210 Noyes Laboratory, 127-72 California Institute of Technology, Pasadena, California 91125, USA
First published on 6th November 2008
Abstract
A high-throughput method has been developed using a commercial piezoelectric inkjet printer for synthesis and characterization of mixed-metal oxide photoelectrode materials for water splitting. The printer was used to deposit metal nitrate solutions onto a conductive glass substrate. The deposited metal nitrate solutions were then pyrolyzed to yield mixed-metal oxides that contained up to eight distinct metals. The stoichiometry of the metal oxides was controlled quantitatively, allowing for the creation of vast libraries of novel materials. Automated methods were developed to measure the open-circuit potentials (Eoc), short-circuit photocurrent densities (Jsc), and current density vs. applied potential (J–E) behavior under visible light irradiation. The high-throughput measurement of Eoc is particularly significant because open-circuit potential measurements allow the interfacial energetics to be probed regardless of whether the band edges of the materials of concern are above, close to, or below the values needed to sustain water electrolysis under standard conditions. The Eoc measurements allow high-throughput compilation of a suite of data that can be associated with the composition of the various materials in the library, to thereby aid in the development of additional screens and to form a basis for development of theoretical guidance in the prediction of additional potentially promising photoelectrode compositions.
Broader contextAlthough sunlight provides by far the most abundant renewable energy resource, solar energy utilization at massive scale will require integrated storage and distribution, in addition to technologies that enable solar energy capture and conversion. Due to their very high energy density, far dwarfing that of batteries, compressed air energy storage systems, or pumped hydro systems, chemical fuels present an extraordinarily attractive option for enabling persistent, long term, high deliverability and high energy density, solar energy storage on a massive scale. Photovoltaics in series with electrolysis units accomplish this functionality, but require expensive electrical interconnections between the two separate (individually and collectively expensive) components of the energy system. Photosynthesis accomplishes the conversion of sunlight into chemical fuel (initially in the form of NADH and ultimately in the form of reduction of CO2 to form sugars), albeit at very low (<1%) yearly averaged real energy efficiencies. Artificial photosynthesis has been shown to produce fuel from sunlight with much higher (>10%) overall energy conversion efficiency. However, photoelectrode materials for artificial photosynthesis that exhibit long-term stability in sunlight are relatively inefficient at fuel production, and conversely photoelectrode materials that exhibit high energy conversion efficiencies are relatively unstable. New materials that simultaneously possess both of these attributes are thus desirable. One approach to this problem, as described herein, is to explore a wide set of new photoelectrode materials in a combinatorial fashion, enabling screening of a wide variety of possibilities while compiling a structure–function database to guide yet further exploration and screening of promising new photoelectrodes. If a suitable material were successfully identified and developed, in principle it would underpin the development of a complete solar energy capture, conversion, and storage system that would be capable, if suitably widely deployed, of providing hundreds of exaJ per year of energy from sunlight in a storable, transportable, readily utilizable form, i.e. as chemical fuel. |
I. Introduction
Several wide band-gap metal oxide semiconductors, such as TiO2, SrTiO3, and KTaO3, have been shown to split water efficiently and to be chemically stable.1–5 However, these materials have band gaps of 3 eV or larger, and hence have relatively poor overlap with the solar spectrum at the surface of the earth. This poor spectral overlap results in these materials having overall solar energy-to-fuels conversion efficiencies of 1–2%. Other materials, such as CdTe or InP, have band-gaps that are better matched to the solar spectrum, but these semiconductors either corrode or develop electrically insulating overlayers when used as photoelectrodes in aqueous solution.6–8 Still other materials are stable and have band gaps relatively well matched to the solar spectrum, but do not produce photoexcited electrons with sufficient potential to reduce water to H2 and/or photogenerated holes with sufficient potential to oxidize water to O2.2One approach to expanding the set of suitable photoelectrode materials is to take a material that partially satisfies the spectral overlap, energetic, and stability requirements for water photoelectrolysis and attempt modify the material so as to ameliorate its deficiencies. For example, the addition of Ni to InTaO4 enhances the long-wavelength response of the material, producing photoactivity at wavelengths of light as long as 420 nm, although overall energy-conversion efficiencies in sunlight are still <1%.9 Similarly, many researchers have tried to develop chemical methods to passivate the semiconductor to prevent corrosion or degradation.10–12
Another approach involves the use of combinatorial methods to synthesize new materials and characterize their photoelectrochemical properties using a high-throughput process.13–17 We present herein a high-throughput synthesis and screening methodology for testing the photoelectrochemical properties of novel semiconducting compounds. A commercial piezoelectric inkjet printer is used to quantitatively combine up to eight different metal solutions at once, and the resulting mixture is then pyrolyzed to form mixed-metal oxides. The photoelectrochemical properties of these compounds are then determined in a high-throughput fashion by measurement of the open-circuit potential, Eoc, as well as the photocurrent. Measurement of Eoc under high-intensity illumination provides a measurement of the majority-carrier quasi-Fermi level under illumination, allowing compilation of a database of key photoelectrode performance properties associated with the materials of concern. In this fashion, the data can be used to guide secondary screens, to help formulate directions for new primary screens, and to form a basis for analysis by theory to guide exploration of additional sets of materials for desirable activity in photoelectrochemical solar-based water splitting.
II. Experimental
A. Materials
Glass coated with fluorine-doped tin oxide (FTO) (Hartford Glass, TEC 15) was used as the substrate for the mixed-metal oxides. Prior to deposition of the metal solutions, the FTO-coated slides were washed thoroughly with soap and water, rinsed with distilled water and isopropanol, and dried under a stream of N2(g). The FTO was then treated with SurfaSil Siliconizing Solution (Pierce) to make the surface hydrophobic, and rinsed sequentially with isopropanol, water, and again with isopropanol, before being dried under a stream of N2(g). The metal nitrates Al(NO3)3, Cu(NO3)2, Co(NO3)2, Ni(NO3)2, Sr(NO3)2, Cr(NO3)3, Fe(NO3)3, and Zn(NO3)2 (all from Aldrich and ≥ 98% purity), and a water-stable titanium complex, titanium(IV) bis(ethyl aceto-acetato)diisopropoxide (Tyzor LA, Aldrich), were used as received. The metal solutions for inkjet printing were made by dissolving sufficient metal salt into a base stock ink solution (MIS Associates) to produce 0.5 M metal ion concentrations. To improve the solubility of some of the metal salts, the base stock was first acidified with glacial acetic acid (Aldrich, > 99.99%) to pH 4.5 for metal nitrate solutions and to pH 7.0 for Tyzor solutions. Electrolyte solutions for photoelectrochemical characterization consisted of 1.0 M KOH(aq) in > 18.1 MΩ cm resistivity H2O, obtained from a Barnsted Nanopure system.B. Combinatorial metal oxide synthesis
A refurbished Epson Stylus Photo R800 piezoelectric inkjet printer (Epson.com) was used to deposit mixed-metal nitrate solutions directly onto a FTO-coated glass substrate. Instead of the standard eight ink cartridges, eight empty spongeless ink cartridges (MIS Associates) were each filled with a metal ion solution. A 2.3 mm thick high-density polyethylene (HDPE) template (Small Parts, Inc.) was cut to allow glass slides to be fed into the front of the printer using the CD-printing functionality.The QuadTone Raster Image Processor software (QTR) (http://www.quadtonerip.com) was used to obtain quantitative control of the relative proportion of the printed metal solutions. QTR allows for user-defined control of how much ink is deposited from each cartridge. Using the QTR software, a file (a so-called “quad file”) was used to define each gray-scale color so as to produce a specific volume of metal solution to be printed from each printer cartridge. A gray-scale tagged image file format (TIFF) image, with a maximum of 256 distinct gray-scale colors, was then printed (see Fig. 1). The same TIFF image was printed in each case, but each time using a different quad file in QTR, resulting in a different mapping of the gray-scale color to the printed mixed-metal composition. In this way, a unique set of mixed-metal oxides was printed on each FTO-coated glass slide.
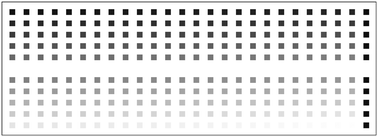 | ||
| Fig. 1 The gray-scale TIFF image printed using the QTR software to make quantitatively predetermined mixtures of 255 different mixed-metal oxides on a single substrate. Rather than printing different images to generate different mixtures, the same TIFF file was used each time, but the QTR software used a new quad file to generate the desired variation in elemental composition. The right-most column is composed of five controls that are five well-characterized materials with known open-circuit potentials. | ||
After being printed, the metal solutions were dried at 80 °C for ∼30 min, heated under flowing air at 500 °C for 3 h, and then cooled to room temperature over ∼8 h.
C. Characterization of printed metal oxides
To ensure quantitative mixing of the aqueous metal solutions, the composition of mixed-metal oxide samples was characterized by energy dispersive spectroscopy (EDS) using a LEO 1550VP scanning electron microscope (SEM) equipped with an Oxford INCA 300 spectrometer. After pyrolysis, the printed thickness of the metal oxide samples was determined using a Dektak 3030 profilometer.D. Photoelectrochemical measurements
For photoelectrochemical measurements, a FTO-coated glass substrate was submerged in 1 M KOH(aq) (except for 1–2 cm at the top where electrical contact was made) and illuminated through a quartz window (GM Associates) by a 150 W Xe arc lamp. All measurements were made using LabView software, via a National Instruments BNC-2100 connector block and a PCI-6034E data acquisition card. The illumination intensity was measured with a Newport 815 power meter. As described below, the photoelectrochemical properties of the mixed-metal oxide materials were determined using either a photocurrent-only measurement system or using a system equipped to measure both the open-circuit photopotential and the short-circuit photocurrent.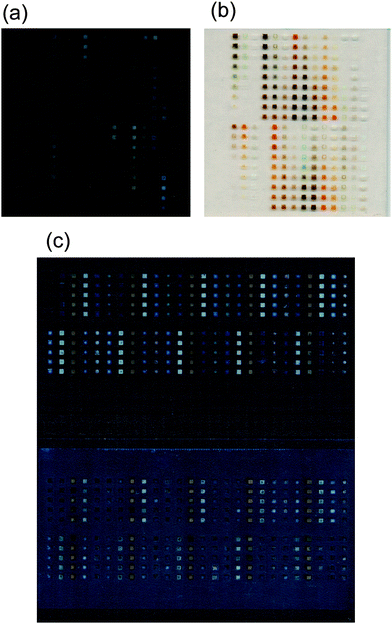 | ||
| Fig. 2 Image of mixed-metal oxide spots printed on a FTO-coated glass substrate using an inkjet printer, which produced quantitatively predetermined mixtures of aqueous metal solutions that were then baked at 500 °C to form oxides. (a) and (b) Printed slides on a continuous FTO-coated glass substrate, as used for the photocurrent measurement setup. Panels (a) and (b) are images of the same slide, but a different background, for improved contrast in each image. (c) Image of the slide with a repeating pattern of five mixed-metal oxides, as described in the text. The upper image shows the slide after pyrolysis, and the bottom shows the slide after the FTO back-contact surface area had been coated with epoxy. | ||
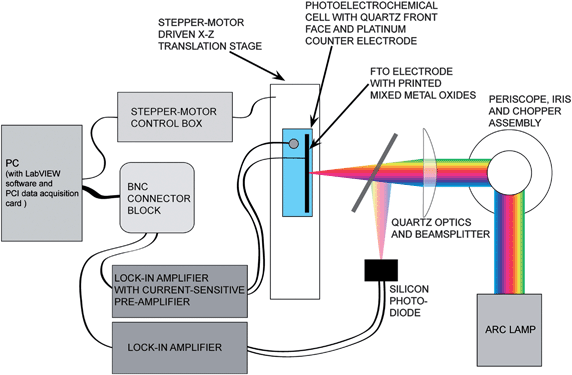 | ||
| Fig. 3 Schematic of the photocurrent apparatus. A Xe arc lamp provided white light illumination that was focused onto the substrate. The entire electrochemical cell was moved using a X–Z translation stage, illuminating in sequence each printed material on the slide. The photocurrent from the mixed-metals oxides, and from a reference Si diode, respectively, were monitored using lock-in amplifiers, and a computer then recorded both values. | ||
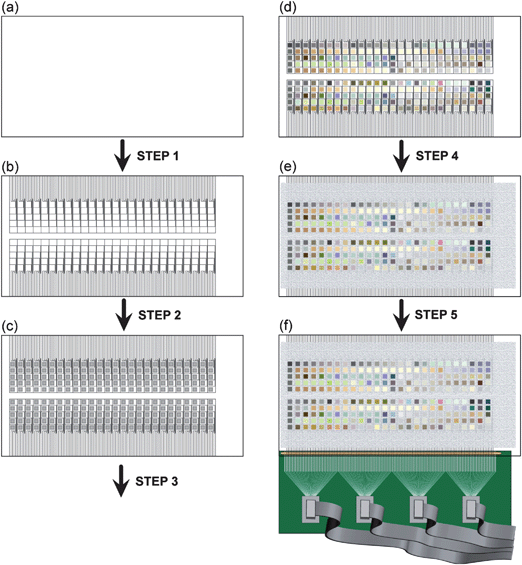 | ||
| Fig. 4 Schematic of the process of preparing the substrate and making electrical contact to 130 individual materials on a single piece of FTO-coated glass. (a) The substrate started as a sheet of glass uniformly coated with FTO. (b) In Step 1, the FTO-coated glass was laser etched with a spot size of 50 µm. The etched FTO substrate, with 260 electronically isolated squares, with 130 contact pads along each of the two long sides of the substrate. (c) In Step 2, the substrate was carefully cleaned and treated with siliconizing liquid for hydrophobicity, and aqueous solutions of metals were then printed using a commercial inkjet printer. After printing, the slide was dried at ∼80 °C. In Step 3, the substrate was baked at 500 °C for 3 h and cooled overnight, pyrolyzing the metal salts. (d) After baking, mixed metal oxides of varying coloration were generated. (e) In Step 4, the substrate was screen printed with a screen-printable epoxy, to passivate the surface area of the slide that was not covered by metal oxide spots. This step reduced the interfacial capacitive charging and minimized any deleterious electron-transfer processes that might occur at the FTO-water interface. (f) In Step 5, electrical contact was made to each of the 130 contact pads along the edge of the substrate using an elastomeric connector clamped between a custom-made PCB with corresponding contact pads. Each contact pad on the PCB was routed to one of four ribbon cable connectors, which were subsequently connected to a second PCB (not shown). | ||
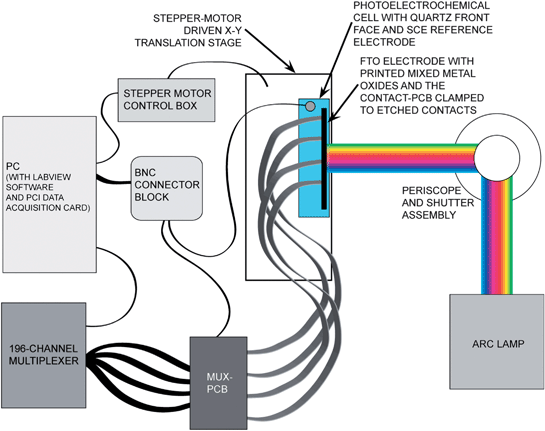 | ||
| Fig. 5 Schematic of the experimental apparatus for combinatorial measurement of open-circuit potentials of mixed-metal oxides. The loosely focused output of a Xe arc lamp illuminated 10–15 printed spots at once. A motorized translation stage was used to keep the spots being measured in the region of maximum intensity as the materials on the slide were scanned from right to left. Each spot was electronically addressed individually via the contact-PCB, which was clamped to the etched FTO substrate. Four 34-wire ribbon cables were routed to the mux-PCB, which was interfaced with a computer-controlled 196-channel multiplexer. | ||
III. Results
A. Quantitative mixing of aqueous metal ion solutions with an inkjet printer
A printer driver other than the Epson-provided driver was needed to print mixtures with pre-determined compositions. The QTR software allows the user to create a complete color-managed system for black and white printing. To print using QTR, a single TIFF image, consisting of 256 different gray-scale colors (see Fig. 1), was generated using Matlab. In a separate “quad file,” each color was uniquely defined in terms of a specific amount of solution to be dispensed from each of the eight printer cartridges. The same TIFF image was printed on each substrate, but a different quad file was selected to create 255 new mixed-metal oxides, (the 256th gray-scale color was reserved for the area surrounding the spots, and thus always defined as printing nothing).
| Measured | Expected | Error | ||
|---|---|---|---|---|
| Fe | Co | Fe | Co | |
| 0.58 | 0.42 | 0.70 | 0.30 | 12% |
| 0.51 | 0.49 | 0.60 | 0.40 | 9% |
| 0.41 | 0.59 | 0.50 | 0.50 | 9% |
| 0.32 | 0.68 | 0.40 | 0.60 | 8% |
| 0.24 | 0.76 | 0.30 | 0.70 | 6% |
| 0.15 | 0.85 | 0.20 | 0.80 | 4% |
| 0.06 | 0.94 | 0.10 | 0.90 | 4% |
![[hair space]](https://www.rsc.org/images/entities/char_200a.gif) |
||||
| Co | Ni | Co | Ni | |
| 0.88 | 0.12 | 0.90 | 0.10 | 2% |
| 0.81 | 0.19 | 0.80 | 0.20 | 1% |
| 0.35 | 0.65 | 0.40 | 0.60 | 5% |
![[hair space]](https://www.rsc.org/images/entities/char_200a.gif) |
||||
| Cu | Sr | Cu | Sr | |
| 0.31 | 0.69 | 0.40 | 0.60 | 9% |
| 0.23 | 0.77 | 0.30 | 0.70 | 7% |
![[hair space]](https://www.rsc.org/images/entities/char_200a.gif) |
||||
| Cu | Cr | Cu | Cr | |
| 0.37 | 0.63 | 0.30 | 0.70 | 7% |
| 0.47 | 0.53 | 0.40 | 0.60 | 7% |
| 0.56 | 0.44 | 0.50 | 0.50 | 7% |
![[hair space]](https://www.rsc.org/images/entities/char_200a.gif) |
||||
| Co | Cu | Co | Cu | |
| 0.41 | 0.59 | 0.40 | 0.60 | 1% |
| 0.49 | 0.51 | 0.50 | 0.50 | 1% |
For binary combinations of metals, the EDS analysis matched the expected percentage to within 5–10 percentage points (as much as 15, but within 10 percentage points the large majority of the time). This accuracy should be sufficient for an initial screen of the metal oxide compositional space.
B. Photoelectrochemical characterization
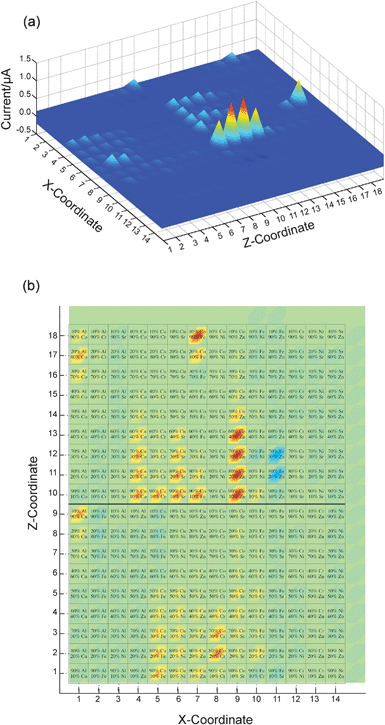 | ||
| Fig. 6 False color images of the photocurrent of a slide that contained spots of binary mixed-metal oxides. (a) Three-dimensional plot showing the physical position of each compound on the FTO substrate (X- and Z-coordinates correspond to the row and column of the spot, respectively) and the photocurrent measured for each spot. Positive values indicate a cathodic photocurrent. Column 15 and row 19 had nothing printed on them, and the bare FTO served as a control. (b) Top-down view of the same data, with the composition of each spot superimposed on a false-color image indicating its photocurrent. In this view, the materials that gave anodic currents are more clearly visible (light blue spots—in particular in rows 11–12, column 11). | ||
Initial measurements revealed a number of metal oxides that exhibited anodic or cathodic photocurrents having a magnitude between 10−9 and 10−6 A in the probed ∼4 mm2 printed spot area. While most materials tested gave no photoresponse at all, several binary combinations gave particularly strong photocathodic currents, including combinations of Co and Zn (80–20 and 70–30% Co and Zn, respectively), Co and Fe (90% Co and 10% Fe), and Al and Co (80% Co and 20% Al) (Fig. 6). For many materials, de-oxygenation of the electrolyte solution, by bubbling N2(g) through the cell, resulted in significantly increased photocurrents. Additionally, for several materials, the measured photocurrent changed over time. These changes included both increases and decreases in the magnitude of the photocurrent on the order of 50–100%, and occurred over a period of hours as well as from day to day.
The combination of etching the FTO-coated glass substrate to electronically isolate the spots, and covering the FTO back contact area with epoxy, solved the issues with the low Eoc values and the long apparent electrode response and recovery times. To electronically contact 130 individual spots on the etched FTO-coated glass electrode, a contact PCB, with a high density of metallic contact pads along one edge (as shown in Fig. 4f) was designed. An elastomeric connector was used to improve the conductivity of the connection, resulting in negligible contact resistance between the FTO and the contact PCB. To ensure that proper alignment was achieved each time, a resistance measurement was performed across two pairs of contacts on each end of the FTO-coated glass substrate.
Metal oxides printed on etched FTO substrates gave substantially faster response times, but the measured Eoc still did not match the values expected for test materials, in particular for TiO2. For TiO2 at the same illumination intensity, Eoc changed from −0.81 V to −0.88 V vs. SCE by simply coating with epoxy the surrounding FTO substrate that was exposed to the electrolyte. Under strong illumination, the measured Eoc of TiO2 was within 200 mV of the reported flat-band potential for TiO2 at pH 14. Finally, covering the edges of the sample with transparent epoxy resulted in Eoc = −1.1 V vs. SCE for TiO2.
To test the overall measurement methodology, a repeating pattern composed of five materials was generated on a single FTO substrate (Fig. 2c). Each material was printed with five thicknesses (as controlled by changing the total volume of metal solution deposited by the printer), and each material was printed five times at each thickness value. Fig. 7 shows the Eoc values recorded from this slide. Some variation was observed in Eoc as a function of spot thickness, but spots with nominally identical compositions gave similar Eocvalues.
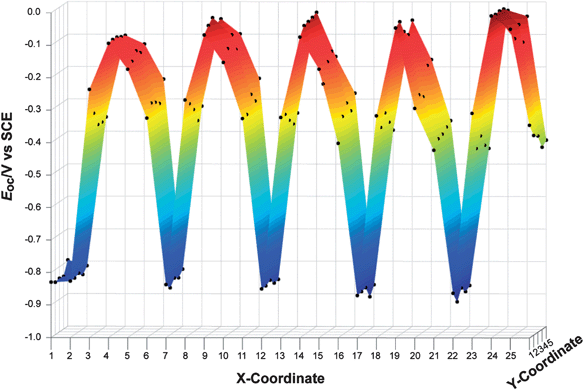 | ||
| Fig. 7 Open-circuit potentials for a control sample of mixed-metal oxides as a function of position on the FTO substrate. A photograph of the substrate itself is shown in Fig. 2c. A repeating pattern of five mixed-metal oxides was printed from left to right (with one extra column of TiO2 at an x-coordinate equal to one). With each series of five columns (i.e., x-coordinates 2–6, 7–11, 12–16, etc.), the volume of aqueous metal solution that was inkjet printed varied from 30 to 62% of the maximum possible, resulting in material thicknesses from 180 nm to 420 nm. The open-circuit photopotentials were only weakly dependent on the relative thickness of the printed oxide, and were highly reproducible for nominally identical printed spots. | ||
The Eoc of the printed metal oxide materials in the dark varied greatly (values between +0.2 V and −0.3 V vs. SCE were observed). This variation was not unexpected, because the solution potential is not well defined in the dark, but the variation introduced ambiguity in the determination of the polarity of the photocatalytic activity. Blocking the light beam briefly and measuring the shift in Eoc from light to dark was used to verify the effect of illumination.
Fig. 8 shows a logarithmic dependence of Eoc on the illumination intensity on a printed TiO2 spot. The slope of a linear fit of Eocvs. the logarithm of the illumination power was −76 ± 12 mV per decade.
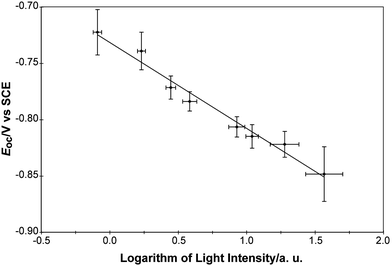 | ||
| Fig. 8 Linear fit of the measured open-circuit potential vs. the logarithm of the light intensity for TiO2 samples. The slope of the fit was −76 ± 12 mV per decade. The sign of the slope indicates that TiO2 is a photoanode. | ||
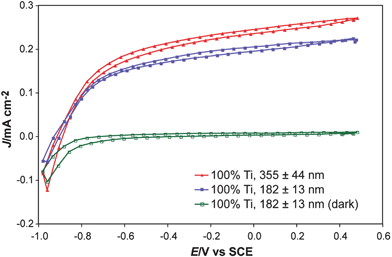 | ||
| Fig. 9 J–E behavior of inkjet-printed TiO2 on an etched FTO-coated glass substrate. The measured open-circuit potentials were the same, within the experimental error, as those measured by scanning J–E curves as well as by direct open-circuit measurements (although the J–E curves show non-negligible hysteresis). These measurements illustrate the flexibility of electronically isolating each material on the substrate, and also indicate that the volume of solution printed did significantly affect the measured photocurrent, but the open-circuit potential was relatively unchanged. Although the short-circuit current is in general a linear function of illumination intensity and of the light-harvesting ability of the material, the open-circuit potential has a much less sensitive, logarithmic dependence, on the light intensity. This means that day-to-day variability in light intensity or in a given material's optimal deposition thickness will have a minor affect on the open-circuit potential screening results. | ||
IV. Discussion
Combinatorial synthesis and screening of novel mixed-metal oxide photoelectrodes has been demonstrated previously.13–17 The methodology described here affords several interesting capabilities. The first is the large number of metals that can be combined simultaneously during a single printing. The second is the information gleaned from an Eoc measurement. The third is the flexibility in the types of photoelectrochemical measurements that can be made combinatorially and with high throughput.A. Inkjet printing of aqueous metal oxide precursors
One important advantage of using the deposition method described herein is the very low cost for the entire printing system, which required no significant modification to a commercially available commodity inkjet printer. Using the QTR software, the printer provided accurate and reproducible deposition of solution volumes, allowing simultaneous control of both the spot composition and the total amount of material printed. This capability obviated the need to reprint a spot multiple times to increase the spot thickness, which in turn requires precise alignment of the substrate each time. Furthermore, the printer's eight ink cartridges allow a very large number of materials to be printed without changing the solutions in the printer, greatly decreasing the time required to print a library of mixtures consisting of three or more metals as compared to the printing time of a system that dispenses only one metal solution at time. The ability to load and use eight solutions simultaneously also minimized cross-contamination that could otherwise arise from the repeated printing of different solutions through a common set of printer nozzles.Rather than producing a relatively smooth gradient of compositions, as reported by Woodhouse et al.,13 the system described herein used a quantized step size in elemental composition of the deposited metal salts. This step size must balance the need to fully explore the eight-dimensional compositional space while limiting the number of materials to synthesize and characterize in a preliminary compositional screen. For example, to prepare every possible combination of the eight metal solutions using a composition step size of 10% by mole fraction would require 78 FTO-coated glass slides each containing spots having 255 unique materials. If a promising material were found, the compositional parameter could be further optimized in a secondary screening step, to maximize the photoactivity.
Printing isolated spots of mixed-metal oxides provided several advantages relative to printing overlapping gradients.13 For photocurrent measurements, the relatively large spot-to-spot distance meant that the spatial resolution of the illumination source was not critical to the measurement, allowing the use of the focused beam of an arc lamp to provide intense white light excitation, rather than a continuous wave laser. Use of white light from an arc lamp is extremely versatile, in that its broad spectrum has significant intensity from 200 nm to 2500 nm. The use of a series of long-pass (or band-pass) optical filters in the beam path provides a simple, low-cost method for determining the wavelength dependence of the photoresponse of the metal oxides. Additionally, separation of the printed spots relaxes the need for high spatial resolution for other methods of characterization (beyond the scope of this study), such as XRD, EXAFS or XANES, to determine the phase, crystallinity or oxidation states of the printed materials.
B. Photocurrent measurements
The ability to generate photocurrent with a high external quantum yield (i.e., the fraction of electrons collected per incident photon) is an essential property of any efficient solar cell. However, the value of the photocurrent contains limited information as a criterion upon which to base a search for materials that can split water with visible light. Photocurrent can be generated by processes other than the desired water-splitting reaction, and conversely, a significant level of impurities in the material in the deposited spot could result in little or no photocurrent from an otherwise promising material.In a combinatorial screening system, a significant percentage of false positives are time consuming and inconvenient, in that they prompt more detailed investigation of a material that is in the end unsatisfactory. Our efforts to screen potential materials using only the photocurrent response resulted in a large number of such false positives. Conclusive determination of the origin of the photocurrent is at present far too time-consuming to be compatible with the high-throughput combinatorial approach of interest herein. In fact, the large majority of the photocurrents shown in Fig. 6 were ultimately deemed to be due to deleterious current-producing side reactions, rather than water splitting, as evidenced by the irreproducible magnitude of the photocurrent for these samples.
In addition to the inconvenience of false positives, photocurrent measurements fail to identify “near misses.” If a material that very nearly satisfied all of the energetic and stability requirements for water photoelectrolysis were synthesized, and a low photocurrent was measured, that material would be discarded and perhaps never re-investigated. For example, failure to absorb a significant amount of light due a combination of a thin printed sample and a relatively low absorption coefficient could lead to a low photocurrent. Another mechanism to produce low photocurrents is if the material absorbs light and produces electrons and holes at the required potentials for water-splitting, but has very slow interfacial electron-transfer kinetics. Yet another possibility is that perhaps the material is ideal in all ways except that the potential of the bottom of the conduction band is just very slightly more positive than the hydrogen evolution potential or the potential of the top of the valence band is very slightly more negative than the oxygen evolution potential.
C. Open-circuit potential measurements
E oc measurements also allow one to search for a complementary pair of photoanodes and photocathodes for water splitting. Rather than finding a single material that simultaneously satisfies all of the energetic and stability conditions for unassisted water photoelectrolysis, two light-absorbing materials can in principle be used in conjunction with each other. Such an approach changes two of the essential requirements: in a two-material case, the sum of the band-gaps of the materials must be >1.23 eV, and the conduction band edge of the photocathode must be more negative than the H2O/H2 potential, while the valence band edge of the photoanode must be more positive than the O2/OH− potential. Thus, by using two separate materials, the restrictions on viable materials are notably relaxed. Monitoring only the photocurrent, it is not possible to search individually for two materials that could drive each half-reaction when used together, since neither material would be capable of splitting water alone when used with a metallic counter-electrode.
Although it is important to compare Eoc at constant illumination for all samples, the logarithmic dependence ensures that Eoc varies by less than 100 mV per order of magnitude change in intensity.3 Variations in illumination intensity from spot to spot of more than a factor of two are very unlikely given the experimental setup. Furthermore, any photoanode that produces a majority-carrier quasi-Fermi level position under illumination within even 100–300 mV of the H2O/H2 potential would prompt further investigation. Preliminary screening of some 250 mixed metal oxides revealed no materials that produced Eoc within 0.5 V of the H2O/H2 potential (except for TiO2), and so choosing a relatively low threshold of Eoc for screening materials may in fact be sufficiently selective for secondary study.
If Eoc alone is measured, whether the material is a photoanode or photocathode, or even photoactive at all, can be ambiguous, due to the fact that there are two redox couples in solution with which the material can interact. Whether a material is photoactive is not always trivial to determine from Eoc alone, because of the varying potential of different spots in the dark produced by the lack of a well-defined solution redox potential in electrolytes that lack a rapid one-electron redox species. A material with Eoc = +0.2 V vs. SCE would be considered a very good photocathode in the screening process, but if the dark potential was already at that value due to variations in the poorly defined solution potential and not due to a photoelectrochemical effect, the screening method would have actually returned a false positive.
For a large negative Eoc value (e.g., Eoc < −1.1 V vs. SCE), one might safely assume that the material is a good photoanode and that the majority-carrier quasi-Fermi level is negative of the H2O/H2 potential. Similarly, a large positive Eoc value (e.g., Eoc > 0.2 V vs. SCE) would indicate a good photocathode, with the majority-carrier quasi-Fermi level positive of the O2/OH− potential. Intermediate Eoc values are harder to interpret without further information. A material with Eoc = 0 vs. SCE might be selected as a reasonable candidate for further investigation if it was a photocathode. In contrast, a photoanode with such a positive Eoc would be considered a very unsuitable material for water splitting. A third possible explanation is that the material could be inactive but the Nerstian potential of the cell in the dark happened to equal the potential of a SCE.
The sign of the slope of Eocvs. the logarithm of the illumination intensity determines whether the material is photoanodic or photocathodic. However, making measurements for a full series of light intensities for each material is too time-consuming for a high-throughput approach. The sign of the slope is what is essential here, not the exact value of the slope itself, and so the simplest possible comparison of light intensities can be made quickly and easily: light vs. dark.
The change in Eoc after blocking the illumination source (or going from dark to light) is indicative of the photoelectrochemical nature of the material. A photoanode will produce a more negative Eoc under illumination than in the dark, whereas a photocathode will produce a positive Eoc shift under illumination. Thus, a determination can be made quickly for each material by briefly blocking the light source with a shutter and fitting any subsequent change in potential as a linear function (as a simple characterization rather than as a physical model for the decay time profile). A fit with a positive slope indicates a photoanode, one with a negative slope indicates a photocathode, and no change in Eoc suggests that the material is not photoactive.
V. Conclusions
Arrays of mixtures of aqueous solutions of metal ions have been quickly and quantitatively deposited onto conductive glass substrates using a commercially available inkjet printer. These metal solutions were then pyrolyzed to form mixed metal oxides. By this method, very large numbers of combinations of up to eight different metals can be formed easily at low cost. We have also developed and demonstrated a screening method to search for materials capable of driving fuel-forming photoelectrochemical reactions. The proof-of-concept experiments presented herein illustrate the speed, flexibility, and ease of use of such systems. Most importantly, the methodology, in which the open-circuit potential of the material is determined, provides critical additional information not readily and rapidly available from photocurrent-only measurements. The approach is easily adaptable to a full array of photoelectrochemical characterization, such as current–voltage behavior, and even the spectral response, flat-band determination by capacitance measurements (Mott–Schottky analysis), and measurement of minority-carrier diffusion lengths.Acknowledgements
We acknowledge the Stanford Global Energy and Climate Project, and the U.S. Department of Energy, Office of Basic Energy Sciences, Basic Research for the Hydrogen Fuel Initiative, for support of this work. We also gratefully acknowledge Dr Michael Woodhouse and Prof. Bruce Parkinson at Colorado State University, and Dr Bruce Brunschwig at Caltech, for numerous valuable discussions. T.R.G. acknowledges financial support from the Carl and Shirley Larson SURF Fellowship and from an Amgen Scholars Fellowship.References
- J. M. Bolts and M. S. Wrighton, J. Phys. Chem., 1976, 80, 2641–2645 CrossRef CAS.
- H. H. Kung, H. S. Jarrett, A. W. Sleight and A. Ferretti, J. Appl. Phys., 1977, 48, 2463–2469 CrossRef CAS.
- A. Kumar, P. G. Santangelo and N. S. Lewis, J. Phys. Chem., 1992, 96, 834–842 CrossRef CAS.
- A. J. Nozik, Annu. Rev. Phys. Chem., 1978, 29, 189–222 CAS.
- K. Rajeshwar, P. Singh and J. Dubow, Electrochim. Acta, 1978, 23, 1117–1143 CrossRef CAS.
- H. O. Finklea, Semiconductor Electrodes, Elsevier, Amsterdam, 1988 Search PubMed.
- A. Heller, Acc. Chem. Res., 1981, 14, 154–162 CrossRef CAS.
- M. X. Tan, P. E. Laibinis, S. T. Nguyen, J. M. Kesselman, C. E. Stanton and N. S. Lewis, in Progress in Inorganic Chemistry, 1994, vol. 41, pp. 21–144 Search PubMed.
- Z. G. Zou, J. H. Ye, K. Sayama and H. Arakawa, Nature, 2001, 414, 625–627 CrossRef CAS.
- L. J. Webb, D. J. Michalak, J. S. Biteen, B. S. Brunschwig, A. S. Y. Chan, D. W. Knapp, H. M. Meyer, E. J. Nemanick, M. C. Traub and N. S. Lewis, J. Phys. Chem. B, 2006, 110, 23450–23459 CrossRef CAS.
- P. T. Hurley, E. J. Nemanick, B. S. Brunschwig and N. S. Lewis, J. Am. Chem. Soc., 2006, 128, 9990–9991 CrossRef CAS.
- F. R. F. Fan, G. A. Hope and A. J. Bard, J. Electrochem. Soc., 1982, 129, 1647–1649 CrossRef CAS.
- M. Woodhouse, G. S. Herman and B. A. Parkinson, Chem. Mater., 2005, 17, 4318–4324 CrossRef CAS.
- T. Arai, Y. Konishi, Y. Iwasaki, H. Sugihara and K. Sayama, J. Comb. Chem., 2007, 9, 574–581 CrossRef CAS.
- T. F. Jaramillo, S. H. Baeck, A. Kleiman-Shwarsctein, K. S. Choi, G. D. Stucky and E. W. McFarland, J. Comb. Chem., 2005, 7, 264–271 CrossRef CAS.
- S. H. Baeck, T. F. Jaramillo, C. Brandli and E. W. McFarland, J. Comb. Chem., 2002, 4, 563–568 CrossRef CAS.
- T. F. Jaramillo, A. Ivanovskaya and E. W. McFarland, J. Comb. Chem., 2002, 4, 17–22 CrossRef CAS.
- L. A. Harris and R. H. Wilson, Annu. Rev. Mater. Sci., 1978, 8, 99–134 CrossRef CAS.
| This journal is © The Royal Society of Chemistry 2009 |
