Fundamental studies on the ablation behaviour of Pb/U in NIST 610 and zircon 91500 using laser ablation inductively coupled plasma mass spectrometry with respect to geochronology
Barbara K.
Kuhn
*ab,
Karin
Birbaum
a,
Yan
Luo
c and
Detlef
Günther
*a
aLaboratory of Inorganic Chemistry, ETH Zurich, 8093, Zurich, Switzerland. E-mail: guenther@inorg.chem.ethz.ch; Fax: +41 44 633 1071; Tel: +41 44 632 4687
bZürcherische Arbeitsgemeinschaft zur Erforschung und Bekämpfung der Staublungen in der Schweiz, Institute for Mineralogy and Petrography, 8092, Zurich, Switzerland. E-mail: barbara.kuhn@alumni.ethz.ch; Tel: +41 44 632 6581
cAnalysis and Air Quality Section, Air Quality Research Division, Atmospheric Science and Technology Directorate, Science and Technology Branch, Environment Canada, Ottawa, Ontario, Canada K1A 0H3
First published on 6th November 2009
Abstract
Studies of the ablation rate, particle size distribution and signal intensities from NIST 610 and zircon 91500 were carried out using UV-ns LA-ICP-MS to investigate the limitations for non-matrix matched quantification of the Pb and U system. All major elements (Zr, Si, Hf) as well as Pb and U were measured in both matrices using different crater diameters. The results indicate two different laser ablation dominated sources of fractionation which prohibit non-matrix matched calibration for accurate age determination. Selective loss of Pb (crater diameter independent) and crater diameter dependent retention of U through phase change in the crater during the ablation of zircon are the two sources of fractionation which occur. However, at certain operating conditions the loss of Pb and the retention of U within the crater are equal. This leads to ages, which randomly agree with the reference age.
Introduction
Laser ablation ICP-MS has become one of the favoured techniques in geochronology and produces accurate data if matrix-matched calibration is used.1,2 Due to the fact that zircon reference materials are quite limited and each lab uses its own “in-house” zircon standards, the use of an abundant and well characterised standard such as NIST 610 as a calibration material would make the analyses more comparable. Different authors have proposed the use of NIST 6101,3–6 or NIST 6125,7–9 as an external standard. However, the measured Pb/U ratios and the calculated ages show a significant deviation from expected values for independently analyzed zircons. This deviation is crater size dependent4,5 and needs to be corrected either by solution nebulisation or by the measurement of a monitor (a zircon with a known composition and age). Yet, Horn et al. used NIST 610 for age determination and reported that the Pb/U ratio of NIST 610 falls on the same fractionation line as zircons4 which allows accurate age determination at large crater diameters. A study by Kosler et al.10 indicated however, that zircons undergo a phase separation during ablation, which is zircon-specific. Whereby, newly forming baddeleyite (tetragonal ZrO2) around the ablation crater provokes Zr, Hf and U to be deposited preferentially in this area. Pb does not seem to be influenced by fractionation but seems to be transported more efficiently.This study aimed to gain some insights into the behaviour of Pb and U during analysis. Various measurements were carried out to investigate the reported differences in fractionation of Pb and U for NIST 610 and zircon 91500. Therefore, ablation rates, particle size distributions and ICP-MS signal intensities were determined for both matrices using different crater diameters. Additionally, the number of ablated atoms was calculated for both matrices at the various crater diameters used for analysis and compared to the intensities. 206Pb and 238U concentrations in zircon were determined using all matrix elements (Si, Zr, Hf)11 as internal standards and NIST 610 as external standard. The ages were calculated based on the concentration ratios.
Experimental
For this study, an 193 nm ArF-Excimer laser (Lambda Physik, Goettingen, Germany) was operated at 10 Hz, 15 ns pulse width and a fluence of 19.5 J cm−2. The optical arrangement used,12 allows to change crater diameter without altering the energy density or ablation rate. All experiments were performed using helium as carrier gas. The carrier gas was mixed with argon as make-up gas before entering the ICP (see table 1). The laser generated aerosol was introduced in an Elan 6100 ICP-MS (PerkinElmer, Norwalk, CT, USA).| Laser system | ArF-excimer |
|---|---|
| Laser wavelength | 193 nm |
| Repetition rate | 10 Hz |
| Crater diameter | 20, 40, 60, 80 µm |
| Incident pulse energy | 2.2 mJ |
| Energy density on sample | 19.5 Jcm−2 |
| ICP-MS model | Elan6100 DRC |
| RF power | 1350 W |
| Gas flows | |
| Plasma (Ar) | 17.8 Lmin−1 |
| Auxiliary (Ar) | 0.8 Lmin−1 |
| Carrier (He) | 0.96 Lmin−1 |
| Make-up (Ar) | 0.76 Lmin−1 |
| Detector mode | Pulse counting + analogue |
| Isotopes determined | 29Si, 91Zr, 178Hf, 202Hg, 204Pb, 206Pb, 207Pb, 208Pb, 232Th, 235U, 238U |
| Dwell time | 10 ms |
| Quadrupol settling time | ca. 3 ms |
| Time/scan | 0.57 s/4 |
| Data acquisition | 143 s (60 s blank, 60 s ablation) |
Particle size distributions were measured using a HS-LAS (Particle Measuring Systems, Denver, CO, USA) which provides the particle size information based on laser light scattering measurements. The instrument covers a size range between 65 nm and 1 µm. The aerosol flow rate through this instrument was adjusted internally to 0.2 L min−1.
The crater depth was estimated using an optical microscope (Olympus BX51, Olympus Optical Co. Europe, Hamburg) in reflected light mode to determine the ablation rate.
Each analysis sequence was started with four measurements of NIST 610 followed by eight measurements of zircon 91500 and ended by another four measurements of NIST 610. Data acquisition and reduction were based on the protocol described by Longerich et al.13
The numbers of ablated atoms were calculated for each crater diameter using the ablation rate, the crater diameter and the element concentration in the two matrices (table 2). These calculations were based on the assumption of a conical crater where a diameter to depth ratio of 1:1 leads to a reduction of the diameter at the bottom of the crater of 20%. For the ratio of the intensity [cps] per ablated atoms, we use the term ‘detection efficiency’ in this study.
We are well aware of the fact that the absolute concentrations of Pb and U are not homogeneously distributed in zircon 91500. However, the Pb/U ratio is constant14,15 which is of major interest for the interpretation of the results.
Results
Ablation rate
To estimate the ablation rate of zircon 91500 and NIST 610, series of craters were ablated using different numbers of laser pulses and the depth of the craters determined. Although the first laser pulses ablate proportionally more material,16 the measured depth averaged over a time period of a typical analysis (60 s) shows a linear dependence on the number of pulses applied to the sample (figure 1). The ablation rate for zircon 91500 was approximately 140 nm/pulse, which is 1.5 times smaller than the ablation rate determined for NIST 610 (approximately 220 nm/pulse). Considering the densities, ablation rate and a conical crater formation within the two matrices over a period of 40 s, between 23 and 60% more mass of zircon is introduced into the plasma assuming similar transport efficiencies for both matrices.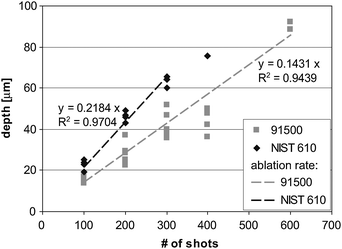 | ||
| Fig. 1 Determination of ablation rate for zircon 91500 and NIST 610 using a 193 nm ArF-excimer laser. The number of pulses was selected according to typical analysis duration. The linear regression includes 4–6 individual measurements for the depth between 100 to 300 pulses with an RSD of 3 to 10%. Including the values for 600 pulses changes the slope for zircon by less than 3%. | ||
Particle size distribution
The particle size distribution determined for both matrices indicate a typical bimodal size distribution for all spot sizes applied (figure 2). The dominating mass fraction for zircon was measured at a particle diameter smaller than 70 nm. The maximum of small particles might be below the measurement range of the instrument. A second and less pronounced maximum occurred at 150 nm. For NIST 610, the first maximum was measured at 70 nm and the second at 170–190 nm. In general, it can be seen that the majority of particles are well below the critical particle size for complete vaporization in the ICP.16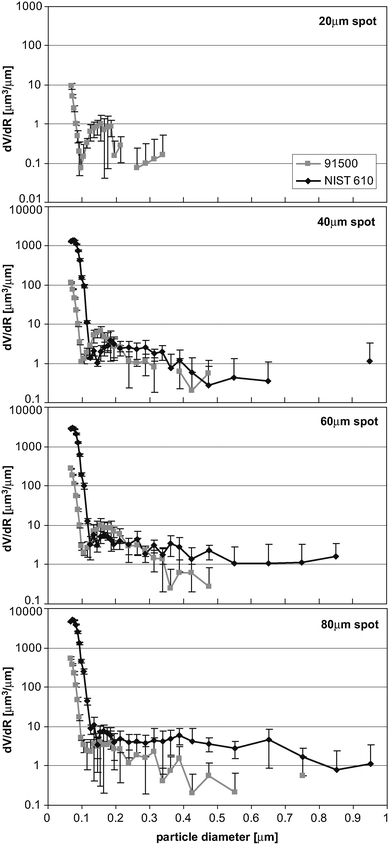 | ||
| Fig. 2 Particle size distribution measurements for zircon 91500 and NIST 610 at four different crater sizes showing bimodal distribution for both matrices. The measurements include the entire aerosol generated over a period of 60 s. | ||
Transient signal evaluation
The intensity ratio Pb/Si in zircon 91500 remains constant during the entire ablation period (60 s), while a minor fractionation in favour of Pb relative to Si (starting at 40 s) was measured in NIST 610 (figure 3a). This temporal change was most dominant for the 20 µm crater in this study. The Pb/Si ratio over the entire 60 s of ablation in zircon provided an RSD of 1–2% for crater diameters of 40 µm and above. In zircon, the ratio Pb/Zr (figure 3b) is constant over time and independent of crater diameters (>40 µm). For crater diameters of 20 µm the Pb/Zr ratio in zircon shows increased noise, which is due to the low concentration and therefore low count rates detected for Pb. The NIST 610 shows a linear increase in the ratio for crater diameters >40 µm.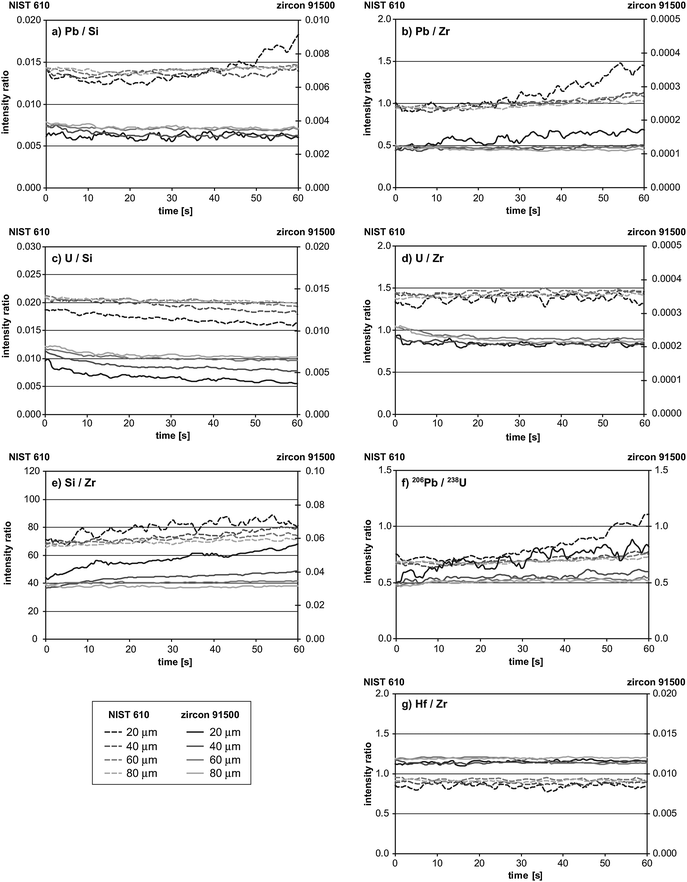 | ||
| Fig. 3 Temporal changes of various intensity ratios during ablation of NIST 610 and zircon 91500. | ||
The U/Si ratio (figure 3c) decreases linearly in both matrices and shows a distinct crater diameter dependence for small crater diameters (20–40 µm).
The U/Zr intensity ratios show pronounced temporal changes during the first 15 s of zircon ablation (figure 3d) whereafter they remain constant. Furthermore, the U/Zr ratios (60 s) indicate no significant variation in dependence of crater diameter for both matrices.
The Si/Zr ratio strongly increases over time except for large crater diameters in zircon (60–80 µm, figure 3e). The temporal change varies with crater diameter. This is a similar behaviour as the U/Si ratio and indicates a correlation between U and Zr.
A linear increase is observed in the Pb/U ratio for both matrices (figure 3f). The temporal changes are more pronounced in NIST 610 than in zircon 91500. A crater diameter dependence is only seen for 20 µm. In zircon 91500, the low Pb concentration leads to noisy signal at this crater diameter. The 20 µm crater in NIST 610, shows a change of slope at approx. 25 s. At this time the width/depth ratio exceeds 1:3, which is still below the critical aspect ratio reported by Mank and Mason.17
Considering both matrices, the U/Si ratio and the Si/Zr ratio provide the highest variability with respect to crater diameter. This together with the temporal changes of the matrix element ratio Si/Zr indicate non-stoichiometric ablation of Si and Zr (U) in zircon.
Ablated atoms, intensities and detection efficiency
The number of ablated atoms was calculated for each element in both matrices. The calculations were based on the estimated total mass ablated for each matrix (volume, density and concentration). The values for each matrix and the ratio of zircon 91500/NIST 610 are summarized in table 3. In addition, the corresponding measured intensities (cps) for each matrix and their ratios are given in table 4.| a normalized to one second. | ||||
|---|---|---|---|---|
| NIST 610 | ||||
| 20 µm | 40 µm | 60 µm | 80 µm | |
| 29Si | 0.22E + 12 | 1.46E + 12 | 3.85E + 12 | 7.41E + 12 |
| 91Zr | 0.24E + 09 | 1.59E + 09 | 4.21E + 09 | 8.11E + 09 |
| 206Pb | 0.21E + 09 | 1.37E + 09 | 3.63E + 09 | 6.99E + 09 |
| 238U | 0.80E + 09 | 5.27E + 09 | 13.95E + 09 | 26.82E + 09 |
| Zircon 91500 | ||||
| 20 µm | 40 µm | 60 µm | 80 µm | |
| 29Si | 0.16E + 12 | 0.90E + 12 | 2.24E + 12 | 4.20E + 12 |
| 91Zr | 0.41E + 12 | 2.27E + 12 | 5.65E + 12 | 10.57E + 12 |
| 206Pb | 0.05E + 09 | 0.27E + 09 | 0.66E + 09 | 1.24E + 09 |
| 238U | 0.22E + 09 | 1.22E + 09 | 3.05E + 09 | 5.70E + 09 |
| Atom ratio (zircon 91500/NIST 610) | ||||
| 20 µm | 40 µm | 60 µm | 80 µm | |
| 29Si | 0.74 | 0.62 | 0.58 | 0.57 |
| 91Zr | 1696 | 1422 | 1340 | 1303 |
| 206Pb | 0.23 | 0.19 | 0.18 | 0.18 |
| 238U | 0.28 | 0.23 | 0.22 | 0.21 |
| NIST 610 | ||||
| 20 µm | 40 µm | 60 µm | 80 µm | |
| 29Si | 0.21E + 06 | 0.86E + 06 | 1.70E + 06 | 2.92E + 06 |
| 91Zr | 6.45E + 03 | 27.28E + 03 | 56.87E + 03 | 99.33E + 03 |
| 206Pb | 14.93E + 03 | 60.23E + 03 | 124.61E + 03 | 209.91E + 03 |
| 238U | 0.08E + 06 | 0.35E + 06 | 0.73E + 06 | 1.26E + 06 |
| Zircon 91500 | ||||
| 20 µm | 40 µm | 60 µm | 80 µm | |
| 29Si | 0.13E + 06 | 0.52E + 06 | 1.00E + 06 | 1.65E + 06 |
| 91Zr | 6.81E + 06 | 32.35E + 06 | 68.87E + 06 | 125.44E + 06 |
| 206Pb | 2.24E + 03 | 8.82E + 03 | 17.86E + 03 | 30.75E + 03 |
| 238U | 13.02E + 03 | 65.10E + 03 | 139.20E + 03 | 247.38E + 03 |
| Measured cps ratio (zircon 91500/NIST 610) | ||||
| 20 µm | 40 µm | 60 µm | 80 µm | |
| 29Si | 0.63 | 0.61 | 0.59 | 0.57 |
| 91Zr | 1055 | 1186 | 1211 | 1263 |
| 206Pb | 0.15 | 0.15 | 0.14 | 0.15 |
| 238U | 0.16 | 0.18 | 0.19 | 0.20 |
Dividing the number of Si atoms ablated from zircon 91500 by the number of Si atoms ablated from NIST 610 leads to an ablated Si atom ratio of 0.74 for a crater diameter of 20 µm which changes to 0.57 for 80 µm. The measured Si intensity ratios between zircon 91500 and NIST 610 change from 0.63 at 20 µm to 0.57 at 80 µm. It can be seen, that at large crater diameters the intensity ratio is in good agreement with the ablated atom ratio (figure 4). The significant difference at the 20 µm crater (approx. 15%) could be caused by the uncertainty of volume estimation for the small crater diameter.
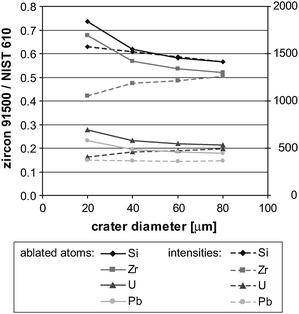 | ||
| Fig. 4 Ablated atom ratios and intensity ratios (zircon 91500/NIST 610) for different crater diameters. | ||
The same calculations for Zr demonstrate that the intensity ratio (zircon 91500/NIST 610) increases with increasing crater diameter while the ablated atoms ratio decreases. In contrast to Si, the two ratios do not converge completely at 80 µm. This indicates that the Zr remains at the ablation site in zircon (20 µm: 1.69 times difference between cps and ablated atoms, 80 µm: 1.08). The difference becomes smaller when ablating larger crater diameters. The changes measured for 238U are identical to those measured for Zr.
The ablated atoms ratio of 206Pb decreases from 20 to 40 µm craters and remains stable over all other crater diameters. Surprisingly, the intensity ratio of 206Pb between the two matrices is the most stable ratio and not correlated to any other matrix element. In contrast, Zr and U are well correlated in their intensity ratios but negatively correlated to the ablated atoms ratio.
Fig. 5 summarizes the differences in the ablated atoms and intensities (detection efficiency). The detection efficiency for Pb, Zr and U indicates losses during the ablation of zircon. Si shows only at 20 µm a 10% difference between the two matrices. Overall, the most significant differences between the two matrices were found for the detection efficiencies at 20 µm, which is partly related to the uncertainty of the volume determination.
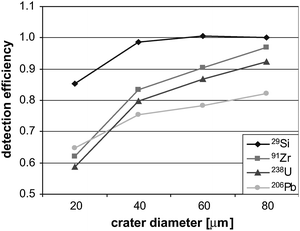 | ||
| Fig. 5 Detection efficiency ratio (zircon 91500/NIST 610) for different crater diameters for an ablation time of 40 s. Detection efficiency is calculated as intensity ratio divided by the ablated atoms ratio. | ||
Determination of concentrations using all matrix elements as internal standards
Table 5 summarizes the 206Pb and 238U concentrations determined using Si, Zr and Hf as internal standards. It can be seen that the Pb concentration remains stable within less than 6% over all crater diameters when using Si as internal standard. However, the determined Pb concentration in zircon 91500 was 26 to 21% lower than the reference concentration. Nevertheless, the standard deviation of the 206Pb concentration for each crater diameter (n = 8 for zircon 91500) were less than 4%. The U concentration increased from 55 to 72 µg/g (crater diameter dependent variation of 21%) when using Si as internal standard. From the small to the large crater the deviation of 238U from the reference value ranges from −30% to −9%.| crater size | concentration | |||||
|---|---|---|---|---|---|---|
| internal standard | Si | Zr | Hf | |||
| 206Pb | 238U | 206Pb | 238U | 206Pb | 238U | |
| literature14 | 14.9 | 79 | 14.9 | 79 | 14.9 | 79 |
| 20 µm | 11.1 ± 0.5 | 55 ± 2 | 15.5 ± 0.7 | 75 ± 2 | 15.5 ± 0.8 | 76 ± 3 |
| 40 µm | 11.1 ± 0.3 | 64 ± 2 | 13.7 ± 0.6 | 77 ± 4 | 14.4 ± 0.8 | 81 ± 5 |
| 60 µm | 11.2 ± 0.2 | 68 ± 2 | 12.8 ± 0.3 | 76 ± 2 | 13.8 ± 0.4 | 82 ± 3 |
| 80 µm | 11.8 ± 0.2 | 72 ± 2 | 12.7 ± 0.3 | 76 ± 2 | 12.8 ± 0.3 | 77 ± 2 |
Calculating the concentrations using Zr as internal standard leads to 238U concentrations which were within 0.7% independent of the crater diameter. The 238U concentrations were 5 % lower than the reference value, whereas the 206Pb concentrations changed in dependence on crater diameter from +8 % (20 µm) to −14% (80 µm). Similar results were obtained using Hf as internal standard.
Using Si as internal standard, concentrations for Zr and Hf approach the stoichiometric composition of the zircon towards larger crater diameters (table 6).
| crater size | concentration | |
|---|---|---|
| Zr | Hf | |
| literature | 465 432 | 5 895 |
| 20 µm | 343 100 ± 6 200 | 4 320 ± 90 |
| 40 µm | 390 300 ± 9 900 | 4 700 ± 180 |
| 60 µm | 417 900 ± 9 300 | 4 920 ± 150 |
| 80 µm | 447 700 ± 6 200 | 5 610 ± 80 |
Age determination
The age calculation for zircon 91500 was based on the 206Pb/238U concentration ratio. Due to the extremely low 204Pb signal, no 204Pb and Hg correction were applied. The ages, summarised in table 7, vary with crater diameter according to the variation in concentration of 206Pb or 238U (table 5). At crater diameter of 40 µm, the ages calculated are close to the reference value18 especially when using Zr as internal standard. As Zr and U are correlated but behave differently than Si, the age was determined using the concentration of 206Pb based on Si as internal standard and the concentration of 238U based on Zr. These ages show no crater diameter dependence but are 12–14% lower than the age given by Wiedenbeck et al.18| crater size | age | ||
|---|---|---|---|
| internal standard | Si | Zr | Si for Pb |
| Zr for U | |||
| 20 µm | 1237 ± 17 | 1256 ± 17 | 914 ± 16 |
| 40 µm | 1044 ± 16 | 1061 ± 17 | 878 ± 30 |
| 60 µm | 1001 ± 14 | 1017 ± 14 | 893 ± 9 |
| 80 µm | 986 ± 11 | 1002 ± 11 | 940 ± 11 |
Discussion
The temporal changes in intensity ratios (figure 3) strongly support a phase change from zircon to baddeleyite and SiO2 during ablation as reported by Kosler et al.10 The ablated atoms ratio compared to intensity ratios (figure 4) as well as the 206Pb and 238U concentrations calculated using all matrix elements as internal standards (table 5) are in agreement with these findings. According to Finch and Hanchar,19 the decomposition of zircon to tetragonal ZrO2 (baddeleyite) and cristobalite (high-temperature form of SiO2) takes place at 1690 °C. Melting points of the resulting phases (table 8) indicate that Pb and Si are easily mobilised during the decomposition of zircon. The affinity of U, Hf and Zr allows the incorporation of Hf and U in ZrO2. Therefore, these elements become more difficult to mobilise and remain in and around the crater. The phase transition most likely occurs along the inner surface of the crater.10 This is supported by the fact that the concentrations of U, Zr and Hf are approaching the reference values reported in the literature (using Si as internal standard) with increasing crater diameter (table 4) where the surface to volume ratio becomes smaller.In contrast to Zr, Hf and U retained within the crater, Si and Pb are removed out of the crater. Fig. 5 demonstrates that the sampling efficiency (ablation, transport and detection) of Si is the same in both matrices (40–80 µm). Fig. 5 and table 5 indicate a loss of Pb (21–26%) in zircon. For the 80 µm crater the 206Pb concentration is 21 % lower than the literature value whereas Zr and U are by 4% and 9% too low, respectively (internal standard: Si). The comparison of the Pb intensity between zircon 91500 and NIST 610 (figure 4) illustrate that this loss is crater diameter independent (almost constant with respect to the total ablated mass). The particle size distribution (PSD) measurements show that particles produced during the ablation of both materials (NIST 610 and zircon 91500) are sufficiently small to ensure complete vaporisation in the ICP. Therefore, ICP-induced changes are likely to be negligible for geochronology data using ns-laser ablation. However, PSD measurements on zircon 91500 indicated also that the particles are much smaller than typically measured when ablating NIST 610. Considering the particle transport efficiencies calculated are dependent on particle size21 it might well be that a considerable loss of nm sized particles or vapour occurs. Pb, as the most volatile element, is likely to be more abundant in the smallest particle size fraction or in the vapour phase and therefore lost by diffusion and condensation.
Conclusion
Based on the observed effects, it can be seen that an almost constant loss of Pb in the form of condensation and the crater diameter dependent retention of U (phase transition), are two independent and laser-induced sources of fractionation. The U loss is influenced by the crater surface to ablated mass ratio and can be corrected by Zr as internal standard. Pb is correlated to Si and its concentration is crater diameter independent. However, the Pb concentration is underestimated by approx. 30 % when using Si as internal standard. These two independent sources of fractionation dominantly occurring in zircons prohibit the use of NIST 610 as non-matrix matched calibration material for accurate Pb/U age determinations. However, the literature contains some indications where accurate ages have been achieved when using NIST 610 as external standard.1,6 The age determined based on the 206Pb/238U concentration ratios for the 40 µm crater supports these statements. The agreement in the determined age in comparison to the reference value at this crater diameter is based on the fact that both sources of fractionation become equal. The crossing point of the two fractionation processes depends on the ablation conditions (fluence, pulse length, laser wavelength and repetition rate) as well as the material properties (absorption and density) and is therefore not predictable.Outlook
The use of non-matrix matched calibration for geochronology is not possible using ns-laser ablation. However, since the loss of Pb is almost constant and proportional to the ablated mass of Si and the U loss (strongly correlated to Zr) depends on the inner crater surface to ablated mass ratio, some improvements in age determination using matrix-matched calibration using reference zircons are possible. In case of a difference in the absorption behaviour of the standard zircon to the zircon of interest (e.g. high Rare Earth Element concentrations) the depth of crater for a constant period of ablation will be different for the two zircons. This change in the depth will most significantly influence the inner crater surface to ablated mass ratio and therefore most likely the U only. The Pb loss seems to be unavoidable, almost constant and proportional to Si. Therefore, a Pb/U normalization to the matrix elements Si/Zr could provide a better standardization scheme to correct for differences in the ablation between different zircons and might provide more accurate ages as experimentally shown by Jackson.22Acknowledgements
The study was financially supported by SNF and ETH Zurich. The authors would like to thank I. Kroslakova for the assistance with the particle size measurements as well as for the particle size data of NIST 610 acquired with the 193 nm excimer laser. The zircon displayed in the entry was provided by GRS Lucerne A. Peretti. DG would like to thank H. Longerich, S. Jackson, I. Horn and J. Kosler for many fruitful discussions over the last decade.References
- X.-h. Li, X.-r. Liang, M. Sun, H. Guan and J. G. Malpas, Chem. Geol., 2001, 175, 209–219 CrossRef CAS.
- M. Tiepolo, Chemical Geology, 2003, 199, 159–177 CAS.
- T. Hirata and R. W. Nesbitt, Geochim. Cosmochim. Acta, 1995, 59, 2491–2500 CrossRef CAS.
- I. Horn, R. L. Rudnick and W. F. McDonough, Chem. Geol., 2000, 164, 281–301 CrossRef CAS.
- L. P. Black, S. L. Kamo, C. M. Allen, D. W. Davis, J. N. Aleinikoff, J. W. Valley, R. Mundil, I. H. Campbell, R. J. Korsch, I. S. Williams and C. Foudoulis, Chem. Geol., 2004, 205, 115–140 CrossRef CAS.
- H. Yuan, S. Gao, X. Liu, H. Li, D. Günther and F. Wu, Geostand. Geoanal. Res., 2004, 28, 353–370 CrossRef CAS.
- J. Kosler, H. Fonneland, P. Sylvester, M. Tubrett and R.-B. Pedersen, Chem. Geol., 2002, 182, 605–618 CrossRef CAS.
- A. Simonetti, L. M. Heaman, R. P. Hartlaub, R. A. Creaser, T. G. MacHattie and C. Böhm, J. Anal. At. Spectrom., 2005, 20, 677–686 RSC.
- M. Tiepolo, P. Bottazzi, M. Palenzona and R. Vannucci, Can. Mineral., 2003, 41, 259–272 CrossRef CAS.
- J. Kosler, M. Wiedenbeck, R. Wirth, J. Hovorka, P. Sylvester and J. Míkovà, J. Anal. At. Spectrom., 2005, 20, 402–409 RSC.
- S. E. Jackson, in Laser ablation ICP-MS in the Earth Sciences: Current practises and outstanding issues., ed. P. Sylvester, Mineralogical Association of Canada, Vancouver BC, Editon edn., 2008, vol. 40, pp. 169–188 Search PubMed.
- D. Günther, R. Frischknecht, C. A. Heinrich and H.-J. Kahlert, J. Anal. At. Spectrom., 1997, 12, 939–944 RSC.
- H. P. Longerich, D. Günther and S. E. Jackson, Fresenius Journal of Analytical Chemistry, 1996, 355, 538–542 Search PubMed.
- M. Wiedenbeck, J. M. Hanchar, W. H. Peck, P. Sylvester, J. Valley, M. Whitehouse, A. Kronz, Y. Morishita, L. Nasdala, J. Fiebig, I. Franchi, J.-P. Girard, R. C. Greenwood, R. Hinton, N. Kita, P. R. D. Mason, M. Norman, M. Ogasawara, P. M. Piccoli, D. Rhede, H. Satoh, B. Schulz-Dobrick, O. Skar, M. J. Spicuzza, K. Terada, A. Tindle, S. Togashi, T. Vennemann, Q. Xie and Y.-F. Zheng, Geostand. Geoanal. Res., 2004, 28, 9–39 CrossRef CAS.
- S. M. Eggins and J. M. G. Shelley, Geostand. Geoanal. Res., 2002, 26, 269–286 CAS.
- H.-R. Kuhn, M. Guillong and D. Günther, Anal. Bioanal. Chem., 2004, 378, 1069–1074 CrossRef CAS.
- A. J. G. Mank and P. R. D. Mason, J. Anal. At. Spectrom., 1999, 14, 1143–1153 RSC.
- M. Wiedenbeck, P. Allé, F. Corfu, W. L. Griffin, M. Meier, F. Oberli, A. von Quadt, J. C. Roddick and W. Spiegel, Geostand. Geoanal. Res., 1995, 19, 1–23 CrossRef CAS.
- R. J. Finch and J. M. Hanchar, in Zircon, eds. J. M. Hanchar and P. W. O. Hoskin, Mineralogical Society of Americal, Geochemical Society, Washington, DC, Editon edn., 2003, vol. 53, pp. 1–25 Search PubMed.
- D. R. Lide, Handbook of Chemistry and Physics, 84 edn., Crc Press LLC, Boca Raton, London, New York, Washington DC, 2003 Search PubMed.
- P. Arrowsmith and S. K. Hughes, Appl. Spectrosc., 1988, 42, 1231–1239 CAS.
- S. E. Jackson, Geochimica et Cosmochimica Acta, 2009, 73, A579.
| This journal is © The Royal Society of Chemistry 2010 |
