3D-reconstruction of an object by means of a confocal micro-PIXE
Matjaž
Žitnik
*a,
Nataša
Grlj
a,
Primož
Vaupetič
a,
Primož
Pelicon
a,
Klemen
Bučar
a,
Dimosthenis
Sokaras
b,
Andreas Germanos
Karydas
b and
Birgit
Kanngießer
c
aJožef Stefan Institute, P.O. Box 3000, SI-1001, Ljubljana, Slovenia. E-mail: matjaz.zitnik@ijs.si; Fax: +386 1 5885255; Tel: +386 1 5885374
bInstitute of Nuclear Physics, NCSR Demokritos, Athens, Greece
cInstitute for Optics and Atomic Physics, Technical University of Berlin, Hardenbergstrasse 36, 10623, Berlin, Germany
First published on 15th October 2009
Abstract
We recorded a series of spectral maps of a hematite particle by combining a scanning proton microbeam excitation with detection of X-rays by a Si(Li) spectrometer equipped with polycapillary lens. The particle was driven through the sensitive microvolume to allow for a reconstruction of concentration in three dimensions. Beside the description of the experiment, important aspects of data analysis are emphasized to show the potential of the confocal micro-PIXE (Proton Induced X-ray Emission) imaging method: at present, this is limited by the focusing properties of the polycapillary lens.
1 Introduction
Many analytical problems involve characterization (imaging) of submillimeter objects with good spatial and chemical sensitivity. Despite years of instrumentation development, there is not a single method that would guarantee a micron spatial resolution in all three dimensions (3D) together with a full elemental sensitivity. While microscope electron beams, as well as soft X-rays emitted by light atoms lack the penetrating power, imaging with hard X-rays is difficult due to the absence of efficient X-ray lenses. Moreover, the reliability of reconstruction crucially depends on the selfabsorption (or energy loss) within an object whose complete knowledge could only emerge from full and reliable reconstruction itself.An established imaging method that does not use any lens is the so-called micro computer tomography (µCT). The reconstruction of an object in three dimensions is performed by using a point X-ray source whose diverging beams are captured by a CCD camera after passing through an object. The approach was recently demonstrated by Ishii et al.1 with an X-ray point source (0.6 × 0.6 µm2) provided by a 3 MeV focused proton microbeam hitting a thin Ti foil. A series of enlarged images of an ant's head were acquired for different rotation angles of an object and from the sequence of X-ray maps, a 3D-image was reconstructed with a spatial resolution of 4 µm. Although the cross sectional field of view was relatively large (0.5 × 0.5 mm2), the target elemental distribution could only be indirectly accessed on account of the fact that the absorption coefficient for Ti X-rays strongly depends on the atomic number Z — the contribution of heavier elements was emphasized. In a more common situation, around 60 keV X-rays are employed and images mainly reflect the density distribution within an object.
Alternatively, 3D-imaging with automatic elemental recognition can be performed by observing X-rays emitted by an object. In the so-called confocal setup, the object is driven through the sensitive microvolume formed by an intersection of the focused X-ray beam (usually a synchrotron beam) and the X-ray spectrometer field of view restricted by a polycapillary lens. At each position of an object, an X-ray spectrum is recorded and from the whole series of spectra a 3D-elemental image of the sample is reconstructed. A version of the method with a spatial resolution in the tens of micrometers uses another X-ray polycapillary to focus the incoming photon beam; the 3D Micro-XRF method is being developed since 20032,3 and has evolved into an analytical tool for quantitative in-depth analysis.4 Recently, a resolution of about 20 µm was achieved in all three dimensions in the analysis of a biological specimen under cryogenic conditions.5
In practice, the polycapillary field of view usually sets the limits on spatial resolution. The latter can be still improved by further focusing an intense X-ray probing beam; a microfocus can be formed, for example, by Kirkpatrick-Baez system of mirrors, Fresnel plates or compound refractive lenses.6–8 For up to about a hundred micrometers large objects, a three dimensional elemental distribution may be obtained by a fluorescence tomography, where the sample is rotated/translated through the microbeam and, at each position, the attenuation of the primary photon/ion flux is recorded together with the emitted X-ray spectrum.9–11 By application of elaborated reconstruction algorithms on the acquired data, a spatial resolution of the order of 1 µm is achieved. Generally, these techniques rely on the measurements of the transmitted flux, which may represent a problem for samples extended in at least one dimension. For relatively high photon excitation energy, it was shown that an attenuation coefficient can be estimated self consistently employing solely the X-ray emission data.12
Target emission may be excited by protons where one can rely on an excellent scanning possibility of the microbeam. Microfocusing and the movement of the proton beam in the lateral plane is controlled by a magnetic lens13 and partially reduces the need for target movement when a confocal setup is used. A demonstration of the confocal µ-PIXE approach was first shown on a series of thin foils and on a multilayered sample14 and was followed by a discussion of general concepts of quantitative analysis for layered materials15 and efficiency of the method.16 It was shown that for small (micro) emitters, like sparse aerosol particles captured in a thick quartz filter, particle position can be determined with a micron precision, gathering at the same time the information about its elemental composition.17,18 What still awaits a demonstration is a truly 3D composition analysis of an extended object where energy loss and selfabsorption effects cannot be neglected. Below, we report an attempt to reconstruct in 3D an irregular particle (agglomerate) composed of a hematite dust.
2 Experiment
The confocal µ-PIXE experiment is set up in a vacuum chamber equipped with a five-axis goniometer for sample positioning. The target is observed by two X-ray spectrometers, a high purity germanium (HPGe) spectrometer and a Si(Li) spectrometer (Fig. 1). The axis of the first one is positioned at an angle of β = 45° with respect to the proton beam direction, while the second one is placed on the opposite side of the beam in the same horizontal plane at an angle of α = 55°. On the snout of the Si(Li) spectrometer with an active area of 10 mm2 (8 µm Be window, 165 eV FWHM energy resolution at 5.9 keV), a polycapillary half-lens is mounted. The lens aims toward the sample holder in the center of the chamber which is also observed by the HPGe spectrometer (25 µm Be window, 170 eV energy resolution, 100 µm Kapton foil attenuator).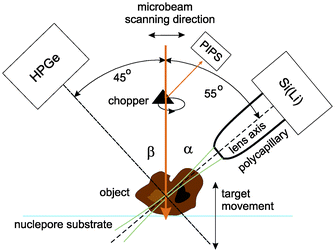 | ||
| Fig. 1 The confocal PIXE experimental set-up. | ||
The beam current density of 3 MeV protons in the xy plane perpendicular to the microbeam axis is well described by a product of two Gaussians. The corresponding FWHM in the horizontal and vertical direction is about 1.5 µm in the beam focal point and spreads out proportionally to reach 3 µm at the distance of ±450 µm.14 The confocal set up was realized first by a coarse alignment of the spectrometers to 0.5 mm, using a mechanical pointer on the snout of the Si(Li) to replicate the lens. A fine alignment to better than 20 µm was achieved by scanning a microbeam over the surface area of a 2 µm thick Fe foil and recording the X-ray yield of Fe Kα by the Si(Li) spectrometer with the lens mounted. The two focal points (of the beam and of the lens) were finally brought together at certain position of the foil along the microbeam, where the foil image size on the X-ray map was the smallest. According to the measured minimal image size, the field of view for Fe Kα rays (6.4 keV) close to the focal point of the lens is well described by an axially symmetric Gaussian with σ = 12 µm. The focal point was located at approximately 4.0 mm from the half-lens tip. As shown,18 a small broadening of the field of view on the either side of the focal point can be neglected for movements of the order of 100 µm.
To normalize X-ray images taken at different times, the proton dose must be known. The dose is inferred from the peak area in a Rutherford backscattering spectrum pertaining to protons which are backscattered from gold. Au is deposited on the surface of the graphite chopper which intersects the proton beam with a 10 Hz frequency. The proton dose maps are generated by a partially depleted silicon detector (PIPS, Canberra) and recorded simultaneously with X-ray images.
The object for imaging was prepared from fine fraction of an iron ore, composed mainly of hematite (97%), by pumping an air stream loaded with fine hematite particles through the Nuclepore substrate with a 0.4 µm pore size. After sampling, the substrate was mounted onto a target holder and inspected by an optical microscope. While sitting on the substrate, the selected particle was driven through the sensitive microvolume in a direction parallel to the proton microbeam (Fig. 1). In order to determine local hematite concentrations, an X-ray spectral map was recorded simultaneously by the Si(Li) and HPGe spectrometers at each of 13 equidistant positions separated by 10 µm. The lateral area covered by the scanning microbeam was 100 × 100 µm2 (Fig. 2). At about 100 pA of proton current, the accumulation time for a single X-ray map was 20 min approximately.
 | ||
| Fig. 2 X-ray polycapillary maps recorded at 3 (out of 13) different longitudinal positions Zi of an object. | ||
3 3D-reconstruction
The reconstruction of 3D particle images starts by a division of the space into unit cells. Each cell is assumed to hold a constant relative concentration n of Fe2O3 and it is the value of n for each unit cell which is to be determined in course of the data analysis. When n = 1, the cell is fully occupied by hematite while n = 0 means there is no hematite at all inside the cell. There is not any well defined flat surface involved in the problem since particle sticks on the “invisible” nuclepore filter in an arbitrary orientation. The analysis becomes the simplest when we accept the space division suggested by the experimental set-up itself (Fig. 3). The unit cells have then the form of a parallelepiped with sides Δx/cos α × Δy × Δz. The first index (l) counts unit cells along the direction of the X-ray spectrometer, the second index (m) measures the vertical position and the third index (j) counts the cells into depth, i.e. along the microbeam direction. While the horizontal and vertical dimensions of the unit cell are determined by the area Δx × Δy of the spectral map, which is large enough to contain statistically reasonable number of counts, the projection of the basic cell depth Δz sin α onto the direction perpendicular to the spectrometer axis should not be too large or too small in comparison to the σ parameter of the polycapillary transmission function. In the first case, the division is too coarse — it may not be possible to reproduce the sharpest wiggles in the measured yield and, in the second case, it may not be possible to assign cell concentrations uniquely to the measured Zi sequence of data since the polycapillary signal is lacking the resolving power. In our case we choose Δx = Δy = 2 µm and Δz = 10 µm. Due to simplicity (and opposite to the experimental realisation), we will assume that the particle is at rest and the detector moves in parallel to the microbeam axis with a Δz step size. To each of the 13 steps corresponds a single X-ray map with 51 × 51 pixels obtained after 5 × 5 binning of the actually measured map. The yield Ilm at pixel lm of the spectral map recorded at given position Zi = iΔz (0 ≤ i ≤ 12) of the spectrometer along the microbeam direction is given by | (1) |
 | (2) |
| Elmj = Elmj–1 − S(Elmj−1)nlmj−1Δz, j = 1, 2, 3… | (3) |
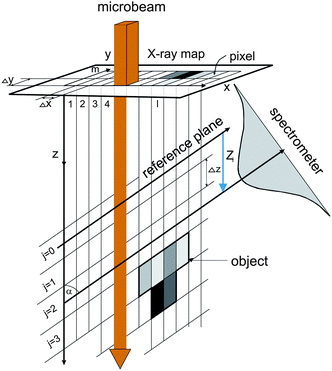 | ||
| Fig. 3 Schematic situation of pixels and cells. | ||
As already implied by Eq. (1), the entrance of the polycapillary lens lies in the horizontal plane defined by the microbeam direction and pixel row (denoted by index m), so the reconstruction proceeds by solving the set of above equations for each of horizontal particle slices independently. In fact, the slices are coupled only through parameter M0 and an overall scaling factor N which can be reasonably well estimated, as shown below. A single horizontal slice problem, defined by a fixed value of index m and running indices l and j, is solved sequentially; first, the concentrations are found for the column (denoted by indices m and l and running index j) which is the closest to the Si(Li) spectrometer side, because the signal of this column cannot be modulated by selfabsorption of neighboring columns situated even closer to the spectrometer. The extracted concentrations of unit cells in the closest column are then used as parameters entering the selfabsorption correction when seeking the solution for the second closest column, i.e., the procedure is repeated until the last column concentrations are obtained (the “last” column is the first non-empty column in the same horizontal slice on the opposite side of Si(Li) spectrometer). Finally, we have to deal only with a single lm column problem, since proton energy loss is governed only by hematite concentrations in the same column when the X-ray yield is collected at lm pixel (Fig. 3). The initial approximation for the column fitting problem is readily obtained from an “ordinary” µ-PIXE spectral map, recorded simultaneously with the HPGe spectrometer; only those columns are initialized (taken non-empty) for which the lm pixel in the ordinary map contains a nonzero signal. Besides knowing which columns are non-empty, the n values for each unit cell in the column have to be initialized. Reasonably good initial estimates are obtained from Zi series of Fe Kα X-ray yields detected at a given lm pixel. The Zi series should be inspected for some non-empty columns on the far side of the HPGe spectrometer, which could be omitted because they appear too weak in the ordinary µ-PIXE spectral map due to the selfabsorption.
A typical example of fitting the formulas (1,2,3) to experimental data under a single pixel (l = 39, m = 16) is presented in Fig. 4. In this particular case, 9 cell concentrations enter the fit as free parameters while the remaining 4 cell concentrations are fixed to zero, as suggested by the Zi dependence of the pixel signal. As mentioned above, the predetermined concentrations in columns with larger l (these are closer to the Si(Li) spectrometer) are also involved into the fitting problem as fixed parameters: in this particular case, this is only one column (l = 40, m = 16) with 13 cell concentration values. Each step of the search for “the best” column concentration set by χ2 minimization involves calculation of proton energies according to Eq. (3). An overall scaling factor N has the same value for all pixels and is determined so that the maximum n does not surpass 1 in any of the unit cells and the vertical offset M0 = 20 was found to describe well the vertical position of the lens axis in the lateral plane. One sees in Fig. 4 that a single cell filled with hematite (n = 1) does not reproduce satisfactory the measured pixel yield sequence and that a more adequate description of the data is obtained by combining 5 neighboring cells with nonzero hematite occupation ranging from 0.1 to 0.4.
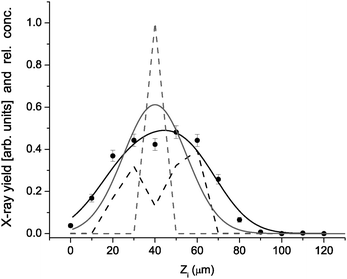 | ||
| Fig. 4 X-ray yield under pixel (39,16) versusZi (points) reproduced by model (black line) based on concentration distribution (dashed black). For comparison, the model result (gray line) for unit concentration in the cell centered at Zi = 40 µm (gray dash). | ||
As a main result of this work, the particle 3D-image is presented as a sequence of 21 horizontal slices which are 2 µm apart from each other (Fig. 5). The evolution of hematite concentration on vertically offset horizontal planes reveals an irregular shape of the particle and points to the regions with high hematite density. The particle appearance is sparse, most of the average unit cell concentrations are less than 1 indicating only a partial cell occupation. On the lowest slices, the particle appears as two separated, but fully in-depth evolved entities. The part on the right dominates at first, but at higher positioned slices the part on the left becomes the one with the highest hematite concentration. At the same time, we observe that the horizontally projected particle area changes from about 40 × 40 µm2 at m = 22 (44 µm) down to 15 × 15 µm2 at m = 31 (62 µm). This intricate change of the shape might be expected from an ordinary micro-PIXE map by correlating lateral particle extension with its depth. However, the present analysis allows to determine particle depth experimentally and characterizes an overall particle shape in much more detail.
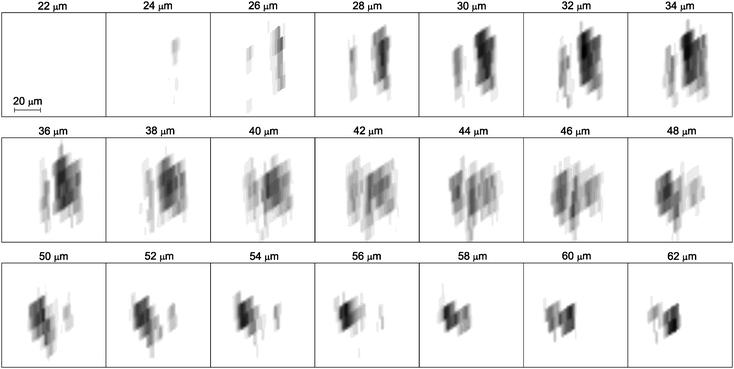 | ||
| Fig. 5 A sequence of the reconstructed horizontal slices xz in the particle region. The vertical distance between the two subsequent horizontal planes is 2 µm. The resolution is limited by the size of the unit cell and the hematite average cell concentrations are presented by the gray-level color function: black color corresponds to cell fully occupied by hematite (n = 1) and white color corresponds to an empty cell (n = 0). | ||
Finally, to test the reconstruction procedure, we generated an ordinary µ-PIXE map using reconstructed cell concentrations and compare it with an X-ray map simultaneously measured by the HPGe spectrometer. Since the HPGe spectrometer is positioned on the opposite side of the target, the space cell division used in course of the reconstruction is not an optimal choice for the estimation of the HPGe yield. To overcome this difficulty, the cells are first fragmented into much smaller cubes aligned to the orthogonal xyz axes and their nl′, m′, j′ concentrations are assigned to match by position the set of nlmj concentrations obtained by the reconstruction. Specifically, the cube side Δc = 1 µm is used and taking into account the value of angle β, the Fe Kα µ-PIXE yield at the HPGe spectrometer is proportional to
 | (4) |
The exponential damping of the Si(Li) signal in the vertical direction prevents the reconstruction over a whole µ-PIXE map region. Nevertheless, as seen in Fig. 6, using the reconstructed 3D-concentration distribution and after taking into account the proton energy loss and selfabsorption effects, the HPGe X-ray map is well reproduced.
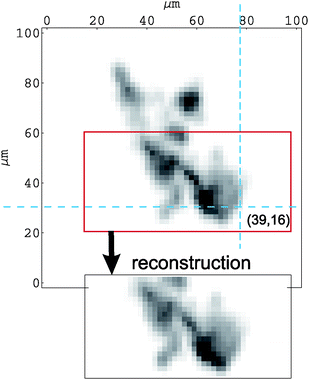 | ||
| Fig. 6 Comparison of the measured HPGe µ-PIXE map with the X-ray map generated from hematite concentrations reconstructed in 3 dimensions. The cross section of dashed lines marks the pixel presented in Fig. 4. | ||
4. Conclusions
We have reconstructed a 3D-distribution of hematite concentration in a 100 × 40 × 100 µm3 box by a single sweep of the particle through the sensitive volume of the confocal micro-PIXE set-up. While the lateral resolution is determined by the microbeam cross section (≈2 µm), the in-depth resolution is about 10 µm and is presently limited by the polycapillary field of view. Although the material of the object was known, the method (together with present instrumentation) could be effectively used for reconstruction of submillimeter objects containing a known share of light elements and an unknown share of “visible” elements (Z > 10). In that case, one has to deal with a set of Eq. (1,2,3) for each of the visible elements in the target and, for a given horizontal slice of an object, these sets are coupled though the concentrations of all elements entering the energy loss and photoabsorption terms. In this respect, it is extremely helpful to record a µ-PIXE map without any optics simultaneously with the Zi map sequence: besides identifying the elements which are present in the object, the data are useful to mark a region of interest, to monitor the time stability of the sample and to provide means for checking the reconstruction. Larger objects can be subjected to reconstruction as well, but this procedure would require more elaborate target movements.5.Acknowledgements
This work is supported by the research programme P1-0112 of the Slovenian Research Agency and by the FP7/REGPOT LIBRA project (Grant 230123).References
- K. Ishii, S. Matsuyama, Y. Watanabe, Y. Kawamura, T. Yamaguchi, R. Oyama, R. Momose, A. Ishizaki, H. Yamazaki and Y. Kikuchi, Nucl. Instrum. Methods Phys. Res., Sect. A, 2007, 571, 64 CrossRef CAS.
- B. Kanngießer, W. Maltzer and I. Reiche, Nucl. Instrum. Methods Phys. Res., Sect. B, 2003, 211, 259 CrossRef.
- A. R. Woll, J. Mass, C. Bisulca, R. Huang, D. H. Bilderback, S. Gruner and N. Gao, Appl. Phys. A: Mater. Sci. Process., 2006, 83, 235 CrossRef CAS.
- I. Mantouvalou, W. Malzer, I. Schaumnn, R. Dargel, Vogt and B. Kanngießer, Anal. Chem., 2008, 80, 819 CrossRef CAS.
- B. Kanngießer, W. Maltzer, M. Pagels, L. Lühl and G. Weseloh, Anal. Bioanal. Chem., 2007, 389, 1171 CrossRef.
- B. Golosio, A. Somogyi, A. Siminovici, P. Bleuet and J. Susini, Appl. Phys. Lett., 2004, 84, 2199 CrossRef CAS.
- B. X. Yang, Nucl. Instrum. Methods Phys. Res., Sect. A, 1993, 328, 578 CrossRef.
- A. Snigirev, V. Kohn, I. Snigireva and B. Langeler, Nature, 1996, 384, 49 CAS.
- B. Golosio, A. Simionovici, A. Somogyi, L. Lemelle, M. Chukalina and A. Brunetti, J. Appl. Phys., 2003, 94, 145 CrossRef CAS.
- A. Sakellariou, D. N. Jamieson and G. J. F. Legge, Nucl. Instrum. Methods Phys. Res., Sect. B, 2001, 181, 211 CrossRef CAS.
- B. Samber De, G. Silversmit, R. Evens, K. Schamphelaere De, C. Janssen, B. Masschaele, V. L. Hoorebeke, L. Balcaen, F. Vanhaecke, G. Falkenberg and L. Vincze, Anal. Bioanal. Chem., 2007, 390, 267.
- C. G. Schroer, Appl. Phys. Lett., 2001, 79, 1912 CrossRef CAS.
- J. Simčič, P. Pelicon, M. Budnar and Ž. Šmit, Nucl. Instrum. Methods Phys. Res., Sect. B, 2002, 190, 283 CrossRef.
- A. G. Karydas, D. Sokaras, C. Zarkadas, N. Grlj, P. Pelicon, M. Žitnik, R. Schütz, W. Malzer and B. Kanngießer, J. Anal. At. Spectrom., 2007, 22, 1260 RSC.
- D. Sokaras, A. G. Karydas, W. Malzer, R. Schütz, B. Kanngießer, N. Grlj, P. Pelicon and M. Žitnik, J. Anal. At. Spectrom., 2009, 24, 611 RSC.
- T. Wolff, I. Mantovalou, W. Malzer, J. Nissen, D. Berger, I. Zizak, D. Sokaras, A. G. Karydas, N. Grlj, P. Pelicon, R. Schütz, M. Žitnik and B. Kanngießer, J. Anal. At. Spectrom., 2009, 24, 669 RSC.
- M. Žitnik, P. Pelicon, N. Grlj, A. G. Karydas, D. Sokaras, R. Schütz and B. Kanngießer, Appl. Phys. Lett., 2008, 93, 094104 CrossRef.
- M. Žitnik, P. Pelicon, K. Bučar, N. Grlj, A. G. Karydas, D. Sokaras, R. Schütz and B. Kanngießer, X. Ray. Spectr., 2009 Search PubMed.
- B. L. Henke, E. M. Gullikson and D.J. C, At. Data Nucl. Data Tables, 1993, 54, 181 CrossRef CAS.
- J. F. Ziegler, M. D. Ziegler and J. P. Biersack, SRIM-The stopping and range of ions in matter, SRIM Co., 2006 Search PubMed.
| This journal is © The Royal Society of Chemistry 2010 |
