An investigation of the conductivity of peptide nanotube networks prepared by enzyme-triggered self-assembly†
Haixia
Xu
ae,
Apurba K.
Das
b,
Masaki
Horie
c,
Majeed S.
Shaik
ae,
Andrew M.
Smith
ae,
Yi
Luo
d,
Xiaofeng
Lu
d,
Richard
Collins
e,
Steven Y.
Liem
ce,
Aimin
Song
d,
Paul L. A.
Popelier
ce,
Michael L.
Turner
c,
Ping
Xiao
a,
Ian A.
Kinloch
*a and
Rein V.
Ulijn
*b
aSchool of Materials, The University of Manchester, Manchester, UK M1 7HS. E-mail: ian.kinloch@manchester.ac.uk
bWestCHEM/Department of Pure and Applied Chemistry, The University of Strathclyde, Glasgow, UK G1 1XL, UK. E-mail: Rein.Ulijn@strath.ac.uk; Tel: (+)44 0141 5482110
cSchool of Chemistry, The University of Manchester, Manchester, UK
dSchool of EEE, The University of Manchester, Manchester, UK
eManchester Interdisciplinary Biocentre, The University of Manchester, Manchester, UK
First published on 6th April 2010
Abstract
We demonstrate that nanotubular networks formed by enzyme-triggered self-assembly of Fmoc-L3 (9-fluorenylmethoxycarbonyl-tri-leucine) show significant charge transport. FT-IR, fluorescence spectroscopy and wide angle X-ray scattering (WAXS) data confirm formation of β-sheets that are locked together via π-stacking interactions. Molecular dynamics simulations confirmed the π–π stacking distance between fluorenyl groups to be 3.6–3.8 Å. Impedance spectroscopy demonstrated that the nanotubular xerogel networks possess minimum sheet resistances of 0.1 MΩ/sq in air and 500 MΩ/sq in vacuum (pressure: 1.03 mbar) at room temperature, with the conductivity scaling linearly with the mass of peptide in the network. These materials may provide a platform to interface biological components with electronics.
Introduction
Nanoscale conductive wires prepared by self-assembly of organic molecules with stacked aromatic rings, may have applications in next generation optical and (bio-) electronic devices.1–4 For effective charge transport aromatic moieties should be positioned to ensure effective π-orbital overlap. To achieve this, researchers have looked at biomolecular self-assembly, using DNA,5,6 porphyrins,7,8 viruses and peptides,9–14 for inspiration. In 1993 Ghadiri described peptide based nanotubes consisting of stacked cyclic D,L peptides (forming intermolecular β-sheets) and proposed that these may form the basis of conducting wires.10 In β-sheet based systems, the intermolecular distance between peptides is typically 4.7 Å, which is too large for efficient orbital overlap (3–4 Å).13,15 It was recently shown that this intermolecular distance could be reduced significantly when the exterior of the peptide nanotubes was decorated with pendant aromatic structures that tilt with respect to the peptide structures, allowing intermolecular electron delocalization.16 It was demonstrated recently that fibrous nanostructures formed by molecular self-assembly of β-sheet forming peptides modified with di-11 or penta-thiophene4 moieties showed inter-molecular electronic communication. In a separate development, it has been shown that the spectroscopic nature of a fluorenylmethoxycarbonyl (Fmoc) significantly altered within a self assembled fibrillar environment of β-sheet forming oligo-peptides.14 None of the above examples of peptide based electronic materials have been used directly to measure conductivity, instead relying on spectroscopy to infer charge transport.A relatively new class of peptide-based nanomaterials, aromatic peptide amphiphiles composed of short (between two and five amino acids) peptides with N-terminal aromatic groups17–21 (such as Fmoc), has not yet been explored as supramolecular wires. We recently proposed a novel supramolecular structure for this class of peptides composed of π–π interlocked β-sheets.20,21 In this π–β peptide configuration, H-bonding and aromatic interactions both contribute significantly, and, depending on the nature of the peptide, may inherently position N-linked aromatic fluorene ligands into a suitable position for close π cloud overlap as proposed previously for Fmoc-diphenylalanine.20
This observation prompted us to investigate the conductive properties of surface dried films (xerogels) of these materials as possible conductive networks. It is known that the chemical composition and the conditions used during self-assembly (e.g. concentration of self-assembly building blocks, solvent, temperature, pH) can significantly affect the nanostructure morphology and hence the conductivity of supramolecular structures.1,7,8,19,22,23 We and others have demonstrated enzyme-triggered self-assembly,18,21,23 a mild method that converts non-assembling precursors into self-assembly building blocks under constant conditions, which may allow for better control and reproducibility of the self-assembly process. In our previous work23 we observed that of the aromatic peptide amphiphiles tested, fluorenylmethoxycarbonyl-tri-leucine, Fmoc-L3, demonstrated most significant electron delocalization as inferred from fluorescence spectroscopy. Fmoc-L3 was selected for the current work. The aims of this work are (i) characterisation of xerogel networks formed via the enzyme-triggered self-assembly of Fmoc-L3, with emphasis on π–π stacking distance using molecular dynamics simulations and wide angle X-ray scattering (WAXS); and (ii) demonstrate conductivity and its relationship to network properties using impedance spectroscopy at ambient and vacuum conditions.
Experimental
Material preparation
Fmoc-L3-OMe was purchased from C S Bio Co., USA. Its purity was verified using high performance liquid chromatography (HPLC) and mass spectroscopy (MS) (>99%). Fmoc-L3 networks were prepared via hydrolysis of methyl ester using alcalase 2.4 L from Bacillus licheniformis. 40 μmol of Fmoc-L3-OMe was suspended in 2 ml of 0.1 M phosphate buffer at pH 8 in a glass vial. Alcalase 2.4 L (10 μl mL−1) (subtilisin ≥2.4 U g−1, Sigma P4860) was added with the suspension of Fmoc-peptide esters in phosphate buffer. The resulting solution was heated at 55 °C for 2 h and cooled to room temperature to produce gel-phase structures.FTIR spectroscopy
FTIR spectra were collected on a Perkin Elmer 2000 FTIR with the dried films pressed between crystal zinc selenium plates and scanned between over 60 scans at a resolution of 4 cm−1 and interval of 1 cm−1.Fluorescence spectroscopy
Fluorescence emission spectra of dried films were measured on a Jasco FP-6500 spectrofluorometer with light measured orthogonally to the excitation light, with excitation at 280 nm and emission data range between 300 and 500 nm.Transmission electron microscopy (TEM)
Carbon-coated copper grids (No. 400) were glow discharged for 30 s and placed shiny side down on the surface of a 10 μL diluted gel at 1 mmol L−1 for 10 s, and blotted. Washed grids were then place on a 10 μL 2% (w/v) uranyl acetate for 60 s and then blotted by filter paper. Data were recorded in a Tecnai 10 TEM operating at 100 KeV (calibrated magnification of × 43 600) onto Kodak SO-163 film.Cryogenic temperature transmission electron microscopy (cryo-TEM)
3 μL of 20 mM Fmoc-L3 hydrogel was dropped onto a holey carbon grid that was suspended on forceps in the humidity chamber of GATAN cryo-plunge unit. The grid was then blotted for a predetermined time to give a thin film of between 100–200 nm. After that, the grid was plunged into liquid ethane at temperatures below −170 °C and then transferred to a GATAN 626 cryo-holder (the temperatures below −170 °C) for examination. The sample was analyzed using JEOL 2100 TEM. Representative areas were photographed using a GATAN 4 K Ultrascan camera and Digital micrograph software.Atomic force microscopy (AFM)
Atomic force microscopic images were obtained using a VEECO CP-R Research AFM system. The peptide hydrogels were diluted to a final concentration of 1 mg mL−1 in deionized double-distilled water. AFM samples were prepared using 100 μL of 1.25 mg mL−1 peptide hydrogel solution on freshly cleaved mica for 60 s then blotted against filter paper. AFM studies were undertaken on peptide nanostructures adsorbed onto mica substrates and imaged in air in tapping mode.Surface mapping microscopy
Surface mapping microscopy was performed using ADE PHASE SHIFT - MicroXAM-100 to determine the film thickness by imaging across a scratch of approximately 50 μm width and 1 cm length.Impedance spectroscopy
The complex impedance of the dried networks were measured using a Solartron 1255 frequency response analyser over a frequency range of 0.1 to 107 Hz. Networks were formed by drying 100 μL of buffer solution containing between 20 to 400 nM of Fmoc-L3. Gold electrodes were then sputtered directly on top of dried networks through a shadow mask. The electrode spacing ranged from 1 mm to 3 mm, while the length of the electrodes was 12 mm. A two terminal set-up was used to measure the impedance. The sheet resistance, Rs, was calculated by R = Rsl/D where R is the resistance obtained from the intercept of the x-axis on a Z′–Z′′ plot, l is the distance between the electrodes and D is the width of the electrodes as shown in Fig. S2.† The variation in the conductivity between samples was found to be much greater than the measurement accuracy of R, l and D, due to the random nature of the network formation. Therefore the error in the conductivities was calculated by measuring the sheet resistance of three samples which had been prepared identically and taking the percentage error as the standard deviation in the Rs divided by the average Rs. This percentage error of 33% at ambient conditions and 41% under vacuum was then applied to all the other measurements. Overall ten separate samples were measured to obtain the percolation data.Wide angle X-ray scattering (WAXS)
WAXS analysis were performed using a Philips X'Pert diffractometer with a wavelength of 1.5406 Å. Fmoc-L3 gel and buffer solution were spread on two separate silica substrates as film and allowed to air dry prior to data collection.Molecular dynamics model
The all-atom AMBER/ff99SB24 force field is used for the peptide, whereas water is modeled by the TIP3P25 potential. MD simulations are carried out using periodic boundary conditions and a truncated octahedron simulation cell. Electrostatic interactions are calculated with the Ewald particle-mesh method. We use a cut-off of 8 Å for the real-space direct sum part of the Ewald sum and for the van der Waals interactions. The time integration step is set to 0.5 fs for simulations at 298 K temperature. The initial structures are equilibrated for at least 1 ns using restraints on all the atoms except hydrogen atoms. The simulations were carried out on the Fmoc-L3 16-mer for over 7 ns.The structural dimensions of the Fmoc-L3 in the aqueous solution (Fig. 5a) is examined by the distribution of shortest distances between the planes of the Fmoc rings and between the α-carbon atoms (CA, C1, and C2) in Fig. S1.† From the simulation run a snapshot of the system is taken for every 1000 steps (5 ps) and the Fmoc-L3 clusters in the snapshot are investigated for the above described distances. The average probability of the assembly is calculated for a range of distances between the Fmoc rings for the π–π stacking and between the alpha carbons between the β-sheets. This process is repeated for all the snapshots of an entire simulation run. The average distribution of these distances over the entire simulation run is shown in Fig. 5a.
Results and discussion
Characterization of Fmoc-L3 xerogel
Nanotubular networks of Fmoc-L3 were produced via enzyme-triggered self-assembly (Fig. 1a and b) whereby the non-assembling precursor, Fmoc-L3-OMe, is converted into the Fmoc-L3 upon subtilisin-catalysed hydrolysis of the methyl ester (80% yield by HPLC), leading to hydrogel formation as reported previously.23 The hydrogel was deposited onto a glass surface and dried to leave a xerogel consisting of a network of interwoven fibres (Fig. 2). Morphologically similar xerogels based on self-assembled networks have been described using organogels as the starting point.26 Previous spectroscopic studies on gel-phase Fmoc-L3,20,23 provided evidence of the formation of antiparallel β-sheet structures with Fmoc groups presented at alternating ends of each sheet, whereby multiple sheets locked together via the π-stacking of Fmoc groups, giving rise to nanotubes with π-stacked conductive paths along the length of the nanostructures (Fig. 1b).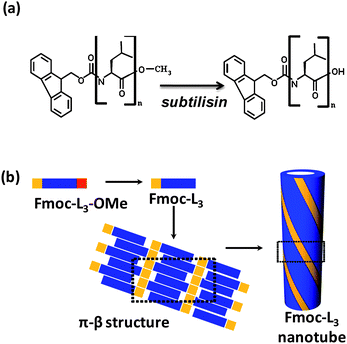 | ||
| Fig. 1 Fmoc-peptide building blocks, supramolecular structures: (a) enzymatic hydrolysis of fluorenylmethoxycarbonyl-L-leucine-L-leucine-L-leucine methyl ester (Fmoc-L3-OMe) to Fmoc-L3; (b) sequential scheme for self-assembly of nanotubes showing π–β structure. | ||
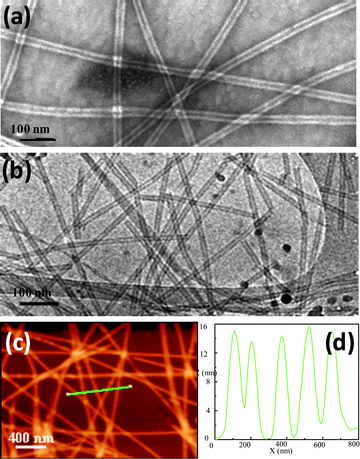 | ||
| Fig. 2 Transmission electron micrographs of the tubular structures formed and tapping-mode AFM analysis of peptide nanotubes on mica: (a) TEM image of Fmoc-L3 (sample was negatively stained with 2% uranyl acetate); (b) cryo-TEM micrograph of Fmoc-L3 hydrogel; (c) AFM image of Fmoc-L3; (d) height profile of the line shown in (c). | ||
FT-IR spectra of the Fmoc-L3 xerogel (Fig. 3a) showed two bands centered around 1636 cm−1 and 1690 cm−1, which indicates that antiparallel β-sheet structures are retained in the dried state, with the dried precursor showing spectra that indicate that peptides interact in a number of orientations with less molecular order. Fluorescence spectroscopy of the Fmoc-L3 gels suggested that electron delocalization is significant (Fig. 3b).14,23 The current self-assembly route involved a shorter exposure to enzyme at 55 °C (2 h instead of 4 h) giving rise to more pronounced emissions in the 420–460 nm range.
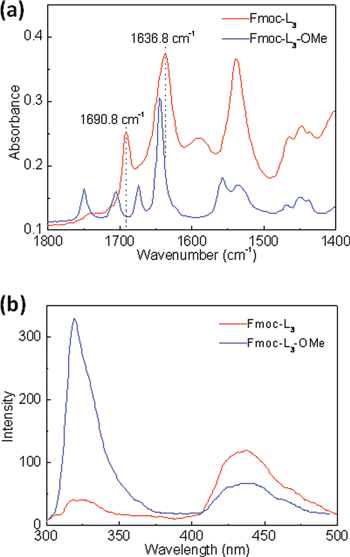 | ||
| Fig. 3 (a) FT-IR spectra of dried films of Fmoc-L3 gel prepared enzymatically and precursor Fmoc-L3-OMe dissolved in 5% acetone and 0.1 M phosphate buffer solution. The Fmoc-L3 dried film (top spectrum) shows a broad peak at around 1635–1646 cm−1 and a medium intensity band at 1685–1691 cm−1 which are consistent with the antiparallel β-sheet structure. The spectrum obtained from the Fmoc-L3-OMe precursor suggests that peptides interact in a number of orientations with less molecular order. (b) Fluorescence emission spectra of Fmoc-L3 gel prepared by enzymatic hydrolysis and Fmoc-L3-OMe solution. (50 μL acetone was used to dissolve Fmoc-L3-OMe, and then mixed with 0.1 M phosphate buffer at pH 8 to prepare 20 mM Fmoc-L3-OMe solution.) | ||
Morphology of the xerogel thin film
Fmoc-L3 nanostructures were analyzed by transmission electron microscopy (TEM) using 2% uranyl acetate as a negative stain, confirming formation of peptide nanotubes23 with inner diameter of around 9 nm and external diameter of around 24 nm, the dark centerline suggests the incorporation of the stain into the nanostructures interior (Fig. 2a). Cryogenic TEM analysis confirmed the presence of the hollow core with an inner diameter of around 7 nm and external diameter of approximately 16 nm (Fig. 2b). AFM analysis (Fig. 2c) showed the peptide nanotubes are straight and have a diameter of 15–16 nm (Fig. 2d), closely resembling the dimensions observed by Cryo-TEM. The cross section curves from AFM show sharp peaks, which indicated that the discrepancy between height (by AFM) and width (TEM) is most likely due to flattening of the tubes onto the surface during drying giving rise to larger diameter observed in TEM when compared to cryo-TEM.Molecular dynamics simulations
Structural features of Fmoc-L3 system in TIP3P water were analyzed by a MD simulation of over 7 ns. The Fmoc-L3 16-mer, after initial minimisation and equilibration, is shown in Fig. 4a and 4b.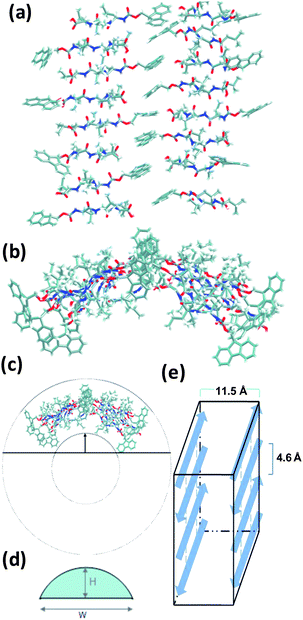 | ||
| Fig. 4 Structure of Fmoc-L3 16-mer in TIP3P water after initial minimisation and equilibration. The water molecules are omitted for clarity in the above figure: (a) front view, (b) top view schematic (not to scale) of a single molecular layer. (c) Top view schematic of a single Fmoc-L3 molecular layer nanotube, which was inferred from the part arc to a whole tube. (d) Schematic of calculation method of nanotube radius. (e) Schematic of layer inter-sheet model. | ||
Fig. 5a shows the distribution of β-sheet distances between the Fmoc-L3 molecules and π–π stacking distances between Fmoc residues. It is observed from Fig. 5a that there is a strong possibility of β-sheet formation at around 4.7 Å between the Fmoc-L3 molecules and of π–π stacking at around 3.6 Å between Fmoc residues. The predicted distances are in good agreement with the experimentally analysis using wide angle X-ray scattering (WAXS). Fig. 5b shows the distances obtained from the WAXS. It is suggested in the WAXS analysis that the β-sheet is formed at 4.6 Å27 and π–π stacking at 3.8 Å from the nanostructures instead of buffer salts. The distances obtained from the MD simulations are close to the experimental vales. It may seem counterintuitive that these molecules assemble in this way as the proposed model leads to the positioning of the polar COOH group in the unpolar environment where π-stacking takes place. We have previously demonstrated for a closely related aromatic peptide amphiphile, Fmoc-FF,28 that very large pKa shifts (of up to 6 pH units) are observed upon self-assembly which provides direct evidence that the polar group is indeed in a highly hydrophobic environment. An additional reflection is observed at d = 11.5 Å, which is thought to correspond to the intersheet distance between two single layers of Fmoc-L3 molecules (Fig. 4e).29 It should be noted that this pronounced WAXS reflection suggests long range order and may suggest that additional interactions are important here. We are currently using a number of scattering techniques and further molecular dynamics simulations to gain further insights.
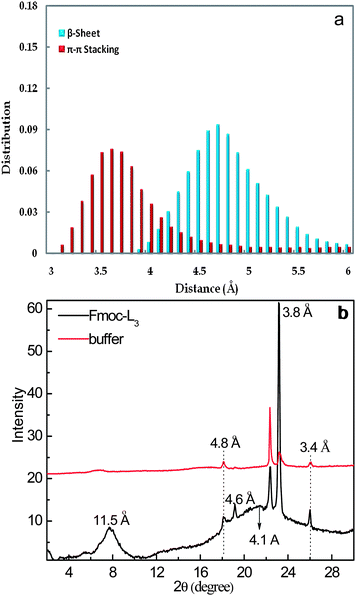 | ||
| Fig. 5 (a) Distribution of β-sheet distances between the Fmoc-L3 molecules and π–π stacking distances between Fmoc residues. (b) Wide angle X-ray scattering (WAXS) data of dried Fmoc-L3 (bottom line) and buffer (top line) on a silica surface. Peaks corresponding to the spacing of peptides within a β-sheet structure, pairs of fluorenyl groups, the spacing between π–π stacking and the intersheet distance between layers. The spectrum of the buffer is included for comparison. | ||
The wall thicknesses observed in TEM images (Fig. 3a and 3b) suggests that multi-layers are formed. A single molecular layer nanotube was inferred from the small arc (Fig. 4c). The radius of this monolayer nanotube can be calculated using:
 | (1) |
Conductivity of xerogel
Complex impedance spectroscopy plots were obtained to investigate the charge transport properties of the dried networks of the peptide nanostructures. Fig. 6a and c show the impedance characteristics of the Fmoc-L3 network with varying network density. In the complex impedance plot, the distance across the arc, which is obtained under AC bias conditions, is considered to correspond to the electric resistance of the sample.30 The slope observed at the low frequency end of the arc relates to mass transfer (Fig. 6a) and this slope nearly disappears under vacuum conditions (Fig. 6c). These results imply that the films show both electronic and ionic conductivity when impedance measurements were made in air, with the ionic conduction likely caused by the presence of ion containing water absorbed to the hydrophobic nanostructures. In vacuum, the low frequency ionic part of the curve is absent which suggests predominately electronic conductivity in the dried films under vacuum.31Fig. 7 and Fig. S3† show how the resistance of the samples increased as the vacuum was applied and the water was removed. | ||
| Fig. 6 Impedance spectroscopy measurements of the peptide networks as a function of amount of Fmoc-L3-OMe used to make the network under ambient conditions in air (a and b) and under vacuum (c and d). | ||
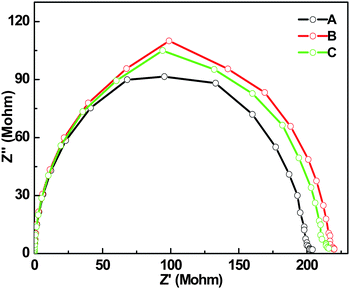 | ||
| Fig. 7 Complex impedance plot data (frequency ranged from 0.1 to 107 HZ) for Fmoc-L3 film at different times in vacuum. A—day 0, B—day 2, C—day 4. | ||
The resistance of the network showed small deviation over a time period of 4 days under vacuum conditions, with it increasing by 12%. Fig. 6b and d show the network resistance as a function of the amount of Fmoc-L3 present for ambient and under vacuum conditions respectively. The sheet resistance is used since it is difficult to accurately establish the sample thickness due to the porosity of the network. Surface mapping microscopy suggests that the thickest of the films were around 20 micron in height. The variation in the sheet resistance for the films at 400 μL should be noted. This variation is due to the random, statistical nature of the drying process and subsequent percolation, which leads to some variation from sample to sample.
The resistance of the blank glass substrate and dried Fmoc-L3-OMe buffer solution are also shown in Fig. 6 with their full impedance spectra shown in Fig. S4.† These resistances were at least two orders of magnitude higher than those found for the peptide nanotube networks. It is interesting to note that the conductivity of the Fmoc-L3-OMe sample drops to that of the blank slide upon drying in the vacuum suggesting that its conductivity in air was largely due to the ions in the buffer solution diffusing through the absorbed water. Furthermore, the Fmoc-L3-OMe film had significantly reduced conductivity compared to the Fmoc-L3 network, showing the importance of forming the supramolecular π–β nanotubular structure.
To exclude the role of enzyme in the conduction mechanism, Fmoc-peptide networks were also prepared by using a pH induced self-assembly of Fmoc-L3. It was found that the pH induced networks had a sheet resistance of 100 MΩ/sq in air and 810 MΩ/sq in vacuum, similar to the values found for the networks produced by enzyme induced self-assembly.
If the peptide networks acted as percolated films then the conductivity of the networks should scale with a power law to the amount of peptide present in the films, above the percolation threshold concentration at which the peptide nanotubes form a coherent network. It was found however, that the conductivity of the networks scaled linearly with amount of peptide, suggesting that at the concentrations used the nanotubes formed a coherent film.
Conclusions
We have demonstrated that π–β nanotubular networks formed by enzyme-triggered self-assembly of aromatic peptide amphiphiles show significant charge transport. Minimum sheet resistances of bulk peptides of 0.1 MΩ/sq in air and 500 MΩ/sq in vacuum at room temperature can be achieved. We provided evidence of the mechanism of charge transport for these systems, which is likely to involve electronic transport in vacuum, as well as charge transport through adsorbed moisture in air.32 We envisage that these new cost-effective nanomaterials may have applications in interfacing biology with electronic devices, e.g. in the context of biosensors, smart biomaterials and biologically inspired photovoltaic devices,33 and in the hydrogel state may, due to compatibility with 3D cell culture for similar structures,34 provide matrices for electronically induced cell differentiation.4Acknowledgements
We thank the EPSRC and The Leverhulme Trust for funding. H. Xu thanks John Walton from the University of Manchester for AFM assistance. H. Xu thanks Judith Shackleton, Gary Harrison and Paula Crook for their assistance with the WAXS and FTIR, Mr Stephen Furzeland and Mr Derek Atkins in Unilever for cryo-TEM help and Miss Fan Yang from the University of Manchester for helpful discussions on impedance spectra. Finally we thank the EPSRC-funded Materials Chemistry Consortium for a generous allocation of CPU time on HECToR.References
- Y. Yamamoto, T. Fukushina, N. Ishii, A. Saeki, S. Seki, S. Tagawa, M. Taniguchi, T. Kawai and T. Aida, Science, 2006, 314, 1761 CrossRef CAS.
- A. P. H. J. Schenning and E. W. Meijer, Chem. Commun., 2005, 3245 RSC.
- C. Daniel, F. Makereel, L. M. Herz, F. J. M. Hoeben, P. Jonkheijm, P. H. J. Schenning, E. W. Meijer, R. H. Friend and C. Silva, J. Chem. Phys., 2005, 123, 084902 CrossRef.
- D. A. Stone, L. Hsu and S. I. Stupp, Soft Matter, 2009, 5, 1990–1993 RSC.
- B. Q. Xu, P. M. Zhang, X. L. Li and N. J. Tao, Nano Lett., 2004, 4, 1105 CrossRef CAS.
- X. Guo, A. A. Gorodetsky, J. Hone, J. K. Barton and C. Nuckolls, Nat. Nanotechnol., 2008, 3, 163 CrossRef CAS.
- C. Li, J. Ly, B. Lei, W. Fan, D. Zhang, J. Han, M. Meyyappan, M. Thompson and C. Zhou, J. Phys. Chem. B, 2004, 108, 9646 CrossRef CAS.
- I. Yanov, Y. Kholod, J. Leszczynski and J. Palacios, Chem. Phys. Lett., 2007, 445, 238 CrossRef CAS.
- R. I. MacCuspie, N. L. S.-Y. Nuraje, A. Runge and H. Matsui, J. Am. Chem. Soc., 2008, 130(3), 887 CrossRef CAS.
- M. R. Ghadiri, J. R. Granja, R. A. Milligan, D. E. McRee and N. Khazanovich, Nature, 1993, 366, 324 CrossRef CAS.
- S. R. Diegelmann, J. M. Gorham and J. D. Tovar, J. Am. Chem. Soc., 2008, 130, 13840 CrossRef CAS.
- M. Yemini, M. Reches, J. Rishpon and E. Gazit, Nano Lett., 2005, 5, 183 CrossRef CAS.
- J. D. Hartgerink, J. R. Granja, R. A. Milligan and M. R. Ghadiri, J. Am. Chem. Soc., 1996, 118, 43 CrossRef CAS.
- K. J. Channon, G. L. Devlin, S. W. Magennis, C. E. Finlayson, A. K. Tickler, C. Silva and C. E. MacPhee, J. Am. Chem. Soc., 2008, 130(16), 5487 CrossRef CAS.
- R. Takahashi, H. Wang and J. P. Lewis, J. Phys. Chem. B, 2007, 111, 9093 CrossRef CAS.
- N. Ashkenasy, W. S. Horne and M. R. Ghadiri, Small, 2006, 2, 99 CrossRef CAS.
- Y. Zhang, H. Gu, Z. Yang and B. Xu, J. Am. Chem. Soc., 2003, 125, 13680 CrossRef CAS.
- Z. Yang, H. Gu, D. Fu, P. Gao, J. K. Lam and B. Xu, Adv. Mater., 2004, 16, 1440 CrossRef.
- D. J. Adams, M. F. Butler, W. J. Frith, M. Kirkland, L. Mullen and P. Sanderson, Soft Matter, 2009 10.1039/b901556f.
- A. M. Smith, R. J. Williams, C. Tang, P. Coppo, R. F. Collins, M. L. Turner, A. Saini and R. V. Ulijn, Adv. Mater., 2008, 20, 37 CrossRef.
- R. J. Williams, A. M. Smith, R. Collins, N. Hodson, A. K. Das and R. V. Ulijn, Nat. Nanotechnol., 2009, 4, 19 CrossRef CAS.
- T. Yamamoto, T. Fukushima, Y. Yamamoto, A. Kosaka, W. Jin, N. Ishii and T. Aida, J. Am. Chem. Soc., 2006, 128, 14337 CrossRef CAS.
- A. K. Das, R. F. Collins and R. V. Ulijn, Small, 2008, 4, 279 CrossRef CAS.
- V. Hornak, R. Abel, A. Okur, B. Strockbine, A. Roitberg and C. Simmerling, Proteins: Struct., Funct., Bioinf., 2006, 65, 712 Search PubMed.
- W. L. Jorgensen, J. Chandrasekhar, J. D. Madura, R. W. Impey and M. L. Klein, J. Chem. Phys., 1983, 79, 926 CrossRef CAS.
- J. Puigmarti-Luis, V. Laukhin, A. P. del Pino, J. Vidal-gancedo, C. Rovira, E. Laukhina and D. B. Amabilino, Angew. Chem., Int. Ed., 2007, 46, 238 CrossRef CAS.
- J. Naskar, G. Palui and A. Banerjee, J. Phys. Chem. B, 2009, 113, 11787, DOI:10.1021/jp904251j.
- C. Tang, A. M. Smith, R. F. Collins, R. V. Ulijn and A. Saiani, Langmuir, 2009, 25(16), 9447–9453 CrossRef CAS.
- U. F. Rohrig, A. Laio, N. Tantalo, M. Parrinello and R. Petronzio, Biophys. J., 2006, 91, 3217–3229 CrossRef CAS.
- J. R. Macdonald, Impedance spectroscopy, Emphasizing solid materials and systems, A Wiley-Interscience Publication, Printed in U.S.A., 1987, vol. 2 Search PubMed.
- J. R. S. Irvine, D. C. Sinclair and A. R. West, Adv. Mater., 1990, 2, 132 CrossRef CAS.
- L. L. del Mercato, P. P. Pompa, G. Maruccio, A. D. Torre, S. Sabella, A. M. Tamburro, R. Cingolani and R. Rinaldi, Proc. Natl. Acad. Sci. U. S. A., 2007, 104, 18019 CrossRef CAS.
- R. Das, P. J. Kelly, M. Segal, J. Norville, A. A. Yu, L. Y. Wang, S. A. Trammell, L. E. Reddick, R. Kumar, F. Stellacci, N. Lebedev, J. Schnur, B. D. Bruce, S. Zhang and M. Baldo, Nano Lett., 2004, 4, 1079 CrossRef CAS.
- M. Zhou, A. M. Smith, A. K. Das, N. W. Hodson, R. F. Colllins, R. V. Ulijn and J. E. Gough, Biomaterials, 2009, 30, 2523–2530 CrossRef CAS.
Footnote |
| † Electronic supplementary information (ESI) available: Fig. S1 to S4. See DOI: 10.1039/b9nr00233b |
| This journal is © The Royal Society of Chemistry 2010 |
