A 3D monolithic CNT block structure as a reductant, support and scavenger for nanoscopic gold, platinum and zinc oxide
Jayaprakash
Khanderi
,
Rudolf C.
Hoffmann
and
Jörg J.
Schneider
*
Fachbereich Chemie, Eduard-Zintl-Institut, Anorganische Chemie, Technische Universität Darmstadt, Petersenstraße 18, 64287 Darmstadt, Germany. E-mail: joerg.schneider@ac.chemie.tu-darmstadt.de; Fax: +49 6151 163470
First published on 3rd February 2010
Abstract
ZnO (8–10 nm), gold (10–50 nm), and platinum (2–5 nm) nanoparticles were deposited on monoliths of regularly arranged three-dimensional (3D) carbon nanotubes of 40 nm diameter and length up to 30 μm. The single-source precursor complex di-aqua-bis[2-(methoxyimino)propanato]2Zn(II) in dimethylformamide was used for the deposition of nanoparticulate ZnO on an ordered 3D CNT scaffold by solution-phase deposition at temperatures as low as 150 °C. Au and Pt nanoparticles were deposited by the spontaneous reduction of aqueous solutions of HAuCl4 and K2PtCl4 on the surface of the macroscopic 3D CNT scaffolds. X-Ray diffraction (XRD) and transmission electron microscopy (TEM) indicate the crystalline nature and nanosize structure of the deposited ZnO, Au and Pt nanoparticles. Scanning electron microscopy (SEM) and transmission electron microscopy (TEM) investigations revealed a dense and homogeneous decoration of the individual CNTs throughout the 3D CNT scaffold structure. Thus the nanovoids of the carbon scaffold structure are therefore completely accessible leading to a homogenous particle deposition on the complete CNT outer surface. The kinetics of the spontaneous reduction of gold(III) and platinum(II) ions on the CNTs of the scaffold was followed by UV–vis spectroscopy and indicate (i) first-order reaction kinetics with respect to Au3+ and Pt2+ concentration and (ii) that the rate of reduction of Au3+ is one order of magnitude slower than that of Pt2+.
1 Introduction
A very widely used template for the synthesis of highly ordered nanostructures is porous aluminium oxide (PAOX). It consists of a regular arrangement of one-dimensional pores in the nanometre size regime.1–4 Hence one-dimensional metal oxides,5–19 polymers,11 carbon nanotubes (CNTs)12 as well as metal rods, wires and tubes10,13 for use in solar cells, Li ion batteries and sensors as well for catalysis have already been derived as one-dimensional (1D) materials accessible via the PAOX-derived template-based technique.15–18 For example, CNTs have been synthesised using molecular precursors either by wet chemical techniques or by CVD processes inside PAOX templates.11,18,19 Recently it was shown that an ordered three-dimensional (3D) carbon nanotube monolith with macroscopic dimensions of up to several cm2 could be obtained by such a templated synthesis approach.20 This 3D carbon monolith, after being packaged in a polymer, can be used as a nano–micro integrated reactor device e.g. for the Pd-catalysed hydrogenation of p-chloro-nitrobenzene.20 The aligned CNTs in the block structure thus serve as high-surface-area materials which allow tethering of catalyst particles alongside the CNTs in the 3D array. In state-of-the-art microreactors for catalytic reactions, porous catalyst carriers or active catalysts have to be coated on carrier stripes either of which are then mountable within the channels of the microreactor.21 Using a metal- or metal-oxide-decorated 3D CNT monolith structure, such a hybrid CNT monolith could be directly placed inside the microchannels e.g. as a catalyst carrier thus drastically improving the inner surface of the microreactor compared to any other geometry realised so far.20,21In our previous studies towards the use of such a nano–micro-reactor setup employing a 3D CNT monolith, both the nature and mechanism which lead to the formation of active Pd nanoparticles on the surface of the CNTs in the CNT monolith remained open.20 It is well established that for several heterogeneous catalytic reactions a specific catalytic activity is closely related to the structural features of the catalyst particles (e.g. for Au).22 It is also known that ZnO when deposited on CNTs show an enhanced sensing behaviour towards CO as well as an enhanced catalytic hydrogenation behaviour when deposited together with gold nanoparticles on loosely packed disordered CNTs.23,24 Therefore such CNT/metal or CNT/ZnO composite structures on well aligned 3D CNT arrays are valuable candidates to test the nano–micro-reactor concept further. Especially interesting is the idea that a previously reported spontaneous reduction of Au3+ and Pt2+ on single-walled CNTs25 could be transferred to a 3D ordered array of multi-walled CNTs resulting in a continuous reduction and deposition of active catalyst particles on such a CNT block structure.
Herein we demonstrate the formation of hybrid composite materials consisting of ZnO or Au or Pt nanoparticles on a 3D CNT monolithic array structure. The reduction of Au(III) and Pt(II) to zerovalent nanoparticles is achieved on the surface of CNTs without the need of any additional reducing agent. The new ZnO/CNT3D, Au/CNT3D and Pt/CNT3D composites were fully characterised and the kinetics of the spontaneous reduction of Au and Pt ions leading to direct metal nanoparticle formation was followed spectroscopically.
2 Experimental
Preparation of a highly ordered 3D CNT monolith
Highly ordered carbon nanotube array monoliths were prepared by a template-assisted chemical vapour deposition (CVD) process. Porous aluminium oxide (PAOX) templates about 2 cm2 size, with pore diameters of approximately 40 nm (± 5 nm) were used.4 Ethylene (10 sccm) was used as carbon source and Ar (10 sccm) as a diluent carrier gas. The depositions were performed at a temperature of 800 °C for 20 min without the use of a catalyst. After the CVD process, the PAOX template was wet etched with HF to free the CNT array from the initial PAOX/CNT composite. This gave 3D monoliths with one-dimensionally arranged CNTs.Preparation of ZnO, Au and Pt/CNT3D nanocomposites
The precursors HAuCl4·4H2O (99.9%, Au 48.0%, Merck), K2PtCl4 (Pt 46.55%, Degussa AG) and solvent, DMF (Merck) were used as received. The synthesis of di-aqua-bis[2-(methoxyimino)propanoato]zinc(II), [CH3ONCCH3COO]2 Zn·2H2O (zinc oximato complex) 1 was carried out as described.26 ZnO/CNT3D composites were prepared by immersing a few monolithic CNT pieces in 20 ml of DMF containing the dissolved zinc oximato precursor complex 1 (2.5 mg and 20 mg) (maximum solubility of zinc oximate in DMF is 11 wt%) and allowing it to stand for several hours to ensure complete infiltration of the 3D CNT block structure. This was followed by heating the mixture to 150–160 °C for 3 h without stirring or any other agitation in order to keep the macroscopic CNT structure intact. The reaction mixture showed no sign of any ZnO precipitation. The CNT block structure was collected washed with ethanol and dried at 80 °C under ambient conditions. For the deposition of gold and platinum nanoparticles on the 3D CNT block structure, 2 mM solutions of either gold or platinum salts were prepared in purified Milli-Q water. The CNT monoliths were immersed in the solutions, which resulted in spontaneous reduction and immediate decolorization indicating deposition of the respective metal on the CNT structure. The 3D CNT blocks were left for a further ∼18 h in the respective salt solutions, and were then finally washed with ethanol and dried at 80 °C.Spectroscopic follow-up of Au3+ and Pt2+ reduction processes
The spontaneous reduction of gold and platinum salts were followed by preparing solutions of different concentrations (2, 1, 0.5, 0.25, 0.125 mM) of Pt2+ and Au3+ in UV cuvettes and placing the 3D CNT monoliths in these solutions. The solutions were stirred occasionally. Before each measurement the immersed CNT blocks were allowed to settle down at the bottom of the cuvettes. The decrease in Pt2+ and Au3+ concentrations were followed spectroscopically over defined time intervals by measuring the absorbance of the solutions using a UV–vis spectrometer.Characterization techniques
UV–vis measurements were performed with a Lambda 900 UV–vis–NIR spectrometer (Perkin Elmer). The measurements were done in an ethanol suspension of the ZnO/CNT3D composite against pure ethanol. Each sample was scanned in the range 280–800 nm. For the determination of the spontaneous reduction kinetics of gold and platinum ions, aqueous solutions were used during UV–vis studies. X-Ray powder diffraction experiments were performed using a STOE STADI/P powder diffractometer working in transmission mode. The used radiation was either Co Kα1 or Cu Kα1, selected by a curved Ge(111) monochromator. The diffraction patterns were measured in the 2θ range 3–50° and recorded using a linear position-sensitive detector with a step width of 0.02° (2θ). SEM investigations were performed with a Philips XL 30 FEG microscope at 20 keV. HRTEM investigations were carried out using an FEI Technai G2 F20 HRTEM at 200 kV. Samples were prepared in high-purity ethanol and suspensions were dripped on lacy-carbon copper grids.3 Results and discussion
Our studies were in part triggered by the observation that a spontaneous reduction of Au3+ and Pt2+ to nanoscale Au and Pt particles has been observed on unordered SWCNTs.25 Since the Fermi level of SWCNTs is well above the potential of the standard hydrogen electrode (SHE) as well as the reduction potentials of AuCl4− and PtCl42− these properties could be used to deposit gold and platinum on SWNTs by an electroless process.25 Therefore SWCNTs/Au3+ and SWCNTs/Pt2+ act as typical redox couples. We herein studied the deposition of these metals by such a process, however with higher diameter MWCNTs which are, in addition, spatially arranged over larger areas in order to understand if a similar reduction reaction (i) could work with MWCNTs and (ii) if complete solution infiltration of a 3D array CNT structure, having such narrowly spaced objects, is feasible and will result in a homogeneous decoration of the 3D CNT block structure with catalytic particles. These studies allow a better understanding of catalytically active MWCNT/metal composite structures with macroscopic size dimensions for which we have already shown applicability to a novel nano/microreactor concept.20 The work function Φ (eV)for MWCNTs is between 4.80 and 5.05 depending on the chirality and the number of layers of the MWCNT structure considered.27 This value of Φ for MWCNTs is significantly lower than for SWCNTs (Φ = 5.10 eV),28 but still well above the redox potentials for AuCl4− and PtCl42− which are 1.002 and 0.775 V vs. SHE respectively.29 Therefore such a spontaneous electron transfer with MWCNTs should be likely.Formation of ZnO nanoparticles and thin films as well as a nanocomposite by tethering such particles on the surface of disordered multi-walled CNTs (ZnO/MWCNTs) is possible from the molecular zinc oximato precursor 1.23,24,26 The so-formed nanoparticulate ZnO is photoactive and can even be used as substrate for the deposition of gold nanoparticles using UV light on the surface of MWCNTs.24 To extend these new concepts to highly ordered arrays of CNTs would certainly be an important step forward towards an integrated CNT device structure with a high application potential toward catalysis (Au, Pt) and sensing (ZnO).
Synthesis of the 3D CNT block structure
The 3D CNT materials with a nominal pore diameter of 40 nm were prepared using a catalyst-free CVD process.20 It is important to use such a catalyst-free process in order to ensure no additional metal catalyst at the tube ends or even metallic catalyst filaments inside or outside the CNTs, as this would make additional purification steps of the CNT material necessary in order to ensure clear information on how the MWCNTs interact with the appropriate precursors. The use of an uncatalyzed process will lead to CNTs with a certain number of defects due to the imperfect graphitisation process of the CNTs during the CVD process. This however is helpful for the follow-up fixation of nanoparticles on the exterior of the CNTs since such defect sites are the preferred coordination sites for functionalization. The block arrangements of the CNTs were prepared as described earlier by us for 200 nm diameter carbon tubes20 followed by complete etching of the template with HF. The obtained block arrangements with nominal pore diameters of now 40 nm (±5 nm) are composed of well aligned CNTs, and their length is determined by the thickness of the alumina template (Fig. 1). The multi-walled tubes are graphitised, however with a certain amount of disorder present as found by TEM (Fig. 2a–c). They are unhinged from the block structure by prolonged ultrasonication of the 3D CNT blocks. The graphitised areas of the isolated CNTs are restricted to relatively short areas, which are disrupted by defects in their graphitisation. The CVD process allows the formation of a stabilising, thin carbon top and bottom layer on the surface of the CNT block structure which stabilises the overall CNT structure. These layers shield the inner space of the 3D CNT from infiltration (Scheme 1). The complete intact CNT monolith block structure is used for the deposition of different precursors from which the corresponding nanoparticles are then formed either by a redox reaction (for Au, Pt) or by thermal decomposition (for ZnO) (Scheme 1). | ||
| Scheme 1 Schematic of the deposition process of Au and Pt or ZnO nanoparticles tethered to the surface of individual CNTs within the 3D CNT monolith (red spheres indicate schematically Au or Pt or ZnO nanoparticles). | ||
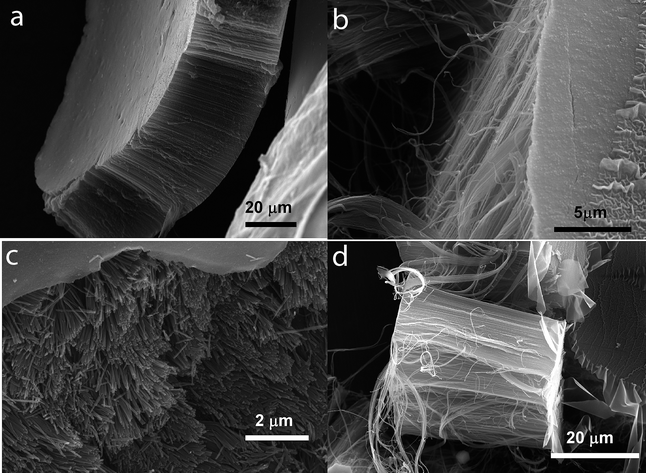 | ||
| Fig. 1 SEM micrographs showing the block arrangement of the CNTs. The nominal pore diameter of the CNTs is 40 ± 5 nm. Distance of the tubes is the same. (a) The complete block structure with top and bottom layers, (b) side-view showing the parallel arrangement of the CNTs in the block, (c) view on top of the CNTs with the top layer removed and (d) side-view of the complete CNT block structure. | ||
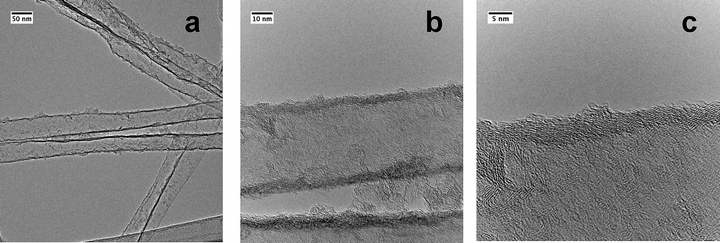 | ||
| Fig. 2 (a)–(c) TEM micrographs showing the graphitisation of individual CNTs within the 3D CNT host structure shown in Fig. 1 (obtained after unhinging CNTs from the block structure by ultrasonication). | ||
UV–vis and XRD studies of ZnO/CNT3D, Au/CNT3D and Pt ZnO/CNT3D nanocomposites
Initial studies using UV–vis spectroscopy on the new composite materials were performed on ethanolic suspensions of the ZnO/CNT3D, Au/CNT3D and Pt/CNT3D block nanocomposites (Fig. 3). They gave important initial information on their nanoparticulate character. Fig. 3a shows the absorption spectrum of the ZnO/CNT3D composite with a maximum at 361 nm which corresponds to a blue-shift of 15 ± 2 nm compared to bulk ZnO.30 This compares well to what is observed for ZnO particles (crystallite size of 8–9 nm) on commercial MWCNTs.25,26 The observed blue-shift might be due to the strong confinement effect reported to occur in ZnO particles of size well below 5 nm.26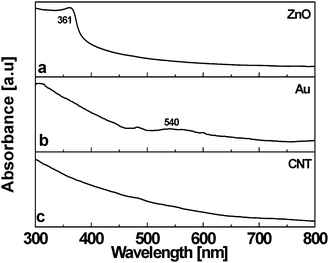 | ||
| Fig. 3 UV–vis absorption spectra of (a) ZnO/CNT3D and (b) Au/CNT3D nanocomposites, (c) shows the absorption characteristics of a virgin 3D CNT monolith structure. | ||
UV–vis analysis of the Au/CNT3D nanocomposite is indicated in trace b of Fig. 3. A broad absorption at 540 nm corresponds to the plasmon resonance of Au. For the Au/CNT3D composite the surface plasmon resonance absorption band at 525 nm (observed for colloidal gold) is shifted approximately 15 ± 2 nm towards higher wavelengths. This red-shift in the plasmon band may be attributed to interparticle interactions of the adsorbed Au particles on the surface of individual CNTs in the 3D block arrangement. This changes their local refractive index at the surface of the gold.31 A similar shift was observed for Au/MWCNT and Au/ZnO/MWCNT nanocomposite materials containing larger diameter CNTs.24 The Pt/CNT3D composite spectrum (not shown here) indicates no other characteristic absorptions except for the absorption bands of CNTs as they are observed for the Au/CNT3D composite too. A broad absorption starting at around 480 nm is observed for the bare 3D CNT block structure serving as the support structure for nanoscopic ZnO, Au and Pt (trace c of Fig. 3).
The results of XRD measurements on the ZnO/CNT3D, Au/CNT3D and Pt/CNT3D nanocomposites are shown in Fig. 4a–c. The ZnO nanoparticles tethered to the surface of the CNT block structure display a hexagonal structure [JCPDS card no. 89-1397]. Both gold and platinum nanoparticles attached to the 3D CNT structure show a cubic structure [corresponding JCPDS card nos. 4-784 and 4-802]. The individual reflexes for all tethered particles are broadened throughout indicating the nanoscale size of the particles formed. Analysing the diffraction patterns using the Debye–Scherer equation indicates an average nanoparticle size for ZnO ∼10 nm, for Au ∼43 nm and for Pt ∼5 nm. This finding is in very good agreement with the results obtained from the TEM analysis (vide infra, see following discussion). Due to the marginal graphitisation, diffraction peaks corresponding to the CNTs were not observed.
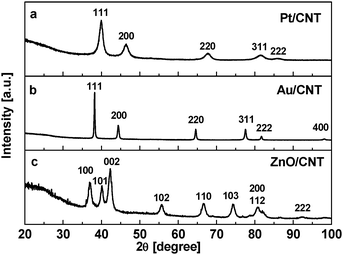 | ||
| Fig. 4 X-Ray powder diffraction pattern (Cu Kα) of (a) Pt/CNT3D, (b) Au/CNT3D and (c) (Co Kα) ZnO/CNT3D nanocomposites. | ||
ZnO/CNT3D nanocomposite
Scanning electron micrographs of the ZnO/CNT3D nanocomposite are shown in Fig. 5a–c. Fig. 5a and 5b show the ZnO nanoparticles tethered to the surface of individual CNTs of the regularly ordered 3D CNT blocks (precursor amount 2.5 mg). Fig. 5c displays a complete coverage of the CNTs with ZnO at high Zn–oximato precursor complex concentrations 1 (precursor amount 20 mg). The CNTs have been unhinged from the 3D CNT monolith for the sake of better visualisation especially for proving the even deposition of the nanoparticles on the CNT surface of individual tubes. SEM shows that the precursor 1 is indeed deposited intimately inside the 3D CNT monolith and has been decomposed to ZnO in the interstices between the tubes. However the ZnO particles are aggregated and the size of the particles varies between 25–100 nm. These aggregates consist of smaller ZnO particles of ∼10 nm in size.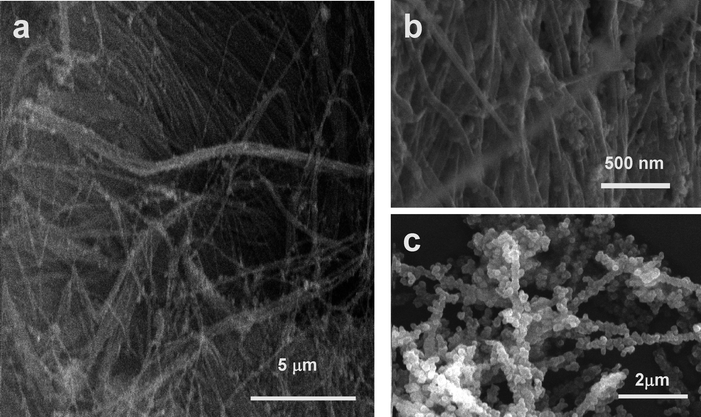 | ||
| Fig. 5 (a) and (b) SEM images of the ZnO/CNT3D nanocomposite showing the presence of well dispersed ZnO aggregates inside the 3D CNT monolith structure. (c) ZnO deposited at a higher precursor concentrations (precursor amount 20 mg) as compared to (a) and (b) showing a higher CNT loading as compared to (b). | ||
Transmission electron micrographs of the ZnO/CNT3D nanocomposite are shown in Fig. 6a–c. The TEM images show the presence of crystalline ZnO nanoparticles on individual CNTs with approximate particle size of 8–10 nm (Fig. 6a and 6b ). The magnified image of b shows that the ZnO particles are strongly bound to the CNTs. The crystalline nature of the ZnO is shown by the lattice fringes corresponding to [100] planes (Fig. 6c). The SAED pattern indicates discrete spots further confirming the crystalline nature of ZnO synthesised from precursor 1 inside the monolith structure.
![(a) and (b) TEM images of the ZnO/CNT3D nanocomposite depicting the presence of ZnO nanoparticles inside the CNT monolith at two different magnifications. (c) ZnO lattice fringe of the [100] plane, indicating the interface between ZnO and CNTs. Inset: SAED pattern of the ZnO/CNT3D nanocomposite (corresponding to the area shown in b).](/image/article/2010/NR/b9nr00332k/b9nr00332k-f6.gif) | ||
| Fig. 6 (a) and (b) TEM images of the ZnO/CNT3D nanocomposite depicting the presence of ZnO nanoparticles inside the CNT monolith at two different magnifications. (c) ZnO lattice fringe of the [100] plane, indicating the interface between ZnO and CNTs. Inset: SAED pattern of the ZnO/CNT3D nanocomposite (corresponding to the area shown in b). | ||
From the combined spectroscopic and microscopic studies it can be concluded that the bare 3D CNT block structure has a strong affinity for the mononuclear single source precursor 1 from which the ZnO is formed. This is shown experimentally by the observation that no reasonable ZnO precipitation in the reaction solution is observed during deposition. Consequently the conversion of 1 to ZnO and the deposition density of ZnO particles onto individual CNTs of the 3D block structure is high and leads to an efficient ZnO loading.
Au/CNT3D nanocomposite
Scanning electron micrographs of the Au/CNT3D nanocomposite are shown in Fig. 7. Gold particles deposited on the CNTs are in the size range ca. 50–100 nm and are found at the edges of the 3D CNT monolith (Fig. 7a). Interestingly the CNTs inside the block structure, from which they are unhinged, show a smaller particle size of approximately ∼10 nm (Fig. 7b). | ||
| Fig. 7 (a) and (b) SEM images of the Au/CNT3D nanocomposite at two different magnifications depicting the presence of Au nanoparticles at the outer edge and deeper inside the 3D CNT monolith composite structure. | ||
This can be explained by the fact that the spontaneous reduction process of the Au3+ ions at the edges of the CNT monolith is certainly more efficient and thus leads to the generation of more nucleation sites as compared to the reduction process deeper inside the CNT monolith. In addition there exists a higher continuous supply of fresh Au3+ precursor ions at the outer surface of the 3D CNT monolith as compared to the inside of the CNT monolith which results in size variations between the resulting Au nanoparticles outside and inside the 3D CNT block structure. In addition to that, Ostwald ripening of the initially formed smaller Au particles may also lead to an increase in particle size. This is certainly more pronounced on the outer surface of the 3D CNT monolith than inside the CNT structure due to a concentration gradient of the precursor solution outside and inside the monolith.
TEM micrographs of the Au/CNT3D nanocomposite structures obtained after unhinging Au decorated CNTs from the block structure by ultrasonication are shown in Fig. 8a and 8b. The deposited Au particles are spherical in shape and are agglomerated, mostly twinned. The diameters of individual nanoparticles in these agglomerates are ∼10 nm. The particle sizes of the Au-decorated CNTs as determined from SEM and TEM from inside the 3D monolith structure correspond well. In addition to the outer wall decoration of the CNTs, formation of Au nanoparticles and Au nanorods was observed occasionally. This is obviously due to infiltration of the Au3+ precursor into CNTs (see Fig. 8b). The length of these rods is 220–300 nm and they are 30–40 nm in diameter. Both the outer wall and inner wall of the tube thus have similar properties and behaviour with respect to the spontaneous reduction of Au3+ metal ions.
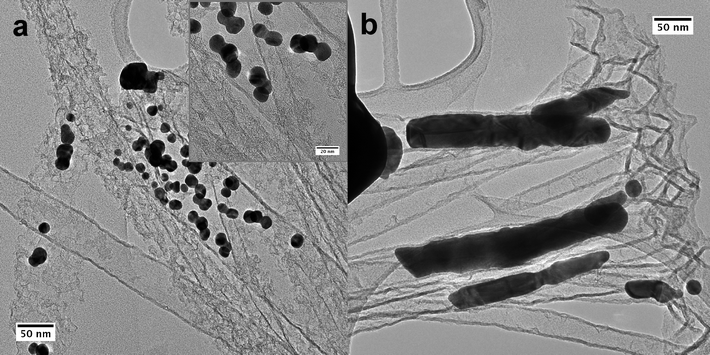 | ||
| Fig. 8 TEM micrographs of Au/CNT nanocomposite structures, debundled from a Au/CNT3D block structure by ultrasonication; (a) spherical gold nanoparticles on CNTs, inset: higher magnification of gold particles (twinned) together, (b) occasionally observed gold rods formed inside the confined space of the interior of the CNTs. | ||
Pt/CNT3D nanocomposite
TEM micrographs of isolated CNT/Pt nanocomposite structures obtained from the Pt/CNT3D nanocomposite are shown in Fig. 9. The Pt nanoparticles are homogeneously distributed and evenly sized in the range from 2–5 nm. Fig. 9b shows that there also exists agglomerated Pt particles in addition to individual ones. The SAED pattern (inset in Fig. 9a) confirms the crystalline nature of the deposited Pt particles. These results confirm that the Pt2+ precursor solution has sufficient access to the CNT block structure and can infiltrate its nanometre-sized voids homogeneously. This proves indeed for the first time a most complete occupancy of the Pt/CNT3D block structure with Pt nanoparticles as has been suspected earlier when using it as nanoreactor in a hetereogenous hydrogenation reaction.20 The difference in particle size for the Au deposition in comparison to the Pt particles is due to the larger redox potential of Pt2+/Pt0vs. Au3+/Au0 giving rise to the generation of more active sites allowing the growth of smaller Pt nanoparticles compared to Au nanoparticles. However, the Ostwald ripening of the Pt nuclei compared to Au is not as pronounced, thus showing only scattered areas of agglomerated Pt particles compared to the Au case. The formation of zero-dimensional (0D) particles or 1D rods within the CNT structure (Fig. 8 was only observed in the case of gold and not for ZnO and Pt. We attribute this to an accidental partial opening of the carbon layer of the 3D CNT block structure due to a mechanical breaking of the top layer during the infiltration process.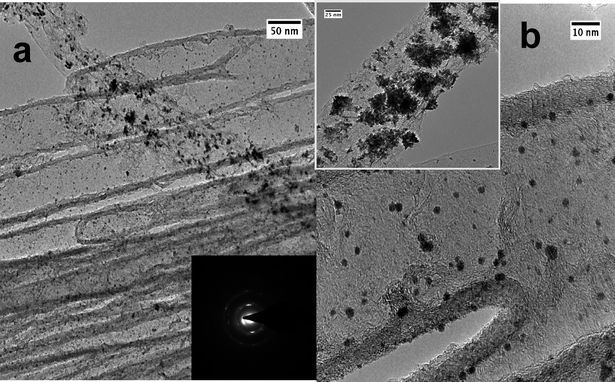 | ||
| Fig. 9 TEM micrographs of the Pt/CNT nanocomposite structures unhinged from Pt/CNT3D nanocomposite depicting particle size and particle distribution at different magnifications. Inset to (a) SAED pattern of Pt nanoparticles on CNTs (corresponding to the area shown in b), inset to (b) TEM image showing agglomerated Pt particles in addition to smaller ones. | ||
Kinetic studies of Au0 and Pt0 deposition
Based on the results of the similar behaviour of 3D CNT monolith blocks compared to SWCNTs with respect to their spontaneous reduction of noble transition metal ions, we studied, ex situ, the reduction process of noble metal ions in the presence of 3D monolithic CNT blocks in order to understand their reduction kinetics.The spontaneous reduction of Au3+ and Pt2+ was studied by UV–vis spectroscopy by measuring the change in absorbance of the respective noble metal salt solution after placing the 3D CNT monolith structure in the solution. Fig. 10 shows the decrease in the absorbance for Pt2+ (Fig. 10a) and Au3+ (Fig. 10b) metal ions for 2 mM and 0.25 mM concentrated solutions respectively. It was found that there is continuous decrease in the absorbance (hence concentration of metal ions) with time, indicating a strong infiltration tendency of Au3+ and Pt2+ ions into the 3D CNT monolith follows by their subsequent reduction. Similar studies were also carried out with silver nitrate (AgNO3) and copper chloride (CuCl2) solutions. However, there was no decrease in concentration of the both the Ag+ and Cu2+ ions with time. This is in accord with the knowledge that the redox couple for these metal ions (Ag+ and Cu2+) and CNTs do not match.
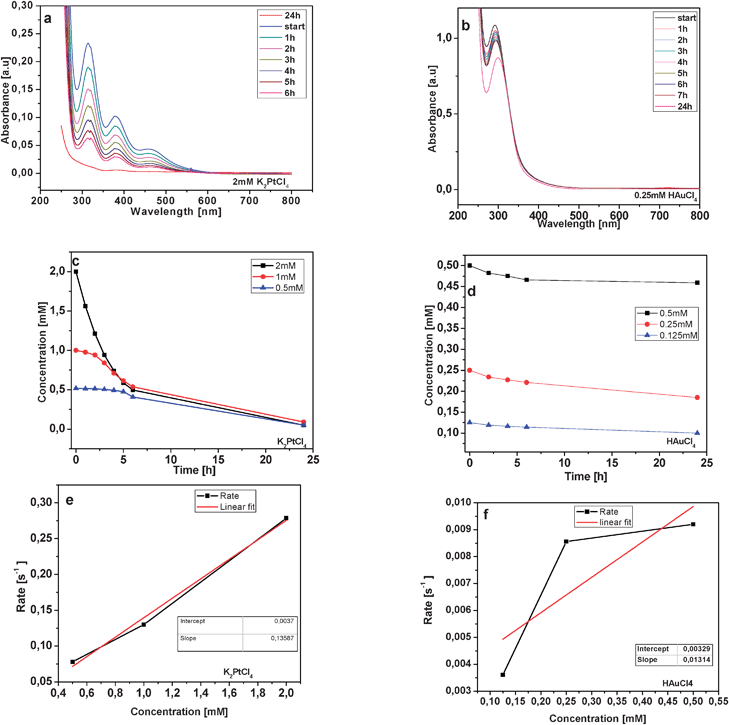 | ||
| Fig. 10 Time-dependent UV–vis measurement of the spontaneous reduction processes of (a) 2 mM K2PtCl4, (b) 0.25 mM HAuCl4 solution brought about by a 3D CNT block structure. Concentration profiles during the self-reduction process for different initial concentrations of (c) Pt2+ and (d) Au3+. Concentration vs. rate plot for (e) K2PtCl4 and (f) HAuCl4 for the self-reduction process. | ||
In the case of the spontaneous reduction of Au3+ from HAuCl4 solution, it was observed that the decrease in the concentration of Au3+ ions is dependent on the initial HAuCl4 concentration. This implies that at higher concentrations of HAuCl4, for example 2 mM or even 1 mM solutions, the reduction process is fast and is thought to be kinetically controlled. Thus at higher Au3+ ion concentrations the gold loading due to reduction might reach a saturation limit in a very short time. In the case of Pt2+, salt solution concentrations studied were far below those required to observe such a reaction regime. The change in concentration for different initial metal ion concentrations is shown in Fig. 10c for Pt2+ and in Fig. 10d for Au3+ ions. During the initial stage of the reduction, which is up to 6 h, the change in concentration (ln[Cinitial]/[Cat time t]) follows a linear behaviour. At slightly lower concentrations (0.5 mM or 0.25 mM for Au3+) due to the slow diffusion-controlled reduction process, a gradual decrease in Au3+ as well as Pt2+ concentrations was observed. At highly dilute solutions (0.125 mM or below) of Pt2+ and Au3+ it was observed that, a certain barrier exists for reduction, as it takes more than 24 h before any change in concentration is observed. This kinetic barrier for Au3+ reduction seems to be less pronounced than that Pt2+. It has been observed in the case of hydrolysis kinetics of tetrachloroplatinate(II) in base that complexes such as [PtClx(OH)4−x]2− or [PtClx(H2O)4−x]2−x are formed. These complexes have also shown a shift in the absorption peak to higher energy in UV–vis spectroscopy.32 In the case of Au3+(aq), complexes such as [AuClx(OH)4−x]− (x < 2) are present at higher pH values.33 Such complexes have a different redox potential than the ones formed at higher Au3+ ion concentrations. This could be one reason for the observed barrier of the spontaneous reduction at very low concentrations.
Further, it is observed that in the case of both, Pt2+ and Au3+, the complete removal of metal ions due their reduction can be achieved only after sufficiently long time intervals (more than 24 h). From these observed phenomena it can be concluded that the metal loading of the 3D CNT monolith can be specifically controlled by the use of initially differently concentrated metal ion solutions. The reduction process proceeds with first-order rate kinetics (Fig. 10e and 10f), and a rate of reduction of Au3+ one order of magnitude slower than that for Pt2+. The average rate constant for Au3+ can be estimated to be kAu = 0.0131 s−1 and that for Pt2+ to be kPt = 0.135 s−1. These results confirm the observed difference in the particle size on the 3D CNT monolith for Au (slower reduction, larger particle) and Pt (faster reduction, smaller particle) particles during the spontaneous reduction of their respective precursor solutions. These results also show that the reduction of both precursor salt solutions is continuous and that once started, the initial deposition of the metal particles derived the salt solutions does not decrease the Fermi energy of the CNTs to allow further reduction of metal ions. This is in contrast to the observation made in the case of Au3+ reduction on SWNTs, wherein nucleation seems to be occurring only in the very initial stage of the reduction and then particle size growth takes place.24 Thus a continuous inward diffusion of metal ions is maintained for a long duration of infiltration time as well as its subsequent reduction for the 3D monolith CNT structure. This fact is supported by the TEM observation of Pt nanoparticles uniformly covering the CNTs of the monolith as well as the formation of thicker coatings of ZnO nanoparticles on the 3D CNT monolith structure derived from the Zn–oximato precursor 1. The results indicate that the CNT monolith can even be used as a metal ion scavenger for metal ion removal. The metal ion scavenging properties of the 3D CNT monolith have been further confirmed by measuring the absorbance decrease in UV–vis for Pt2+ salt solutions up to 125 μM and for Au3+ up to 31.25 μM. The final Pt 2+ concentration is found to be ∼ 57 μM and for Au3+ the final concentration is ∼18 μM after 24 h. This pronounced tendency of metal reducing capability is certainly due to the possibility of realising a high metal loading within these high surface 3D CNT structures.
4 Conclusions
Synthesis of regularly arranged 3D CNT nanocomposite arrays with a nominal tube diameter of 40 nm was described. It has been shown that the tubes can be used for the deposition of nanoparticles of ZnO, Au and Pt. The latter are deposited spontaneously on the outer surface of the CNTs due to the formation of the redox pairs Au3+/CNT3D and Pt2+/CNT3D which allow a spontaneous reduction of the metal cations to their zerovalent state. The infiltration of the voids within the monolithic structure with the different precursor solutions is almost complete giving a very homogeneous deposition inside the monolith. The spontaneous reduction of Au3+ and Pt2+ ions by the CNTs follows first-order kinetics with the reduction of Au3+ being one order of magnitude slower than that for Pt2+. The loading of the 3D CNT monolith with the respective precursor solutions can be followed by UV–vis spectroscopy and measuring the decrease in metal ion concentration over time. Thus this method is suitable for loading metal nanoparticles into the CNT monolith without using any additional reducing agent. Thus it was successfully proven that metal loading can be realised and that such a composite structure is now available as nanostructured microreactor with different loadings of catalyst particles onto its surface. Pt and Au metal ions can be scavenged from such solutions by electroless process, thus offering a new technique for precious metal ion scavenging.Acknowledgements
Our work is supported by the Deutsche Forschungsgemeinschaft (DFG). We thank Dr J. Engstler (TEM) and Dr K. Hofmann (XRD) for measurements. TEM measurements at the Ernst-Ruska-Zentrum (ERC), Jülich were made possible through our cooperation project with ERC; ERC/TUD-001. Technical support at ERC through Dr L. Houben is acknowledged.References
- Y. Xia, P. Yang, Y. Sun, Y. Wu, B. Mayers, B. Gates, Y. Yin, F. Kim and H. Yan, Adv. Mater., 2003, 15, 353–89 CrossRef CAS; M. Chen, Y. Xie, H. Chen, Z. Qiao, Y. Zhu and Y. Qian, J. Colloid Interface Sci., 2000, 229, 217–221 CrossRef CAS.
- T. L. Wade and J. E. Wegrow, Eur. Phys. J.: Appl. Phys., 2005, 29, 3–22 CrossRef CAS.
- C. R. Martin, Science, 1994, 266, 1961–1966 CrossRef CAS; D. Losic, M. Lillo and D. Losic Jr., Small, 2009, 5, 1392–97 CrossRef CAS; W. Lee, R. Ji, U. Gösele and K. Nielsch, Nat. Mater., 2006, 5, 741–47 CrossRef CAS.
- J. J. Schneider, J. Engstler, K. P. Budna, C. Teichert and S. Franzka, Eur. J. Inorg. Chem., 2005, 2352–2359 CrossRef CAS.
- Z. Wang and H. L. Li, Appl. Phys. A: Mater. Sci. Process., 2002, 74, 201–203 CrossRef CAS.
- H. J. Fan, W. Lee, R. Scholz, A. Dadgar, A. Krost, K. Nielsch and M. Zacharias, Nanotechnology, 2005, 16, 913–917 CrossRef CAS.
- J. Jie, G. Wang, Q. Wang, Y. Chen, X. Han, X. Wang and J. G. Hou, J. Phys. Chem. B, 2004, 108, 11976–11980 CrossRef CAS.
- N. Zhao, G. Wang, Y. Huang, B. Wang, B. Yao and Y. Wu, Chem. Mater., 2008, 20, 2612–2614 CrossRef CAS.
- C. Bae, S. Kim, B. Ahn, J. Kim, M. M. Sung and H. Shin, J. Mater. Chem., 2008, 18, 1362–1367 RSC.
- J. J. Schneider, N. Czap, J. Hagen, J. Engstler, J. Ensling, P. Gütlich, U. Reinoehl, H. Bertagnolli, F. Luis, L. Jos de Jongh, M. Wark, G. Grubert, G. L. Hornyak and R. Zanoni, Chem.–Eur. J., 2000, 6, 4305–4321 CrossRef CAS.
- C. R. Martin, Chem. Mater., 1996, 8, 1739–1746 CrossRef CAS.
- J. Khanderi and J. J. Schneider, Z. Anorg. Allg. Chem., 2009, 635, 2135 CrossRef CAS; J. J. Schneider, J. Engstler, S. Franzka, K. Hofmann, B. Albert, J. Ensling, P. Gütlich, P. Hilderbrandt, S. Döpner, W. Pfeging, B. Günther and G. Müller, Chem.–Eur. J., 2001, 7, 2888–2895 CrossRef CAS.
- W. Wang, N. Li, X. Li, W. Geng and S. Qiu, Mater. Res. Bull., 2006, 41, 1417–1423 CrossRef CAS.
- H. Zhou and S. S. Wong, ACS Nano, 2008, 2, 944–958 CrossRef CAS.
- Niko Haberkorn, Jochen S. Gutmann and Patrick Theato, ACS Nano, 2009, 3, 1415–1422 CrossRef CAS.
- A. L. M. Reddy, M. M. Shaijumon, S. R. Gowda and P. M. Ajayan, Nano Lett., 2009, 9, 1002–1006 CrossRef CAS.
- A. Popp, O. Yilmazoglu, O. Kaldirim, J. J. Schneider and D. Pavlidis, Chem. Commun., 2009, 3205–3207 RSC.
- S. Sigurdson, V. Sundaramurthy, A. K. Dalai and J. Adjaye, J. Mol. Catal. A: Chem., 2009, 306, 23–32 CrossRef CAS.
- Z. Wen and J. Li, J. Mater. Chem., 2009, 19, 8707 RSC; Z. H. Wen, Q. Wang and J. H. Li, Adv. Funct. Mater., 2008, 18, 959 CrossRef CAS.
- A. Popp and J. J. Schneider, Angew. Chem., 2008, 120, 9092–95 CrossRef.
- V. Hessel, C. Knobloch and H. Löwe, Rec. Pat. Chem. Eng, 2008, 1, 1–16 Search PubMed.
- C. Mohr, H. Hofmeister, J. Radnik and P. Claus, J. Am. Chem. Soc., 2003, 125, 1905–1911 CrossRef CAS; P. Claus, Appl. Catal., A, 2005, 291, 222–229 CrossRef CAS; P. Claus, H. Hofmeister and C. Mohr, Gold Bull., 2004, 37, 181–186 CAS; S. Schimpf, M. Lucas, C. Mohr, U. Rodemerck, A. Brückner, J. Radnik, H. Hofmeister and P. Claus, Catal. Today, 2002, 72, 63–78 CrossRef CAS.
- J. Khanderi, R. Hofmann, A. Gurlo and J. J. Schneider, J. Mater. Chem., 2009, 19, 5039–46 RSC.
- J. Khanderi, R. C. Hoffmann, J. Engstler, J. J. Schneider, J. Arras, P. Claus and G. Cherkashinin, Chem.–Eur. J., 2009 DOI:10.1002/chem.200901987.
- H. C. Choi, M. Shim, S. Bangsaruntip and H. Dai, J. Am. Chem. Soc., 2002, 124, 9058–59 CrossRef CAS.
- J. J. Schneider, R. C. Hoffmann, J. Engstler, O. Soffke, A. Issanin and A. Klyszcz, Adv. Mater., 2008, 20, 3383–3387 CrossRef CAS.
- C.-W. Chen and M.-H. Lee, Nanotechnology, 2004, 15, 480–484 CrossRef CAS.
- Handbook of Chemistry and Physics, ed. D. R. Lide, CRC Press, Cleveland, Ohio, 81st edn, 2000 Search PubMed.
- Handbook of Chemistry and Physics, ed. D. R. Lide, CRC Press, Cleveland, Ohio, 73rd edn, 1991 Search PubMed.
- L. Wu and Y. Wu, J. Mater. Sci., 2007, 42, 406–408 CrossRef CAS; H. Yu, Z. Zhang, M. Han and F. Zhu, J. Am. Chem. Soc., 2005, 127, 2378–2379 CrossRef CAS.
- M. A. Correa-Duarte, N. Sobal, L. M. Liz-Marzan and M. Giersig, Adv. Mater., 2004, 16, 2179–84 CrossRef CAS.
- L. Wu, B. E. Schwederski and D. W. Margerum, Inorg. Chem., 1990, 29, 3578–84 CrossRef CAS.
- S. Wang, K. Qian, X. Z. Bi and W. Huang, J. Phys. Chem. C, 2009, 113, 6505–10 CrossRef CAS.
| This journal is © The Royal Society of Chemistry 2010 |
