DNA aptasensor for the detection of ATP based on quantum dots electrochemiluminescence
Haiping
Huang
ab,
Yanglan
Tan
a,
Jianjun
Shi
a,
Guoxi
Liang
a and
Jun-Jie
Zhu
*a
aKey Lab of Analytical Chemistry for Life Science (MOE), School of Chemistry and Chemical Engineering, Nanjing University, Nanjing, 210093, P.R. China. E-mail: jjzhu@nju.edu.cn; Fax: +86-25-8359-4976; Tel: +86-25-8359-497
bCenter for Materials Analysis & Testing, Jiangxi University of Science and Technology, Ganzhou, 341000, P.R. China
First published on 25th February 2010
Abstract
A novel and facile strategy for the fabrication of aptamer-based adenosine 5′-triphosphate (ATP) biosensor was developed by a quantum dot (QD) electrochemiluminescence (ECL) technique. Different from the existing strategies for the development of aptasensors based on electrochemical, fluorescent or other methods, the strategy proposed here is essentially based on the aptamer–ATP specific affinity and the rules of Watson–Crick base pairing. After the thiol modified anti-ATP probes were immobilized onto the pretreated Au electrode, the electrode was incubated in ATP solution to form aptamer–ATP bioaffinity complexes. The complementary DNA (cDNA) oligonucleotides were hybridized with the free probes. As a result, the avidin-modified QDs were bound to the aptasensor through the biotin–avidin system in the existence of biotin-modified cDNA. The ECL signal of the aptasensor was responsive to the amount of QDs bound to the cDNA oligonucleotides, which was inversely proportional to the combined target analyte ATP. The QDs were characterized by high resolution transmission electron microscopy (HRTEM), ultraviolet (UV) and photoluminescence (PL) spectra. The preparation process for the aptasensor was monitored by electrochemical impedance spectroscopy (EIS) and cyclic voltammetry (CV). Possible interference, such as from the pH value of the electrolyte, the incubation time and the concentration of coreactant K2S2O8, on the aptasensor ECL response were investigated. The ATP concentration was measured through the decrease of ECL intensity. The ECL intensity of the aptasensor decreased with the increase of the logarithm of the ATP concentration over the 0.018–90.72 μM range. In addition, the aptasensor exhibited excellent selectivity responses toward the target analyte. This study may offer a new and relatively general approach to expand the application of QD ECL in the aptasensor field.
Introduction
Originating from their relatively easy preparation by an in vitro evolutionary selection procedure called SELEX (systematic evolution of ligands by exponential enrichment), since they were first proposed in 19901 aptamers have received considerable attention and attracted much interest in recent years. Aptamers are single-stranded DNA, RNA or even modified nucleic acid molecules that have the ability to form defined tertiary structures upon binding to specific targets, including metal ions, small molecules, metabolites and proteins.2 Compared with natural receptors such as antibodies and enzymes, aptamers possess several unprecedented advantages that make them as the ideal recognition probes for analyte detection.3 Aptamers could be simply and reproducibly synthesized, easily labeled, and undergo significant conformational changes upon target binding. What is more, aptamers have good chemical stability, wide applicability, readily availability, and great flexibility for biosensor design. Because of these important features, more and more interest has been attracted in developing an aptamer–target binding system. To transform the aptamer–target binding events into physically detectable signals, a number of detection systems have been developed and the majority are based on fluorescent,4 electrochemical,5 colorimetric,6 chromatographic7 or piezoelectric8 mechanisms, and so on.For example, Li et al. designed an aptamer-based fluorescent reporter, which took advantage of fluorescence signal change to detect ATP or thrombin.9 Metal ion detection based on aptamer conformation change has also been described.10 Electrochemical aptamer-based sensors have already been reported to detect thrombin or cocaine.11 In addition, Tan has developed a method for the rapid detection of leukemia cells using aptamer functionalized nanoparticles as the molecular recognition element.12 However, efforts are still being made to develop new assay to transduce aptamer recognition events to detectable signals, which is the key to realize their potential in analytical applications.
As newly developed inorganic fluorescent materials, semiconductor nanocrystals (NCs) or quantum dots (QDs) have been extensively studied because of their unique size-dependent electronic, magnetic, optical, and electrochemical properties.13 They have been widely used in cell imaging, bacteria detection, and immunoassays.14
In particular, Bard's group found that QDs could be oxidized and reduced during potential cycling or pulsing. When electrogenerated reduced species are in collision with the oxidized species, efficient and stable light emission could be generated during the annihilation process. This light emission is called electrogenerated chemiluminescence, abbreviated ECL.15
An alternative approach to generate QD ECL is through the use of a coreactant. After the reaction with the coreactants, efficient and stable ECL in aqueous solution can also be obtained by applying a cathodic potential to the QDs.16 Afterwards, highly luminescent semiconductor QDs gained increasing attention for the application in bioconjugates and optical biosensor.17
The application of QD ECL to aptamer–target recognition may broaden the detection assay. However, except for our communication about detecting lysozyme using QD ECL,18 there are no other reports on the use of QD ECL for aptamer–target detection. Herein, an adenosine 5′-triphosphate (ATP) aptasensor using QD ECL as the detectable signal was developed. The 5′-thiol-modified anti-ATP aptamers were first immobilized onto the Au electrode through an Au–S bond. The aptamer–ATP bioaffinity complexes were formed after the above electrode was immersed into an ATP solution. The free aptamers were hybridized with 5′-biotin-modified complementary DNA (cDNA) oligonucleotides to form double-stranded DNA (ds-DNA) oligonucleotides. At last, through the biotin–avidin-system, streptavidin-modified QDs (avidin-QDs) were bound to 5′-biotin-modified cDNA oligonucleotides. The ECL signal of the biosensor was responsive to the amount of QDs bonded to the cDNA oligonucleotides, which was indirectly inversely proportional to the combined target ATP. Possible interferences from the experimental conditions, such as the incubation time, the coreactant K2S2O8 concentration and the pH of the electrolyte on the ECL signal responses were investigated.
Experimental
Chemicals and reagents
Labeled DNA oligonucleotides were synthesized by Shanghai Sangon Biotechnology Co. Ltd. (Shanghai, China). The sequences of these two oligonucleotides employed are given below:The 5′-thiol-modified anti-ATP probe:
5′-HS-(CH2)6-ACCTGGGGGAGTATTGCGGAGGAAGGT
The 5′-biotin-modified complementary DNA:
5′-biotin-ACCTTCCTCCGCAATACTCCCCCAGGT
Bovine serum albumin (BSA), 6-mercapto-1-hexanol (MCH), adenosine 5′-triphosphate (ATP), cytosine 5′-triphosphate (CTP), guanosine 5′-triphosphate (GTP), uridine 5′-triphosphate (UTP) were purchased from Sigma-Aldrich and used as received. Avidin-QDs (CdSe/ZnS core–shell structure with a diameter about 10 nm) were supplied by Wuhan Jiayuan Quantum Dots Co., Ltd. (Wuhan, China) with a initial concentration of 1.10 μM. All other reagents were of analytical reagent grade and used without further purification. The buffer solution contained 100 mM Na2HPO4 + NaH2PO4, 5 mM MgCl2, pH 7.4, and abbr. PBS+. The electrolyte for ECL measurements was 5 mL PBS+ solution containing 0.1 M K2S2O8 and 0.1 M KCl. A solution containing 0.1 M KCl and 2 mM [Fe(CN)6]3−/[Fe(CN)6]4− was used for electrochemical characterization. Millipore ultrapure water (resistivity ≥ 18.2 MΩ cm) was used throughout the experiment.
Apparatus and measurements
High resolution transmission electron microscopy (HRTEM) images were taken using a JEOL 2100 microscope at an accelerating voltage of 200 kV. UV absorption spectra were carried out with a Ruili 1200 photospectrometer (Beijing Analytical Instrument Co., Beijing, China). Photoluminescence (PL) spectra were obtained on an RF-540 spectrophotometer (Shimadzu). The ECL signal was measured using a model MPI-A electrochemiluminescence analyzer (Xi'an Remex Analysis Instrument Co., Ltd., Xi'an, China) at room temperature. The spectral width of the photomultiplier tube (PMT) was 300–650 nm, and the voltage of the PMT was set at 600 V during the detection process. The EIS and CV analyses were performed on an Autolab PGSTAT12 (Ecochemie, BV, The Netherlands) and controlled by FRA and GPES 4.9 software. The EIS characterization was performed in the frequency range of 0.1–1.0 × 10⁵ Hz. In all electrochemical experiments, the conventional three-electrode system was employed with a modified Au electrode as the working electrode, a saturated calomel electrode (SCE) as the reference electrode, and a Pt wire as the counter electrode.Preparation of aptamer–ATP biosensor
The Au electrode was first pretreated with freshly made piranha solution (98% H2SO4![[thin space (1/6-em)]](https://www.rsc.org/images/entities/char_2009.gif) :
:![[thin space (1/6-em)]](https://www.rsc.org/images/entities/char_2009.gif) 30% H2O2 = 7
30% H2O2 = 7![[thin space (1/6-em)]](https://www.rsc.org/images/entities/char_2009.gif) :
:![[thin space (1/6-em)]](https://www.rsc.org/images/entities/char_2009.gif) 3, v/v) for 10 min twice (CAUTION: piranha solution should be handled with great care because of its strong oxidizability). Prior to use, all the oligonucleotide solutions were heat-treated in 90 °C for 3 min and then cooled in ice for 10 min. 20 μL of 5 μM aptamer solution was spread on the pre-cleaned Au electrode surface for 12 h at 37 °C in 100% humidity, followed by immersion in 1 mM MCH for 2 h to remove the nonspecific DNA adsorption. Subsequently, the above electrode was dunked into the ATP solution for the formation of aptamer–ATP bioaffinity complexes. After being washed with wash buffer (Tween-20 in PBS+) to remove the nonspecifically bound ATP, 20 μL of the 5 μM 5′-biotin-modified cDNA oligonucleotides solution was dropped onto the electrode for 1 h incubation to form a double-stranded DNA (ds-DNA) structure between the free probes and the cDNA oligonucleotides. Afterwards, 20 μL of diluted avidin–QD liquid was dropped onto the electrode surface for 1 h. Before use, 1 μL obtained avidin–QD solution was dissolved in 100 μL bovine serum albumin (BSA) solution (1 mg mL−1 in PBS+) under shaking conditions for 1 h for the purpose of blocking the active sites of the QDs. All the above incubation steps were carried out at 37 °C. Before ECL measurement, the biosensor was washed with wash buffer to remove the physical absorption of the QDs. The whole preparation process is outlined in Fig. 1.
3, v/v) for 10 min twice (CAUTION: piranha solution should be handled with great care because of its strong oxidizability). Prior to use, all the oligonucleotide solutions were heat-treated in 90 °C for 3 min and then cooled in ice for 10 min. 20 μL of 5 μM aptamer solution was spread on the pre-cleaned Au electrode surface for 12 h at 37 °C in 100% humidity, followed by immersion in 1 mM MCH for 2 h to remove the nonspecific DNA adsorption. Subsequently, the above electrode was dunked into the ATP solution for the formation of aptamer–ATP bioaffinity complexes. After being washed with wash buffer (Tween-20 in PBS+) to remove the nonspecifically bound ATP, 20 μL of the 5 μM 5′-biotin-modified cDNA oligonucleotides solution was dropped onto the electrode for 1 h incubation to form a double-stranded DNA (ds-DNA) structure between the free probes and the cDNA oligonucleotides. Afterwards, 20 μL of diluted avidin–QD liquid was dropped onto the electrode surface for 1 h. Before use, 1 μL obtained avidin–QD solution was dissolved in 100 μL bovine serum albumin (BSA) solution (1 mg mL−1 in PBS+) under shaking conditions for 1 h for the purpose of blocking the active sites of the QDs. All the above incubation steps were carried out at 37 °C. Before ECL measurement, the biosensor was washed with wash buffer to remove the physical absorption of the QDs. The whole preparation process is outlined in Fig. 1.
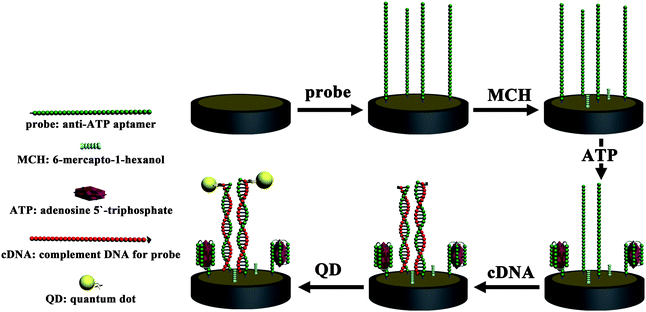 | ||
| Fig. 1 The whole aptasensor preparation process. | ||
For the control experiments, electrolytes with different pH value were adjusted with NaOH or concentrated phosphoric acid. To test the specific response against ATP analogues, CTP, GTP and UTP solutions with the same concentration as ATP were used in the aptamer–analyte bioaffinity complex formation step.
Results and discussion
QDs characterization
The QDs used here were water-soluble with a CdSe/ZnS core–shell structure. The morphology and optical properties of the QDs were characterized by HRTEM, UV and PL spectra, respectively. Shown in Fig. 2 the HRTEM images of the QDs, and Fig. 2B is the magnification of Fig. 2A. The gray dots correspond to the QDs. It could be concluded from Fig. 2A that the QDs are relatively uniform in size and morphology. According to Fig. 2B, the obtained QDs are about 10 nm in diameter. Fig. 3 showed the UV and PL spectra of the QDs in 0.1 M PBS. In Fig. 3A, a maximum UV absorption at 276 nm was observed, which could be attributed to the existence of streptavidin. In the excitation wavelength of 360 nm, the PL emission peak appeared at 605 nm, which indicated the consequence of quantum confinement as shown in Fig. 3B.19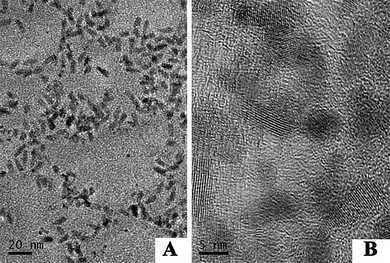 | ||
| Fig. 2 HRTEM image of QDs. B is the magnification of A. | ||
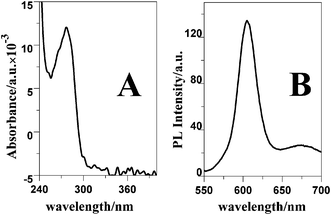 | ||
| Fig. 3 UV (A) and PL (B) spectra of the QDs in 0.1 M PBS (pH 7.4). The PL excitation wavelength was 360 nm. | ||
Electrochemical characterization of the aptasensor
Electrochemical impedance spectroscopy (EIS) has been reported as an effective assay to inspect the features of the electrode surface, and this inspection is helpful to understand the chemical transformations and processes associated with the conductive electrode surface.20 The impedance spectrum contains a semicircle portion and a linear portion. The semicircle portion at higher frequencies corresponds to the electron transfer limited process, and the semicircle diameter equals the electron-transfer resistance (Ret). This resistance controls the electron-transfer kinetics of the redox probe at the electrode interface. The linear part at lower frequencies corresponds to the diffusion process. On the other hand, the cyclic voltammogram (CV) of ferricyanide is a valuable tool to monitor the barrier of the modified electrode, because electron transfer between the solution species and the electrode must occur by tunneling through the barrier. Therefore, CV was considered a useful method to investigate the changes of the electrode behavior after each assembly step. Here, the aptamer–ATP bioaffinity complexes and the Watson–Crick helices were formatted in order on the Au electrode surface, so EIS and CV were used to check up each experimental step.The probes immobilized on the Au electrode were first hybridized with ATP by immersing the electrode into ATP solution, and then the hybridization between the free probes and their complementary DNA oligonucleotides was accomplished. Fig. 4A shows the EIS characterization after each experimental step. At the bare Au electrode, the small electron-transfer resistance (Ret) was recorded as shown in Fig. 4A, curve a, suggesting a fast electron-transfer process at the bare electrode. Compared with the bare Au electrode, the probe-modified Au electrode shows a larger Ret (Fig. 4A, curve b). This enlargement could be attributed to the increase of the electron-transfer distance caused by the electrostatic repulsion between the electroactive redox probe [Fe(CN)6]3−/4− and the negatively charged probe DNA backbone immobilized onto the Au electrode. The resistance was decreased after the probe-modified electrode was immersed into the ATP solution as shown in Fig. 4A, curve c, suggesting the formation of the bioaffinity complexes between probes and their target analyte ATP. The conformation change of the aptamer (compression) creates this decrease in resistance. When cDNA solution was dropped onto the above electrode, the resistance was enlarged again (Fig. 4A, curve d). This showed the formation of a Watson–Crick helix of the cDNA with the free aptamer on the electrode surface. The Watson–Crick helix on the Au electrode essentially increases the negative charge on the electrode surface and thereby further enhances the electrostatic repulsion between the ds-DNA structure and the redox probe [Fe(CN)6]3−/4−. The Ret resistance decreased after the modified electrode was incubated in QD solution for 60 min (Fig. 4A, curve e), which demonstrated that the avidin-QDs were successfully bound to the 5′-biotin-modified cDNA oligonucleotides via the biotin–avidin-system. The Ret changes above essentially revealed the successes of each assembly step.
![EIS (A) and CV (B) of the electrode at different stages in 0.1 M KCl + 2 mM [Fe(CN6)]3−/4−. (a) bare Au electrode, (b) probe/Au electrode, (c) ATP/probe/Au electrode, (d) cDNA/ATP/probe/Au electrode, (e) QDs/cDNA/ATP/probe/Au electrode. The EIS frequency range: 0.1–1.0 × 10⁵ Hz. The CV scan rate was 100 mV s−1 and the ATP concentration 18 μM.](/image/article/2010/NR/b9nr00393b/b9nr00393b-f4.gif) | ||
| Fig. 4 EIS (A) and CV (B) of the electrode at different stages in 0.1 M KCl + 2 mM [Fe(CN6)]3−/4−. (a) bare Au electrode, (b) probe/Au electrode, (c) ATP/probe/Au electrode, (d) cDNA/ATP/probe/Au electrode, (e) QDs/cDNA/ATP/probe/Au electrode. The EIS frequency range: 0.1–1.0 × 10⁵ Hz. The CV scan rate was 100 mV s−1 and the ATP concentration 18 μM. | ||
Fig. 4B showed the CVs of [Fe(CN)6]3−/4− on the modified electrode at different stages. As could be seen, stepwise modifications on the Au electrode were accompanied by the changes in the amperometric response, as well as the separation between the cathodic and anodic peak of the redox probe [Fe(CN)6]3−/4−. On the bare Au electrode, a pair of redox peaks was observed (Fig. 4B, curve a), showing the excellent electron-transfer kinetics of [Fe(CN)6]3−/4−. After the probes were immobilized on the Au electrode (curve b Fig. 4B, curve b), the amperometric response decreased and the peak-to-peak separation enlarged, due to electrostatic repulsion of probe backbone with negative charge and the negatively charged electroactive probe. The CV response was further decreased after the formation of a Watson–Crick helix. The CV changes were consistent with the EIS changes, thus each assembly step was checked again.
ECL behaviors of the aptasensor
QDs could be electrochemically reduced during the potential scan and react with the coreactant S2O82− to generate a strong ECL signal in aqueous solution,21 and the ECL intensity is proportional to the amount of QDs. The luminescence mechanism could be expressed as follows:| QD + e → QD˙− | (1) |
| S2O82− + e → SO42− + SO4˙− | (2) |
| QD˙− + SO4˙− → QD* + SO42− | (3) |
| QD* → QD + hν | (4) |
Firstly, in order to prove that the ECL signal was generated by the QDs, the ECL intensity of the modified electrode after each modification was examined. Shown in Fig. 5 is the ECL signal of bare Au electrode, probe/Au electrode, ATP/probe/Au electrode, cDNA/ATP/probe/Au electrode and QD/cDNA/ATP/probe/Au electrode. The results showed that these signals were very low, even negligible, before QDs were bound to the electrode. After QDs were bound to the electrode, the ECL signal amplified significantly. This proved that the signal was generated from QDs, showing that QDs played a decisive role in the ECL aptasensor.
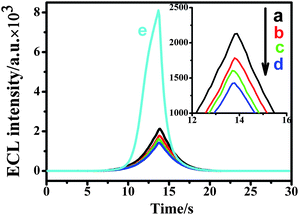 | ||
| Fig. 5 ECL intensity of different modified electrodes. (a) bare Au electrode, (b) probe/Au electrode, (c) ATP/probe/Au electrode, (d) cDNA/ATP/probe/Au electrode, (e) QDs/cDNA/ATP/probe/Au electrode. The inset is the amplification of curve (a), (b), (c) and (d). The electrolyte: 5 mL pH 7.4 PBS+ solution containing 0.1 M K2S2O8 and 0.1 M KCl. The voltage of the photomultiplier tube was 600 V and the scan rate 100 mV s−1. | ||
Next, possible interference, such as the pH value of the electrolyte, the incubation time and the coreactant K2S2O8 concentration, on the aptasensor ECL responses were investigated. Fig. 6 shows the pH influence of the electrolyte on the ECL response in the range of 6.0–10.0. The ECL intensity of the aptasensor increased first and reached the maximum ECL response at pH 7.4–8.0, and then decreased when pH was larger than 8.0. This phenomenon is consistent with our previous results.22 Because the physiological pH for the biological systems was about 7.4, this pH was chosen for ATP detection. In ECL measurement, the incubation time for avidin–QDs binding to 5′-biotin cDNA was changed from 1 h, 2 h to 3 h. No obvious ECL intensity fluctuation was observed. In the case of K2S2O8 concentration, three different concentrations of 0.05 M, 0.1 M and 0.2 M were employed in the measurement. As the coreactant concentration become higher, the time needed to reach the intensity peak value was shorter, but without a change in the value of the intensity peak. Therefore, 1 h and 0.1 M were chosen for the incubation time and coreactant K2S2O8 concentration, respectively.
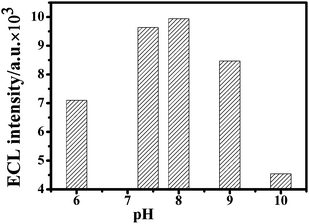 | ||
| Fig. 6 Effect of pH on the ECL response of the aptasensor. The electrolyte: PBS+ solution containing 0.1 M K2S2O8 and 0.1 M KCl with pH value range from 6.0, 7.4, 8.0, 9.0 to 10.0. The voltage of the photomultiplier tube was 600 V and the scan rate 100 mV s−1. | ||
ECL detection of ATP
ATP is the main chemical energy carrier in living species. It plays an important role in cellular metabolism and cellular physiological biochemical pathways. What is more, ATP is considered as an indicator for cell viability and injury.23 Therefore, it is very important to detect ATP for biochemical studies and clinical diagnoses. Besides the traditional chemo/bio-luminescence and host–guest receptor methods,24 several novel strategies have been developed for ATP detection based on specific aptamer–ATP affinity.25 Most of the strategies are based on two methods: electrochemical, such as electrochemical impedance spectroscopy (EIS), cyclic voltammetry, square-wave voltammograms, amperometric assays,2e,26etc; and optical detection.23b, 27 Also, other methods such as turbidimetric and colorimetric approaches6b, 28 are reported for ATP detection. Here, we applied the QD ECL to the aptamer–target analyte recognition event for ATP detection. In this system, the ECL signal of the aptasensor was responsive to the amount of QDs bound to the cDNA oligonucleotides. In the absence of the target analyte, ATP, all the anti-ATP probes immobilized on the Au electrode could be hybridized to their cDNA oligonucleotides to form a ds-DNA structure; a maximum amount of cDNA oligonucleotides could be combined with the probe-modified electrode through the rules of Watson–Crick base pairing. Correspondingly, a maximum amount of QDs could be bound to the above electrode via the biotin–avidin-system. This allowed the achievement of the biggest ECL value. In order to prove that the amount of QDs was sufficient for binding, the QD initial solution diluted by 100- and 20-fold was used in the experiment, and the ECL intensity remained unchanged, so the initial solution diluted 100-fold was used in the following steps.When the probe-modified electrode was immersed into the ATP solution, a part of the probes were combined with ATP to form aptamer–ATP bioaffinity complexes. This induced the conformational change of these combined probes. After 5′-biotin-modified cDNA oligonucleotides were dropped onto this electrode, only the free probes, which were not combined with ATP, could be hybridized with their cDNA oligonucleotides to form the ds-DNA structure via the rules of Watson–Crick base pairing. Avidin-QDs could only bind to the biotin-modified cDNA oligonucleotides via the biotin–avidin-system. In other words, the specific binding of ATP with aptamer inhibited the cDNA to form the ds-DNA structure with probe, reduced the amount of QDs bound to the aptasensor, and ultimately decreased the ECL intensity. Fig. 7A showed the ECL intensity of the aptasensor in the absence of ATP (curve a) and presence of ATP (curve b–i) with different concentrations, the ECL signals were decreased in the presence of different concentrations of ATP analytes. Fig. 7B is the plot of ECL intensity versus the logarithm of the ATP concentration. It could be seen from Fig. 7B that the ECL signal linearly decreased with the increase of the logarithm of the ATP concentration over the range 0.018–90.72 μM, and the limit of detection was around 6 nM. This result is better than electrochemical detection.2e When the concentration exceeds 90.72 μM, the ECL signal changes were very small. This shows the saturation of bioaffinity between the probes and the target analyte ATP.
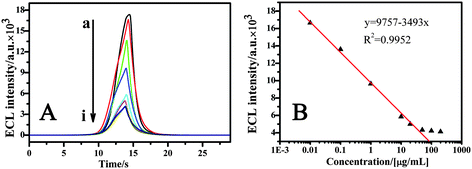 | ||
| Fig. 7 (A) The ECL intensity of the aptasensor with different ATP concentrations (μM). Curve a: ECL signal of the QDs/cDNA/probe modified Au electrode in the absence of ATP. Curve b–i: the ECL signal of aptasensor incubated with different concentrations of ATP (from top to down, 0.018, 0.18, 1.8, 18.0, 36.0, 90.0, 180.0 and 360 μM ATP, respectively). (B) The ECL intensity–concentration curve. The electrolyte was a 5 mL PBS+ solution containing 0.1 M K2S2O8 and 0.1 M KCl. The voltage of the photomultiplier tube was 600 V and the scan rate 100 mV s−1. | ||
Aptasensor selectivity
The selectivity of the aptasensor for ATP was tested via comparing the ECL signal changes brought by ATP and its three analogues CTP, GTP and UTP. Fig. 8A compares the ECL intensity responses of the aptasensors after incubation in ATP, CTP, GTP and UTP solutions under the same experimental conditions and the same concentration of 50 μg mL−1. When CTP, GTP and UTP solutions were used for incubation, the ECL intensities of the aptasensors were about 18,000, while the incubation of the aptasensor into the same concentration of ATP, the intensity decreased to 4500, a clear decrease. This comparison essentially suggests that the in vitro selected 27-base anti-ATP aptamer possesses a high specific affinity for ATP determination. Shown in Fig. 8B is the ECL signal-time curve under continuous potential scanning for 22 cycles. The stable and high ECL signals suggested that this aptasensor possessed good potential cycling stability.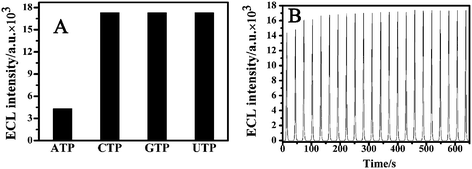 | ||
| Fig. 8 (A) ECL signal specificity of aptasensor towards ATP and its three analogues CTP, GTP and UTP. The aptasensor was incubated with 50 μg mL−1 ATP, CTP, GTP or UTP solution respectively for ECL detection. (B) ECL-time curve of QDs/cDNA/probe/Au electrode under continuous cyclic voltammetry scan. The electrolyte was 5 mL PBS+ solution containing 0.1 M K2S2O8 and 0.1 M KCl. The voltage of the photomultiplier tube was 600 V and the scan rate 100 mV s−1. | ||
Conclusions
In summary, we have demonstrated a new approach to prepare an ECL aptasensor for ATP detection. Through the aptamer–ATP specific affinity and the rules of Watson–Crick base pairing, ATP and complementary DNA oligonucleotides are hybridized with probes in sequence, and then QDs were bound to the aptasensor through the biotin–avidin system. The ECL intensity, as the readout signal for the aptasensor, paves a relatively general and cost-effective way to an ECL aptasensor with a good response as well as a high specificity toward the target analyte ATP. These properties of the prepared ECL aptasensor with the QD ECL as the recognition element substantially expand applications in other fields, such as other aptamer-based protein detection, DNA sequence detection, etc.Acknowledgements
We greatly appreciate the support of the National Natural Science Foundation of China for the Key Program (20635020), Creative Research Group (20821063). This work is also supported by National Basic Research Program of China (2006CB933201).Notes and references
- (a) A. D. Ellington and J. W. Szostak, Nature, 1990, 346, 818–822 CrossRef CAS; (b) C. Tuerk and L. Gold, Science, 1990, 249, 505–510 CrossRef CAS.
- (a) L. Gold, B. Polisky, O. Uhlenbeck and M. Yarus, Annu. Rev. Biochem., 1995, 64, 763–797 CrossRef CAS; (b) J. Hesselberth, M. P. Robertson, S. Jhaveri and A. D. Ellington, Rev. Mol. Biotechnol., 2000, 74, 15–25 CrossRef CAS; (c) J. E. Smith, C. D. Medley, Z. W. Tang, D. H. Shang, C. Lofton and W. H. Tan, Anal. Chem., 2007, 79, 3075–3082 CrossRef CAS; (d) S. S. Zhang, J. P. Xia and X. M. Li, Anal. Chem., 2008, 80, 8382–8388 CrossRef CAS; (e) Y. Lu, X. C. Li, L. M. Zhang, P. Yu, L. Su and L. Q. Mao, Anal. Chem., 2008, 80, 1883–1890 CrossRef CAS.
- (a) S. D. Jayasena, Clin. Chem., 1999, 45, 1628–1650 CAS; (b) R. R. Breaker, Curr. Opin. Chem. Biol., 1997, 1, 26–31 CrossRef CAS.
- (a) Y. Chen, M. S. Wang and C. D. Mao, Angew. Chem., Int. Ed., 2004, 43, 3554–3557 CrossRef CAS; (b) M. N. Stojanovic and D. M. Kolpashchikov, J. Am. Chem. Soc., 2004, 126, 9266–9270 CrossRef CAS.
- (a) D. Xu, X. Yu, Z. Liu, W. He and Z. Ma, Anal. Chem., 2005, 77, 5107–5113 CrossRef CAS; (b) A. E. Radi, J. L. A. Sanchez, E. Baldrich and C. K. O'Sullivan, J. Am. Chem. Soc., 2006, 128, 117–124 CrossRef CAS; (c) J. Yoshizumi, S. Kumamoto, M. Nakamura and K. Yamana, Analyst, 2008, 133, 323–325 RSC.
- (a) H. A. Ho and M. Leclerc, J. Am. Chem. Soc., 2004, 126, 1384–1387 CrossRef CAS; (b) J. Wang, L. Wang, X. Liu, Z. Liang, S. Song, W. Li, G. Li and C. H. Fan, Adv. Mater., 2007, 19, 3943–3946 CrossRef CAS; (c) W. Zhao, W. Chiuman, M. Brook and Y. F. Li, ChemBioChem, 2007, 8, 727–731 CrossRef CAS.
- (a) Q. Zhao, X. F. Li and X. C. Le, Anal. Chem., 2008, 80, 3915–3920 CrossRef CAS; (b) Q. Zhao, X. F. Li, Y. H. Shao and X. C. Le, Anal. Chem., 2008, 80, 7586–7593 CrossRef CAS.
- S. Tombelli, M. Minunni, E. Luzi and M. Mascini, Bioelectrochemistry, 2005, 67, 135–141 CrossRef CAS.
- R. Nutiu and Y. F. Li, J. Am. Chem. Soc., 2003, 125, 4771–4778 CrossRef.
- A. E. Radi and C. K. O'Sullivan, Chem. Commun., 2006, 3432–3434 RSC.
- (a) B. R. Baker, R. Y. Lai, M. S. Wood, E. H. Doctor, A. J. Heeger and K. W. Plaxco, J. Am. Chem. Soc., 2006, 128, 3138–3139 CrossRef CAS; (b) Y. Xiao, A. A. Lubin, A. J. Heeger and K. W. Plaxco, Angew. Chem., Int. Ed., 2005, 44, 5456–5459 CrossRef CAS.
- J. K. Herr, J. E. Smith, C. D. Medley, D. H. Shangguan and W. H. Tan, Anal. Chem., 2006, 78, 2918–2924 CrossRef CAS.
- (a) Y. D. Yin and A. P. Alivisatos, Nature, 2005, 437, 664–670 CrossRef CAS; (b) A. P. Alivisatos, Science, 1996, 271, 933–937 CrossRef CAS; (c) C. Burda, X. B. Chen, R. Narayanan and M. A. El-Sayed, Chem. Rev., 2005, 105, 1025–1102 CrossRef CAS.
- (a) R. Edgar, M. McKinstry, J. Hwang, A. B. Oppenheim, R. A. Fekete, G. Giulian, C. Merril, K. Nagashima and S. Adhya, Proc. Natl. Acad. Sci. U. S. A., 2006, 103, 4841–4845 CrossRef CAS; (b) R. Bakalova, Z. Zhelev, H. Ohba and Y. Baba, J. Am. Chem. Soc., 2005, 127, 9328–9329 CrossRef CAS; (c) X. Y. Wu, H. J. Liu, J. Q. Liu, K. N. Haley, J. A. Treadway, J. P. Larson, N. F. Ge, F. Peale and M. P. Bruchez, Nat. Biotechnol., 2003, 21, 41–46 CrossRef CAS; (d) W. J. Miao, Chem. Rev., 2008, 108, 2506–2553 CrossRef CAS.
- (a) Z. Ding, B. M. Quinn, S. K. Haram, L. E. Pell, B. A. Korgel and A. J. Bard, Science, 2002, 296, 1293–1297 CrossRef CAS; (b) N. Myung, X. Lu, K. P. Johnston and A. J. Bard, Nano Lett., 2004, 4, 183–185 CrossRef CAS.
- S. K. Poznyak, D. V. Talapin, E. V. Shevchenko and H. Weller, Nano Lett., 2004, 4, 693–698 CrossRef CAS.
- (a) D. Wang, A. L. Rogach and F. Caruso, Nano Lett., 2002, 2, 857–861 CrossRef CAS; (b) S. Y. Ding, M. Jones, M. P. Tucker, J. M. Nedeljkovic, J. Wall, M. N. Simon, G. Rumbles and M. E. Himmel, Nano Lett., 2003, 3, 1581–1585 CrossRef CAS; (c) J. H. Choi, K. H. Chen and M. S. Strano, J. Am. Chem. Soc., 2006, 128, 15584–15585 CrossRef CAS; (d) C. L. Feng, X. H. Zhong, M. Steinhart, A. M. Caminade, J. P. Majoral and W. Knoll, Adv. Mater., 2007, 19, 1933–1936 CrossRef CAS.
- H. P. Huang, G. F. Jie, R. J. Cui and J. J. Zhu, Electrochem. Commun., 2009, 11, 816–818 CrossRef CAS.
- L. Jiang, X. Chen, W. S. Yang, J. Jin, B. Q. Yang, L. Xu and T. J. Li, Chem. J. Chin. Univ., 2001, 22, 1397–1399 CAS.
- A. J. Bard and L. R. Faulkner, Electrochemical Methods: Fundamentals and Applications, Wiley, New York, 1980 Search PubMed.
- G. F. Jie, B. Liu, H. C. Pan, J. J. Zhu and H. Y. Chen, Anal. Chem., 2007, 79, 5574–5581 CrossRef CAS.
- G. F. Jie, J. J. Zhang, D. C. Wang, C. Cheng, H. Y. Chen and J. J. Zhu, Anal. Chem., 2008, 80, 4033–4039 CrossRef CAS.
- (a) T. Perez-Ruiz, C. Martinez-Lozano, V. Tomas and J. Martin, Anal. Bioanal. Chem., 2003, 377, 189–194 CrossRef CAS; (b) Y. Y. Wang, Y. S. Wang and B. Liu, Nanotechnology, 2008, 19, 415605 CrossRef (6pp).
- (a) G. Carrea, R. Bovara, G. Mazzola, S. Girotti, A. Roda and S. Ghini, Anal. Chem., 1986, 58, 331–333 CrossRef CAS; (b) J. A. Cruz-Aguado, Y. Chen, Z. Zhang, N. H. Elowe, M. A. Brook and J. D. Brennan, J. Am. Chem. Soc., 2004, 126, 6878–6879 CrossRef CAS.
- (a) E. Revesz, E. P. C. Lai and M. C. DeRosa, J. Biomol. Struct. Dyn., 2007, 24, 645–645; (b) X. Y. Cong and M. Nilsen-Hamilton, Biochemistry, 2005, 44, 7945–7954 CrossRef CAS; (c) N. C. Pagratis, C. Bell, Y. F. Chang, S. Jennings, T. Fitzwater, D. Jellinek and C. Dang, Nat. Biotechnol., 1997, 15, 68–73 CrossRef CAS; (d) R. D. Jenison, S. C. Gill, A. Pardi and B. Polisky, Science, 1994, 263, 1425–1429 CrossRef CAS; (e) A. Geiger, P. Burgstaller, H. von der Eltz, A. Roeder and M. Famulok, Nucleic Acids Res., 1996, 24, 1029–1036 CrossRef CAS.
- (a) Y. Du, B. L. Li, H. Wei, Y. L. Wang and E. K. Wang, Anal. Chem., 2008, 80, 5110–5117 CrossRef CAS; (b) X. L. Zuo, S. P. Song, J. Zhang, D. Pan, L. H. Wang and C. H. Fan, J. Am. Chem. Soc., 2007, 129, 1042–1043 CrossRef; (c) J. F. Masson, C. Kranz, B. Mizaikoff and E. B. Gauda, Anal. Chem., 2008, 80, 3991–3998 CrossRef CAS.
- (a) S. X. Su, N. Razvan, D. M. F. Carlos, Y. F. Li and P. Robert, Langmuir, 2007, 23, 1300–1302 CrossRef CAS; (b) J. Wang, Y. X. Jiang, C. S. Zhou and X. H. Fang, Anal. Chem., 2005, 77, 3542–3546 CrossRef CAS; (c) Z. W. Tang, P. Mallikaratchy, R. H. Yang, Y. Kim, Z. Zhu, H. Wang and W. H. Tan, J. Am. Chem. Soc., 2008, 130, 11268–11269 CrossRef CAS; (d) Y. Y. Wang and B. Liu, Analyst, 2008, 133, 1593–1598 RSC; (e) W. Yao, L. Wang, H. Y. Wang, X. L. Zhang and L. Li, Biosens. Bioelectron., 2009, 24, 3269–3274 CrossRef CAS.
- D. Miyamoto, Z. L. Tang, T. Takarada and M. Maeda, Chem. Commun., 2007, 4743–4745 RSC.
| This journal is © The Royal Society of Chemistry 2010 |
