Lasing in self-assembled microcavities of CdSe/CdS core/shell colloidal quantum rods
Margherita
Zavelani-Rossi†
*a,
Maria Grazia
Lupo†
a,
Roman
Krahne
b,
Liberato
Manna
b and
Guglielmo
Lanzani
a
aNational Laboratory for ultrafast and ultraintense optical Science INFM-CNR, Dipartimento di Fisica Politecnico di Milano, piazza L. Da Vinci 32, 20133 Milano, Italy. E-mail: margherita.zavelani@fisi.polimi.it
bIstituto Italiano di Tecnologia, via Morego 30, 16163 Genova, Italy
First published on 5th February 2010
Abstract
Colloidal semiconductor quantum rods have demonstrated many advantageous properties as light emitters such as high quantum yield, tunable emission wavelength, and polarized emission. This makes them an interesting optical gain material for laser applications. We report room-temperature gain lifetimes in core/shell CdSe/CdS quantum rods exceeding 300 ps, and show that the long gain lifetimes result from the significant reduction of Auger recombination in our quantum rods, even though the electrons are delocalized over the rod volume. We also fabricate devices by deposition of small droplets of quantum rod solution onto flat substrates. The evaporation dynamics of the droplets are governed by the coffee stain effect which leads to the formation of well defined micron-size stripes. These stripes consist of densely packed, laterally aligned quantum rods and provide optical feedback originating from the abrupt changes of refractive index at the stripe borders. We exploit the optical gain and the coffee stain mediated self-assembly and show that we can fabricate novel microlasers solely by deposition of droplets of quantum rod solutions on flat substrates.
Introduction
Colloidal semiconductor nanocrystals have been exploited in electro-optical devices like light-emitting diodes,1 lasers2,3 and solar cells.4 This trend is driven by the advanced synthesis of nanocrystals of various materials, sizes and shapes and will benefit from progress in their organization into ordered architectures by self-assembly. So far, lasing has been difficult to achieve in nanocrystals because optical gain competed with Auger recombination above the threshold, which shortened excited state lifetime to tens of picoseconds,5 and laser feedback was possible only via external resonators. The achievement of optical gain in colloidal semiconductor nanocrystals is challenging because two main obstacles have to be overcome, namely trapping of excited carriers at surface/interface defect states,6 and Auger recombination. Trapping can be reduced effectively by growing a passivating shell of a higher bandgap material around the emitting dot.6 Auger recombination takes place in the multi-exciton regime and is highly efficient, with time constants ranging from a few picoseconds to a few hundreds of picoseconds.5 One way to obtain gain is to operate under single exciton regime, when the Auger decay is completely inactive. Single exciton optical gain was reported for instance from type-II core/shell quantum dots (QD).7 Type-II behaviour is indeed more favourable for achieving optical gain.8 The major drawback of the single-exciton strategy is that in order to guarantee single-photon excitation, the input pump energy should be low and consequently also the total output energy will be low. A more radical solution is to reduce the Auger process by working with semiconductor nanocrystals in which at least one spatial dimension is not in the strong confinement regime. Colloidal quantum rods (QRs) with few nm diameters offer the advantage of retaining the strong quantum confinement along two spatial directions, while their absorption cross-section is significantly increased with respect to that of spherical QDs having similar optical features. As a result they show much longer gain lifetimes than QDs9 (up to nearly 100 ps),10 which can be increased further if the rods are coated with an epitaxial shell of suitable composition and thickness (150 ps being the longest gain lifetime reported so far11). Core/shell QRs thus represents a more promising material towards lasing, provided that suitable ways to construct optical resonators become available.So far, few examples of lasers based on semiconductor nanocrystals have been reported2,3,12 in which an external resonator was adopted for generating the optical feedback (either a physical cavity or a feedback mechanism such as scattering in random lasing). In all these reported cases the QRs behaved therefore like dyes in conventional lasers. In this work we report two findings that strongly enhance the potential of colloidal QRs in lasing applications: 1) We show gain lifetimes exceeding 300 ps at high-pump intensity; 2) We demonstrate self-assembly of colloidal QRs into densely packed, ordered stripes with micron scale width where the stripe edges themselves function as optical interfaces and which are suitable for achieving light confinement and lasing.
Results and discussion
We recently reported a high-temperature synthesis of core/shell QRs in which a spherical CdSe QD is embedded in a thick rod-shaped CdS shell.13 These core/shell QRs exhibit both high fluorescence quantum yields (up to 70%) and linearly polarized emission. A typical transmission electron microscopy image of a sample of core/shell QRs with overall diameter of 5 nm, length of 25 nm and CdSe core diameters of 3 nm is displayed in Fig. 1(a). In these QRs the CdSe core is most often located closer to one end of the rod across the rod length, rather than at the centre, resulting therefore in an asymmetric core/shell configuration. This leads to a partial charge separation occurring following photoexcitation,14 as holes are quickly localized (in less than 1 ps) inside the CdSe core region, while the electron wavefunctions extend over the full volume of the rod [Fig. 1(b)],14 a process that should be potentially advantageous for gain and lasing.8 The optical absorption spectrum of the QR sample of Fig. 1(a), dissolved in toluene, is displayed in Fig. 2(a) (the shaded spectrum), in the energy regime dominated by the CdSe core. The peak at lower energy is associated with the first electronic transition in the CdSe core, while the peak at higher energy [about 460 nm, inset of Fig. 2(a)] is associated with the lower transition in the CdS rod.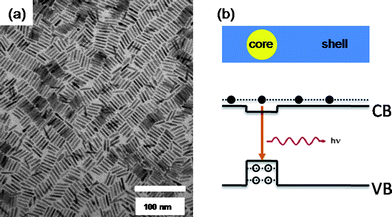 | ||
| Fig. 1 (a) A representative TEM image of CdSe/CdS core/shell QRs with 5 nm diameter and 25 nm length, deposited by drop-casting on a carbon-coated grid. (b) A simplified sketch illustrating the band alignments and electronic levels within a CdSe/CdS core/shell QR. | ||
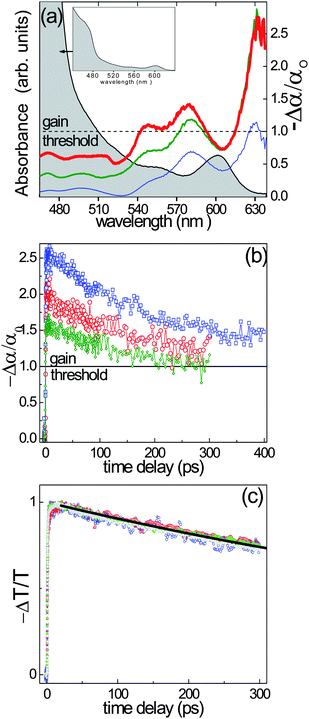 | ||
| Fig. 2 (a) Absorbance (black solid line and inset) and normalized transient absorption (−Δα/α0) spectra of a sample of CdSe/CdS QRs with 5 nm diameter and 25 nm length. The transient spectra are recorded 4 ps after excitation at different pump fluences (thin blue line: 44 μJ cm−2, medium green line: 110 μJ cm−2, thick red line: 1300 μJ cm−2). (b) Time evolution of the normalized transient absorption (−Δα/α0) at the peak of the gain for three different CdSe/CdS QR samples (red circles for QRs with 17 nm length at 620 nm probe wavelength, blue squares for QRs with 25 nm length at 630 nm, green diamonds for QRs with 50 nm length at 620 nm). The pump fluence was ∼220 μJ cm−2 in all experiments. (c) Normalized ΔT/T bleaching kinetics recorded at the band edge transition for QRs with 25 nm length for different pump fluences (blue circles: 13 μJ cm−2, red triangles: 44 μJ cm−2, magenta diamonds: 320 μJ cm−2, green squares: 780 μJ cm−2, grey triangles: 1560 μJ cm−2). Correspondingly the generated electron–hole pair per QR ranges from less than 1 to tens of pairs. The black line is an exponential fit with a time constant of about 1 ns. | ||
We evaluated the normalized absorption changes (−Δα/α0) from three different seeded growth core/shell QR samples by measuring the linear absorption and the normalized transmission changes (ΔT/T), by the pump–probe technique at different pump fluences. The pump pulse, at 390 nm, excited the CdS electronic states, injecting e–h pairs directly into the shell. After less than 1 ps a charge redistribution occurred and the excitation reached also the core,14 as evidenced by the photobleaching buildup at low energy. In all the cases studied, the experimental conditions were in the multi-exciton regime and the data provided clear evidence of a region of strong optical gain (−Δα/α0 >1) at around 620–630 nm (see Fig. 2(a) where the −Δα/α0 = 1 dashed line represents the gain threshold). Fig. 2(b) shows the kinetics of the normalized absorption changes in high fluence excitation conditions for the three QR samples. Noticeably gain was sustained, i.e. −Δα/α0 > 1, for more than 300 ps for all samples, which is a remarkably long timescale. We note that this timescale should not be confused with population decay. Population decay, considered at the band edge transition, is longer than our time window and can be fitted well with exponential kinetics, leading to a time constant of the order of 1 ns. These exponential kinetics are intensity independent [see Fig. 2(c)], suggesting that Auger recombination is nearly suppressed for our QRs. While a detailed analysis of the recombination dynamics will be reported elsewhere, we want to stress that due to this property our QRs are highly suitable candidates for lasing.
Our QRs are nearly monodisperse in terms of distributions of rod lengths and diameters,13 and once deposited on a substrate and upon evaporation of the solvent they start to self-organize into large-scale ordered superstructures that are reminiscent of nematic/smectic liquid crystal phases.15 For each of the three QR samples studied here we prepared ordered structures by drop-cast deposition on glass substrates from toluene solutions. Due to the peculiar solvent evaporation and fluid convection dynamics, usually referred to as the “coffee stain” effect,15,16 the whole process did not lead to uniform thickness of the QR film, but to well defined stripes at the film edge. This is due to the pinning of the contact line during solvent evaporation. The film thickness at the border of the dried droplet, i.e. in the outermost coffee stain ring, was between 30 and 90 nm, while the thickness immediately inside this ring was considerably smaller (∼10 nm). Optical microscope images of the film [Fig. 3(b)] showed stripes at the border of the film that were darker than the inner regions, which is due to higher QR concentration and higher film thickness in those stripes. In addition the stripes were confined by two relatively sharp and dark lines, one at the inner edge and one at the outer edge of the border region. The size of the stripes (i.e. the distance between the two dark lines) ranged from 20 to 50 μm. The stripes appeared birefringent when imaged under a polarized optical microscope [Fig. 3(c)], which could be easily explained by the stripes being made of ordered arrays of laterally aligned close-packed QRs. The mechanism leading to self-assembly of these QRs and their alignment driven by the microfluidic flow in the drop-drying process has been studied in detail by us in a recent work.15
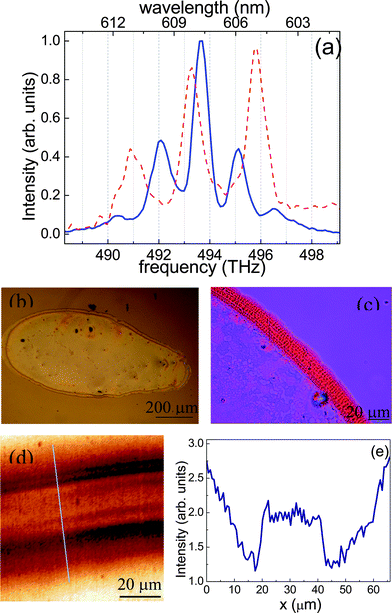 | ||
| Fig. 3 (a) Two examples of spectra of ASE modulated by a Fabry–Perot self-assembled cavity for QRs with 17 nm length. (b) Optical microscopy image of a QR film that exhibits Fabry–Perot cavity interference on the upper and lower border. (c) Image recorded with a polarized optical microscope of the stripe formed at the outer border of the QR film; the red colour corresponds to light linearly polarized parallel to the film edge, while magenta corresponds to unpolarized transmission. (d) Reflectivity image obtained with a confocal microscope (incident light at 660 nm wavelength) of the upper border of the film displayed in panel (b). (e) Signal profile along the line shown in panel (d). | ||
The QR films were pumped at normal incidence and the emission was collected at the edge of the substrate. Amplified stimulated emission (ASE) is expected from regions of the QR film which are thick enough to allow wave guiding, and which do not introduce many losses, e.g. by scattering. Such conditions were matched at the borders of the film, i.e. by the coffee stain ring where ordered and close-packed QR assemblies were formed. Fig. 4 reports the ASE (along with the normalized photoluminescence spectra) recorded under the same experimental conditions from assemblies built from the three core-shell QR samples. The spectral narrowing is clearly evident, with a full width at half maximum (FWHM) ranging from 5 to 8 nm. ASE was more efficient in films prepared from the 25 nm long QR sample, which additionally exhibited the longest gain lifetime [see Fig. 2(b)].
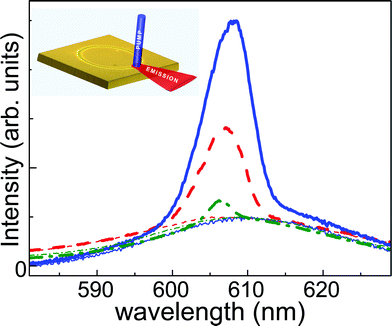 | ||
| Fig. 4 ASE spectra (thick lines) from QR films realized by drop-casting of three solutions of CdSe/CdS QRs (dashed red for QRs with 17 nm length, solid blue for QRs with 25 nm length, dash-dot green for QRs with 50 nm length). The spectra were recorded at a pump fluence of ∼3.9 mJ cm−2. The photoluminescence (PL) spectra, recorded at low pump energy, are also displayed (thin lines, same colour coding as above). The PL spectra were normalized for comparison. Inset: a simplified sketch illustrating the experimental setup. | ||
We additionally found that the dense self-assembled coffee stain ring, consisting of ordered QRs, can form Fabry–Perot micro-resonators, i.e. certain sections of the coffee stain, with two parallel planes partially reflecting the light giving rise to interference. This is manifested by the appearance of equally spaced peaks (in frequency) that modulate the ASE line shape [see Fig. 3(a)]. We observed such behaviour in many sections of the coffee stain ring. In such Fabry–Perot resonators the distances between the planes and the spacing between the peaks in the spectrum are related by the equation Δν = c0/2L′, where ν is the frequency, c0 the speed of light in vacuum and L′ is the effective distance (L′ = nL, where n the refractive index of the medium and L is the geometrical distance). According to this relation and to the detected spectra the length of the resonators (L′) in our samples ranged from 40 to 140 μm (hence we can expect L to range from ∼23 to ∼80 μm). This matches quite well with the size of the dark stripes found at the border of the drop, as mentioned above, suggesting that the dark lines behave as reflecting ends for the light travelling in plane within the stripe. This provides a full explanation for the microcavity interference effect.
Deeper insight into the structure at the edges of the stripe was gained by confocal microscopy. Two dark edges limiting the stripe are clearly visible in the reflectivity image of the stripe region [Fig. 3(d)]. The corresponding signal profile is plotted in Fig. 3(e) and indicates a strong and abrupt change of the reflectivity at the edges of the stripe, which occurred on a length scale of less than 1 μm (it is nearly resolution limited). This rapid change in reflectivity, and thus also in the refractive index, is most likely responsible for the confinement of light inside the stripe, and consequently for the Fabry–Perot effect that was observed in the ASE spectra. The Fabry–Perot effect was observed more frequently on films prepared from the shortest (17 and 25 nm long) QRs and only occasionally on coffee stain fringes formed from the longest QRs (with 50 nm length). This finding could be ascribed both to the stronger ability of shorter QRs to self-align over large areas and to the higher concentration of gaining QRs per unit area for the shorter aspect ratio QRs. The quality factor Q of these microresonators, as estimated from modulated ASE images (Q = ν/Δνc, where Δνc is the FWHM of a peak) was nearly 1000, which is a remarkably high value.
Laser action can be sustained in an optical resonator provided that the gain is greater than the loss.17 In our system, gain was relatively high and the scattering losses low, therefore a critical feature was the “mirrors”, i.e. the losses at the edges of the cavity. Such conditions were fulfilled in several regions of the coffee stain ring, which therefore behaved as self-assembled microcavities that lased under multiexciton pumping. Lasing was found in samples made by 17 nm and 25 nm long QRs. The emission spectra recorded at different pump fluences are displayed in Fig. 5. For low pump fluences only photoluminescence was observed, while for excitations higher than 3 mJ cm−2 a clear narrow peak developed, with a FWHM of ∼0.8 nm, showing lasing action. The input–output characteristics (inset of Fig. 5) indicate a threshold and a linear increase for higher input values, which are a further evidence of lasing. Note that this threshold value is one of the lowest reported so far in nanocrystal lasers12 which demonstrates the quality of our microresonator. Even though saturation was observed for significantly higher pump fluences, the lasing was stable over time and no degradation was detected after hours of operation. It is noteworthy that, to our knowledge, this represents the first example of a nanocrystal laser prepared by pure self-assembly.
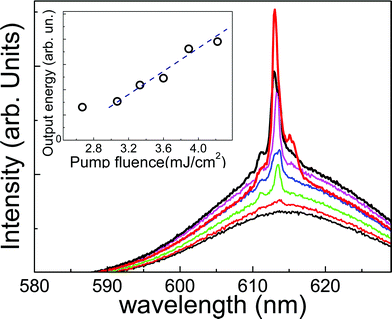 | ||
| Fig. 5 Emission spectra from a Fabry–Perot self-assembled microcavity at the border of a film made of QRs with 25 nm length, recorded at different pump fluences (in order from the bottom: 2.7, 3.1, 3.3, 3.6, 3.9, 4.2 and 5.1 mJ cm−2). Inset: emission intensity as a function of the pump fluence. | ||
Lasing from self-assembled microcavities made of asymmetric CdSe/CdS core/shell QRs and without the need of an external resonator, as reported by us, provides a way to fabricate lasers by simple solution-based techniques which are appealing for nano-photonics. Further developments in this direction could emerge from the ability to deposit colloidal nanocrystals from solution via microfluidics or via other liquid-based technologies such as ink jet printing, in which both the surface tension and the contact angle with the substrate can be carefully tuned, and by which eventually even the geometry of the active region could be engineered. This would provide a new generation of photonic devices integrated onto substrates for lab-on-a-chip or for other compact, integrated applications.
Experimental
CdSe/CdS QRs sample preparation
The QRs were prepared according to a procedure that was developed by us in a previously published work.13 For pump–probe measurements QRs were dispersed in toluene solution (concentrations of QRs were in the 10−6 molar range). Films for ASE and lasing emission were prepared by drop-casting QRs dissolved in toluene solution on a glass substrate.Laser setup
Pump–probe, ASE and lasing experiments were performed using a Ti:sapphire chirped pulse amplified source delivering pulses at a central wavelength of 780 nm, 1 KHz repetition rate, 800 μJ energy. Excitation pulses at 390 nm were obtained by doubling the fundamental wavelength in a β-barium borate (BBO) crystal. The beam was focused on a spot with 170 μm radius. Probing for pump–probe experiments was achieved by white light generation using a thin sapphire plate. Chirped-free transient transmission spectra, for different pump–probe delays, were collected using a fast optical multi-channel analyzer (OMA) with a de-chirping algorithm. In the small signal limit the normalized transmission change, ΔT/T, which was the measured quantity, was proportional to the absorbance change Δα. The time resolution of the system was ∼150 fs. The average numbers of electron-hole pairs generated at different pump intensity was calculated as reported by Lupo et al.14 ASE and lasing emission were collected from the edge and analyzed by an OMA with 0.4 nm resolution. Confocal microscopy images were recorded at a wavelength of 660 nm, obtained using a 10-nm interference filter on the white light; the resolution of the system was ∼500 nm. All measurements were performed at ambient temperature.Acknowledgements
We acknowledge Dr Angela Fiore and Dr Luigi Carbone for providing the QR samples. This project was supported in part by the Italian Ministry of Research (under contract No. RBIN048TSE) and by the EU FP7 program, through the ERC starting grant NANO-ARCH (contract number 240111).References
- S. Coe, W. K. Woo, M. Bawendi and V. Bulovic, Nature, 2002, 420, 800–803 CrossRef CAS.
- M. Kazes, D. Y. Lewis, Y. Ebenstein, T. Mokari and U. Banin, Adv. Mater., 2002, 14, 317 CrossRef CAS.
- H. J. Eisler, V. C. Sundar, M. G. Bawendi, M. Walsh, H. I. Smith and V. Klimov, Appl. Phys. Lett., 2002, 80, 4614–4616 CrossRef CAS.
- D. J. Milliron, I. Gur and A. P. Alivisatos, MRS Bull., 2005, 30, 41–44 CAS.
- V. I. Klimov, A. A. Mikhailovsky, D. W. McBranch, C. A. Leatherdale and M. G. Bawendi, Science, 2000, 287, 1011–1013 CrossRef CAS.
- A. A. Mikhailovsky, A. V. Malko, J. A. Hollingsworth, M. G. Bawendi and V. I. Klimov, Appl. Phys. Lett., 2002, 80, 2380–2382 CrossRef CAS; S. Link and M. A. El-Sayed, J. Appl. Phys., 2002, 92, 6799–6803 CrossRef CAS; A. Cretí, M. Anni, M. Zavelani-Rossi, G. Lanzani, G. Leo, F. Della Sala, L. Manna and M. Lomascolo, Phys. Rev. B: Condens. Matter Mater. Phys., 2005, 72, 125346 CrossRef.
- V. I. Klimov, S. A. Ivanov, J. Nanda, M. Achermann, I. Bezel, J. A. McGuire and A. Piryatinski, Nature, 2007, 447, 441–446 CrossRef CAS.
- J. Nanda, S. A. Ivanov, H. Htoon, I. Bezel, A. Piryatinski, S. Tretiak and V. I. Klimov, J. Appl. Phys., 2006, 99, 034309 CrossRef.
- H. Htoon, J. A. Hollingsworth, R. Dickerson and V. I. Klimov, Phys. Rev. Lett., 2003, 91, 227401 CrossRef CAS.
- H. Htoon, J. A. Hollingworth, A. V. Malko, R. Dickerson and V. I. Klimov, Appl. Phys. Lett., 2003, 82, 4776–4778 CrossRef CAS.
- A. Cretí, M. Zavelani-Rossi, G. Lanzani, M. Anni, L. Manna and M. Lomascolo, Phys. Rev. B: Condens. Matter Mater. Phys., 2006, 73, 165410 CrossRef.
- A. V. Malko, A. A. Mikhailovsky, M. A. Petruska, J. A. Hollingsworth, H. Htoon, M. G. Bawendi and V. I. Klimov, Appl. Phys. Lett., 2002, 81, 1303–1305 CrossRef CAS; M. A. Petruska, A. V. Malko, P. M. Voyles and V. I. Klimov, Adv. Mater., 2003, 15, 610–613 CrossRef CAS; P. T. Snee, Y. H. Chan, D. G. Nocera and M. G. Bawendi, Adv. Mater., 2005, 17, 1131–1136 CrossRef; Y. Chan, J. S. Steckel, P. T. Snee, J. M. Caruge, J. M. Hodgkiss, D. G. Nocera and M. G. Bawendi, Appl. Phys. Lett., 2005, 86, 073102 CrossRef; J. Schäfer, J. P. Mondia, R. Sharma, Z. H. Lu, A. S. Susha, A. L. Rogach and L. J. Wang, Nano Lett., 2008, 8, 1709–1712 CrossRef CAS; Y. Chan, J. M. Caruge, P. T. Snee and M. G. Bawendi, Appl. Phys. Lett., 2004, 85, 2460–2462 CrossRef CAS; V. C. Sundar, H. J. Eisler, T. Deng, Y. T. Chan, E. L. Thomas and M. G. Bawendi, Adv. Mater., 2004, 16, 2137–2141 CrossRef CAS; C. Zhang, F. Zhang, T. Zhu, A. Cheng, J. Xu, Q. Zhang, S. E. Mohney, R. H. Henderson and Y. A. Wang, Opt. Lett., 2008, 33, 2437–2439 Search PubMed; H. C. Hsu, C. Y. Wu and W. F. Hsieh, J. Appl. Phys., 2005, 97, 064315 CrossRef; J. F. Xu and M. Xiao, Appl. Phys. Lett., 2005, 87, 173117 CrossRef.
- L. Carbone, C. Nobile, M. De Giorgi, F. D. Sala, G. Morello, P. Pompa, M. Hytch, E. Snoeck, A. Fiore, I. R. Franchini, M. Nadasan, A. F. Silvestre, L. Chiodo, S. Kudera, R. Cingolani, R. Krahne and L. Manna, Nano Lett., 2007, 7, 2942–2950 CrossRef CAS.
- M. G. Lupo, F. Della Sala, L. Carbone, M. Zavelani-Rossi, A. Fiore, L. Luer, D. Polli, R. Cingolani, L. Manna and G. Lanzani, Nano Lett., 2008, 8, 4582–4587 CrossRef CAS.
- C. Nobile, L. Carbone, A. Fiore, R. Cingolani, L. Manna and R. Krahne, J. Phys.: Condens. Matter, 2009, 21, 264013 CrossRef.
- R. D. Deegan, O. Bakajin, T. F. Dupont, G. Huber, S. R. Nagel and T. A. Witten, Nature, 1997, 389, 827–829 CrossRef CAS; R. D. Deegan, O. Bakajin, T. F. Dupont, G. Huber, S. R. Nagel and T. A. Witten, Phys. Rev. E: Stat. Phys., Plasmas, Fluids, Relat. Interdiscip. Top., 2000, 62, 756–765 CrossRef CAS.
- O. Svelto, Principles of Lasers, Springer, New York, 1998 Search PubMed.
Footnote |
| † These authors contributed equally to the work |
| This journal is © The Royal Society of Chemistry 2010 |
