Plum-branch-like carbon nanofibers decorated with SnO2 nanocrystals†
Zunxian
Yang
abc,
Guodong
Du
a,
Zaiping
Guo
*ad,
Xuebin
Yu
*ae,
Sean
Li
f,
Zhixin
Chen
d,
Peng
Zhang
a and
Huakun
Liu
a
aInstitute for Superconducting & Electronic Materials, University of Wollongong, NSW 2522, Australia
bDepartment of Electronics Science and Technology, Fuzhou University, Fuzhou 350108, P. R. China
cKey Laboratory of Analysis and Detection Technology for Food Safety of the Ministry of Education, Fuzhou University, Fuzhou 350002,
P. R. China
dSchool of Mechanical, Materials & Mechatronics Engineering, University of Wollongong, NSW 2522, Australia
eDepartment of Materials Science, Fudan University, Shanghai 200433, P. R. China
fSchool of Materials Science and Engineering, University of New South Wales, NSW 2052, Australia
First published on 5th May 2010
Abstract
Novel plum-branch-like carbon nanofibers (CNFs) decorated with SnO2 nanocrystals have been synthesized by electrospinning and subsequent thermal treatment in an Ar/H2O atmosphere. The morphologies of the as-synthesized SnO2/CNF composites and the contents of carbon and SnO2 can be controlled by adjusting the heat treatment temperature. It is proposed that the growth of SnO2/CNF composites follows the outward diffusion of tin composites from the as-spun tin composite/polyacrylonitrile (PAN) nanofibers, pyrolysis of PAN and oxidation of tin composites, and then formation of SnO2 nanocrystals around the CNFs. This novel 1D SnO2/CNF composite may have potential application in nanobatteries, nano fuel cells, and nanosensors. A preliminary result has revealed that the SnO2/CNF composite presents favourable electrochemical performance in lithium-ion batteries.
1. Introduction
Tin dioxide, as one of the most widely used photoelectronic functional materials, has received particular interest because of its potential applications in various fields, such as gas sensors,1,2 electrodes for lithium-ion batteries,3 dye-sensitized solar cells,4 transparent conducting electrodes,5 transistors,6 catalysts,7 supercapacitors,8 and so forth. Recently, one-dimensional carbon nanotube (CNT)/carbon nanofiber (CNF) based composites have attracted great attention owing to their fantastic properties and promising applications9–12via the introduction of CNTs or CNFs into other materials.As one of the most useful CNT/CNF based materials, the SnO2/CNT or CNF composite has attracted more and more attention from researchers because of its unique optical and electrical properties, as well as potential applications in sensors, lithium-ion batteries, catalysts, etc. Several synthesis methods, such as the hydrothermal method,13 the chemical-solution route,14–16 the chemical vapor phase method,17 and the template method,18 have been developed to form one-dimensional SnO2/CNT or CNF composites. However, some of these SnO2-based nanomaterials are either formed separately from the 1D carbonaceous matrices in different steps19 or prepared by a template method.20,21 Others are very expensive due to the complicated process or the special starting material.17 Therefore, searching for simpler approaches to prepare favorable one-dimensional nanostructured materials with SnO2 nanocrystals uniformly dispersed on the surface of CNT/CNF carbonaceous matrices is still challenging.
Herein, we report a relatively simple and low-cost approach to prepare novel plum-branch-like carbon nanofibers decorated with SnO2 nanocrystals by a combination of electrospinning and subsequent thermal treatment in an Ar/H2O atmosphere. The greatest advantage of this method is that the CNFs and the decorating SnO2 crystals are formed at the same time via the introduction of water vapor during the heat treatment. Furthermore, the temperature dependence of both the SnO2 crystal size and morphology, the possible growth mechanism, etc. are discussed in detail.
2. Experimental
2.1 Preparation of 1D plum-branch-like SnO2/CNF composites
The 1D SnO2/CNF composites were synthesized by a combination of electrospinning and subsequent thermal treatment with the merit of the simultaneous formation of CNFs and the decorating SnO2 nanocrystals. After many tentative experiments, a polyacrylonitrile (PAN, MW = 150![[hair space]](https://www.rsc.org/images/entities/char_200a.gif) 000, Aldrich) solution (7 wt%) was selected for the electrospinning process. In a typical experiment, polyacrylonitrile was dissolved in N,N-dimethylformamide (DMF, 99.8%, Aldrich) at 80 °C with vigorous stirring for 2 h, followed by adding tin(II) chloride dihydrate (95%, Sigma) to obtain a transparent light-yellow solution. The mixed solution was then stirred at room temperature for at least 3 h. The polymer solution was transferred into a 10 ml syringe with a capillary tip (0.8 mm diameter). For spinning, the set-up, as shown in Scheme s1,† is similar to that described previously.22 Typically, the collector was placed 8 cm from the spinneret to collect the nanofibers. A high voltage of 16 kV was supplied at the spinneret by a direct-current power supply (DW-P303-5ACCD, Tianjin Dongwen High Voltage Power Supply Co., China). The solution was pushed out of the spinneret by a syringe pump (TS2-60, Baoding Lange Constant Flux Pump Co., China) at the rate of 1.0 ml h−1. The collector was kept at 180 °C during electrospinning to evaporate the solvent. After spinning for more than six hours, the nanofiber film was easily peeled off. According to the thermogravimetric analysis (TGA) results on the PAN (see Fig. S1 of the ESI†), the electrospun nanofibers were treated at various temperatures (see Table 1) for 3 h in Ar/H2O atmosphere (heating rate: less than 1 °C min−1). Finally, a black film (the plum-branch-like SnO2/CNF composite) was then obtained. Thus, eight samples named S11, S12, S13, S14, S21, S22, S23 and S24, were prepared as summarized in Table 1.
000, Aldrich) solution (7 wt%) was selected for the electrospinning process. In a typical experiment, polyacrylonitrile was dissolved in N,N-dimethylformamide (DMF, 99.8%, Aldrich) at 80 °C with vigorous stirring for 2 h, followed by adding tin(II) chloride dihydrate (95%, Sigma) to obtain a transparent light-yellow solution. The mixed solution was then stirred at room temperature for at least 3 h. The polymer solution was transferred into a 10 ml syringe with a capillary tip (0.8 mm diameter). For spinning, the set-up, as shown in Scheme s1,† is similar to that described previously.22 Typically, the collector was placed 8 cm from the spinneret to collect the nanofibers. A high voltage of 16 kV was supplied at the spinneret by a direct-current power supply (DW-P303-5ACCD, Tianjin Dongwen High Voltage Power Supply Co., China). The solution was pushed out of the spinneret by a syringe pump (TS2-60, Baoding Lange Constant Flux Pump Co., China) at the rate of 1.0 ml h−1. The collector was kept at 180 °C during electrospinning to evaporate the solvent. After spinning for more than six hours, the nanofiber film was easily peeled off. According to the thermogravimetric analysis (TGA) results on the PAN (see Fig. S1 of the ESI†), the electrospun nanofibers were treated at various temperatures (see Table 1) for 3 h in Ar/H2O atmosphere (heating rate: less than 1 °C min−1). Finally, a black film (the plum-branch-like SnO2/CNF composite) was then obtained. Thus, eight samples named S11, S12, S13, S14, S21, S22, S23 and S24, were prepared as summarized in Table 1.
| Sample number | Electrospinning formulae | Heat treatment temperatures/°C | The average diameters of as-synthesized nanofibers/nm | The average grain sizes of the SnO2 particles/nm | ||
|---|---|---|---|---|---|---|
| PAN/g | Tin(II) chloride dihydrate/g | DMF/g | ||||
| S11 | 0.7 | 0.5 | 8.8 | 500 | 250 | 60 |
| S12 | 0.7 | 0.5 | 8.8 | 530 | 350 | 90 |
| S13 | 0.7 | 0.5 | 8.8 | 550 | 400 | 100 |
| S14 | 0.7 | 0.5 | 8.8 | 600 | 100 | 100 |
| S21 | 0.7 | 0.8 | 8.5 | 500 | 120 | 65 |
| S22 | 0.7 | 0.8 | 8.5 | 530 | 200 | 95 |
| S23 | 0.7 | 0.8 | 8.5 | 550 | 150 | 75 |
| S24 | 0.7 | 0.8 | 8.5 | 600 | 150 | 120 |
2.2 Materials characterization
The morphology was evaluated using JEOL 7500FA field-emission scanning electron microscope (FE-SEM, JEOL, Tokyo, Japan) and a JEOL 2011F transmission electron microscope (TEM, JEOL, Tokyo, Japan). The composition and crystal structures of the SnO2/CNF composite were obtained by X-ray diffraction (XRD) (MMA, GBC, Australia) and energy dispersive X-ray spectroscopy (EDX, JEOL 7500FA). X-Ray photoelectron spectroscopy (XPS) experiments were carried out on a VG Scientific ESCALAB 220IXL instrument using Al Kα X-ray radiation. Raman spectroscopy was conducted on a Renishaw inVia Raman Microscope using the green light of an Ar laser (514 nm). Thermogravimetric analysis (TGA) of the PAN was carried out with a TGA/DSC1 type instrument (METTLER TOLEDO, Switzerland) at a heating rate of 10 °C min−1 from 25 to 1000 °C in Argon.2.3 Electrochemical characterization
Electrochemical evaluations were carried out using CR2032 coin-type cells. The working electrodes were formed by mixing the as-prepared SnO2/CNF composites, carbon black (Super P, MMM, Belgium), and poly(vinyl difluoride) (PVDF) at a weight ratio of 70![[thin space (1/6-em)]](https://www.rsc.org/images/entities/char_2009.gif) :
:![[thin space (1/6-em)]](https://www.rsc.org/images/entities/char_2009.gif) 15
15![[thin space (1/6-em)]](https://www.rsc.org/images/entities/char_2009.gif) :
:![[thin space (1/6-em)]](https://www.rsc.org/images/entities/char_2009.gif) 15 and pasting them on copper foil, while pure lithium metal was used for the counter electrodes. The electrolyte consisted of a solution of 1 M L−1 LiPF6 in ethylene carbonate (EC)/dimethyl carbonate (DMC, 1
15 and pasting them on copper foil, while pure lithium metal was used for the counter electrodes. The electrolyte consisted of a solution of 1 M L−1 LiPF6 in ethylene carbonate (EC)/dimethyl carbonate (DMC, 1![[thin space (1/6-em)]](https://www.rsc.org/images/entities/char_2009.gif) :
:![[thin space (1/6-em)]](https://www.rsc.org/images/entities/char_2009.gif) 1, by volume) (MERCK KgaA, Germany). Coin cells were assembled in a high-purity argon-filled glovebox (Mbraun, Unilab, Germany). Charge and discharge were conducted at 100 m Ag−1 between cut-off potentials of 0.05 and 1.5 V. (The first cycle was between 0.05 V and 2.5 V vs. Li+/Li.)
1, by volume) (MERCK KgaA, Germany). Coin cells were assembled in a high-purity argon-filled glovebox (Mbraun, Unilab, Germany). Charge and discharge were conducted at 100 m Ag−1 between cut-off potentials of 0.05 and 1.5 V. (The first cycle was between 0.05 V and 2.5 V vs. Li+/Li.)
3. Results and discussion
The field-emission scanning electron microscopy (FESEM) images shown in Fig. 1 illustrate the morphologies of the as-collected tin composite/PAN nanofibers calcined at 500, 530, 550, and 600 °C for 3 h in Ar/H2O atmosphere, respectively. Fig. 1(a)–(d) displays the morphologies of samples (S11, S12, S13 and S14) with 5% tin(II) chloride dihydrate in the electrospinning solution under different temperatures, respectively, while Fig. 1(e)–(h) shows the morphologies of samples (S21, S22, S23 and S24) with 8% tin(II) chloride dihydrate. In S11 calcined at 500 °C (see Fig. 1(a) inset and Fig. S2(a)†), the majority of SnO2 crystals, with average grain sizes of ∼60 nm, are partly embedded into the CNFs and cover the most of the surface area of the CNFs, whose average diameters are around 250 nm, as listed in Table 1. With increasing treatment temperature, as shown in Fig. 1(b), there is an increase of the quantity of SnO2 crystals without direct contact with the CNFs (see Fig. S2(b)–(d)†), and the average diameters of the CNFs increase to about 350 nm after calcining at 530 °C. The average diameter increases further to a maximum value of ∼400 nm [Fig. 1(c)] when calcination is at 550 °C. Simultaneously, the average grain sizes of SnO2 formed on the surface of the CNFs increase to ∼90 nm in S12 (see Fig. 1(b) and inset) and ∼100 nm in S13 (see Fig. 1(c) and inset), respectively. This phenomenon of diameter increase in the CNFs possibly results from the outward diffusion of the tin composite and formation of more SnO2 nanocrystals in the outer layers of the carbon nanofibers with increasing treatment temperature. When the calcination temperature is increased to 600 °C [S14, Fig. 1(d)], the beautiful plum-branch-like CNFs decorated with SnO2 nanocrystals appear, and the average diameter of the CNFs obviously reverts to ∼100 nm [Fig. 1(d)], which may be due to the overflow of most of the tin composite from the CNFs or to a partial oxidation–reduction reaction between the carbon and the SnO2, with some consumption of carbon matrices in CNFs when the carbonization temperature reaches around 600 °C.23,24 As for S21, S22, S23 and S24 (see Fig. 1(e)–(h) and insets), similarly, with increasing treatment temperature, the average diameters of the CNFs increase from ∼120 nm (see Fig. 1(e) and inset) to ∼200 nm (see Fig. 1(f) and inset), and finally revert to ∼150 nm (see Fig. 1(g)–(h) and insets). Nevertheless, more SnO2 nanocrystals grow on the surface of CNFs, and some SnO2 crystals even fall off the CNFs (see Fig. S2(e)–(h)†). However, as compared with Fig. 1(a)–(d), the diameter-reversion phenomenon of CNFs at lower treatment temperature, as well as more SnO2 crystals around the CNFs in Fig. 1(e)–(h), possibly arises from their higher tin content in the starting materials. X-Ray diffraction (XRD) analysis of the as-synthesized CNFs decorated with SnO2 nanocrystals clearly reveals the diffraction pattern of a tetragonal rutile structure (JCPDS 41-1445) belonging to the space group P42/mnm (136) with lattice parameters of a = b = 4.7386 Å and c = 3.1872 Å (see Fig. 2).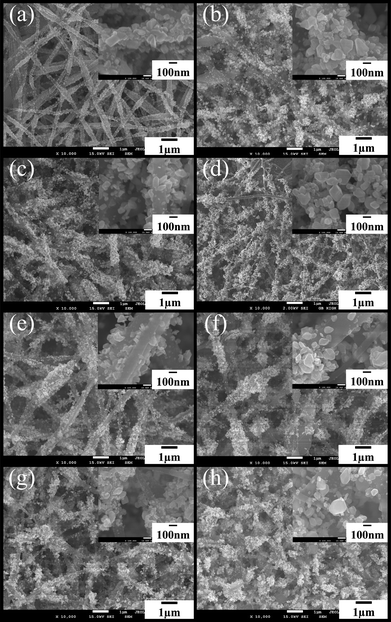 | ||
| Fig. 1 FE-SEM images of CNFs decorated with SnO2 nanocrystals: (a) S11, (b) S12, (c) S13, (d) S14, (e) S21, (f) S22, (g) S23, (h) S24, eight samples as-pyrolysed in an Ar/H2O environment. (The insets are high-resolution images). | ||
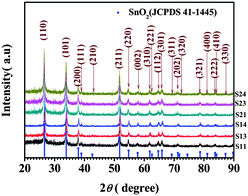 | ||
| Fig. 2 X-Ray diffraction patterns of as-prepared CNFs decorated with SnO2 nanocrystals. The diffraction peaks indicate a tetragonal rutile structure for the SnO2 (JCPDS 41–1445), as indexed in the pattern. | ||
The TEM images depicted in Fig. 3 provide a clear observation of the as-synthesized S13 and S23 samples. Fig. 3(a)–(b) displays the TEM bright-field image of the sample S13, combined with selected area electronic diffraction (SAED) (see Fig. 3(b) inset), which reveals the fine microstructure of the CNFs decorated with many SnO2 crystals, in good accordance with the FE-SEM results shown above. This typical crystal SAED spot pattern (see Fig. 3(b) inset) from one large SnO2 particle indicates that those SnO2 particles attached to the CNFs are crystalline. However, due to their small crystal size, the SnO2 crystals are characterized by a polycrystalline ring-shaped SAED pattern, as shown in the Fig. 3(c) inset. The spotted diffraction rings from the inside to outside were indexed to the (110), (101), (200), (211), and (301) planes of rutile SnO2, which are in good agreement with the XRD results described above. The characteristics of CNFs decorated with SnO2 nanocrystals can be further verified by the SnO2 crystal lattice fringes in the high-resolution TEM (HRTEM) image [see Fig. 3(e)]. Only a few crystals have revealed clear lattice fringes in the HRTEM, while other areas without lattice fringes are present. These areas could be carbon regions or crystals whose orientations are not parallel to the electron beam. Fig. S3 of the ESI† shows some naked CNFs with only a few SnO2 nanocrystals outside (Fig. S3(a)–(b)†) and inside the CNFs (Fig. S3(c)†). This was possibly because the ultrasonic process during sample preparation for TEM measurements caused SnO2 nanocrystals to fall off the CNFs. Those SnO2 nanocrystals left inside and outside the CNFs in Fig. S3† further confirm that the tin composite in the as-spun tin composite/PAN nanofibers experienced diffusion outward from the nanofibers, and pyrolysis and oxidation in the outer layers of the CNFs in turn, followed by the formation of SnO2 nanocrystals in the outer layer or on the surface of CNFs. Fig. S4 of the ESI† reveals chemical information on the as-prepared CNFs decorated with SnO2 nanocrystals via energy dispersive X-ray (EDX) spectra. The nanofibers mainly include the elements of Sn, C, and O, which is in good agreement with the TEM and XRD results. The weak copper signals possibly come from the copper tape used for the FE-SEM measurement. After comparing the carbon contents as shown in the insets in Fig. S4(a)–(d),† the heat treatment at 500, 530, 550, and 600 °C for 3 h in an Ar/H2O atmosphere, respectively, led to an obvious decrease in the carbon content from 46.11% to 34.29%, a further decrease down to the minimum value, 16.88%, and then a reversion to 35.24%. The decreasing carbon content with increasing treatment temperature at first is possibly due to some degree of water gas reaction or an oxidation–reduction reaction between the carbon and H2O or remnant oxygen in the argon, or to the SnO2 distribution in the samples (i.e., the SnO2 proportion inside or outside the CNFs, see Fig. 1). The final increase in the carbon content is partly due to different consumption of carbon and SnO2via the chemical reaction between them at higher treatment temperatures23,24 because of the equal-molar-ratio reaction between carbon and SnO2, but the much larger molecular weight of SnO2. These FE-SEM, TEM, XRD, and EDX results together confirm that this SnO2/CNF composite consists of plum-branch-like CNFs decorated with SnO2 nanocrystals. These decorating SnO2 nanocrystals, originating from the outward diffusion, pyrolysis, and oxidation of the tin composite in the as-spun nanofibers, finally form in the outer layer or on the surface of the CNFs.
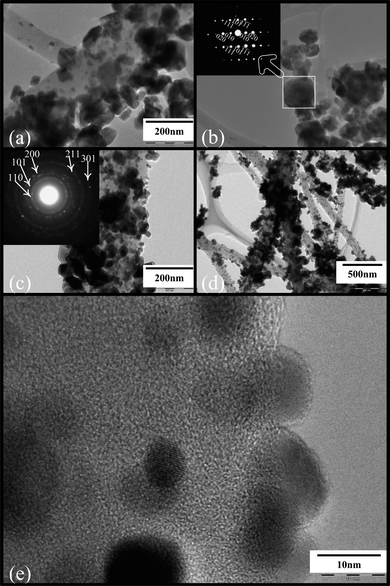 | ||
| Fig. 3 (a) Low-magnification TEM image of S13. (b) TEM image and SAED pattern (inset) of S13. (c) TEM image and SAED pattern (inset) of S23. (d) Low-magnification TEM image of S23. (e) HRTEM image of a section of S23. | ||
The Raman spectra shown in Fig. S5 of the ESI† further confirm the rutile structure of the as-synthesized SnO2. Further, three normal phonon modes,25Eg, A1g, and B2g, which usually appear in large single crystals or bulk polycrystalline SnO2 materials, are detected at frequency shifts of 472.1, 624.7 and 778.1 cm−1, respectively, in S13 and S23 because of their higher SnO2 content. As compared with the Raman shift results in SnO2 nanowires in our previous report26 at 477, 636, and 775 cm−1, some downwards shift of Eg, A1g, and a small upwards shift of B2g for these SnO2/CNF composites could result from the specific nanoscale structure, with SnO2 nanocrystals on the surface of the CNFs to form one-dimensional materials.27 Additionally, two obvious peaks at 1355 and 1593 cm−1 are assigned to the disordered band (D-band) and the graphene band (G-band), respectively.28–31 With increasing treatment temperature, the relative intensity ratio of the G-band to the D-band is enhanced because of the advantages of transforming the disordered carbon into graphene carbon at higher treatment temperatures.
To reveal the presence and oxidation states of tin and carbon in the SnO2/CNF composite, X-ray photoelectron spectroscopy (XPS) analysis was conducted from 0 to 1100 eV for S11, S14, and S23, respectively. Obvious C1s, O1s, and Sn3d peaks were detected, and their high-resolution spectra are shown in Fig. 4 (S11 and S14) and Fig. S6 (S23),† respectively. Fig. 4(a) displays the high-resolution spectrum of the C1s region of S11 fitted to five peaks, including un-oxidized graphitic (sp2) carbon. The three large peaks at 283.95, 284.33 and 284.69 eV are possibly attributable to graphitic carbon containing a polyaromatic layered structure,32,33 while the peak at 285.13 eV should probably be assigned to disordered carbon.32 Some oxidized carbon functions are also found due to the higher binding energy (BE) peak at 286.14 eV assigned to the oxidized carbon present in alcohol. However, for the C1s regions of S14 and S23 shown in Fig. 4(b) and Fig. S6(a),† respectively, even though there are slight differences in the binding energy and intensity of the five fitted peaks, with increasing treatment temperatures, the intensities of those peaks related to graphitic carbon at lower binding energy are enhanced, while in contrast, those concerned with disordered carbon and oxidized carbon are reduced. As shown in Fig. 4(c), a pronounced O1s response occurred from 530–532 eV. A portion could come from unreduced SnO2, as evidenced by the O1s BE peak at ∼530.66 eV,32,33 while the peak at 531.2 eV may be due to the OH− radical, adsorbed oxygen.32 As for the high BE peak at 532.18 eV, it may be attributed to some oxygen in carbon oxide functions, which is in good accordance with the fitted C1s peaks in Fig. 4(a). For the O1s regions of S14 and S23 shown in Fig. 4(d) and Fig. S6(b),† respectively, the intensities of those O1s peaks related to SnO2 increase, and those related to the OH− radical, adsorbed oxygen, decrease, as compared with Fig. 4(c), which are in good agreement with the EDX results described above. The Sn3d spectrum [Fig. 4(e)] for S11 comprises two symmetrical peaks with BEs at 487.03 eV and 495.46 eV, which are attributable to Sn3d5/2 and Sn3d3/2, respectively. The separation between these two peaks is 8.43 eV, in good agreement with the energy splitting reported for SnO2.34–36 As for the Sn3d region of S14 and S23, even though there are slight differences in the binding energies of the two symmetrical peaks relating to Sn3d5/2 and Sn3d3/2, the separations between the two peaks are 8.46 and 8.44 eV, respectively, which are approximately the same as for S11. In all, the XPS results confirm that the as-prepared SnO2/CNF composites are composed of pure SnO2 and carbon, except for some adsorbed water or OH− on their surfaces. Additionally, part of the carbon binds with the SnO2 by means of C–O or C![[double bond, length as m-dash]](https://www.rsc.org/images/entities/char_e001.gif) O to form this particular structure, i.e. one-dimensional CNFs decorated with SnO2 nanocrystals.
O to form this particular structure, i.e. one-dimensional CNFs decorated with SnO2 nanocrystals.
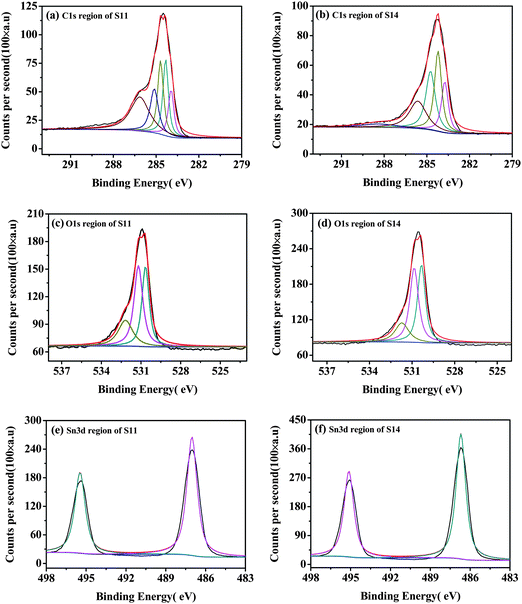 | ||
| Fig. 4 High-resolution XPS spectra of the C1s, O1s and Sn3d regions of S11 (left) and S14 (right), respectively. | ||
As for the formation of this novel 1D material, one possible growth mechanism, the solid diffusion-pyrolysis-oxidation growth mechanism (SDPOGM), is put forward to explain the formation of these plum-branch-like carbon nanofibers decorated with SnO2 nanocrystals on their surface as shown in Scheme 1. At first, the tin compound, SnCl2, exists homogenously as molecules or molecular agglomerates in the as-spun tin composite/PAN nanofibers at room temperature [see Scheme 1(a)]. With increasing temperature, the diffusion capability of SnCl2 is enhanced greatly [see Scheme 1(b)] and then, more SnCl2 molecules or molecular aggregates can diffuse to the outer layer or the surface of the tin composite/PAN nanofiber, where concentration of SnCl2 molecules or molecular aggregates decrease because of more consumption during their contacting and reacting with H2O vapor around nanofibers at higher temperature effectively as follows:37
| SnCl2 + 2H2O → SnO2 + 2HCl↑ + H2↑ | (1) |
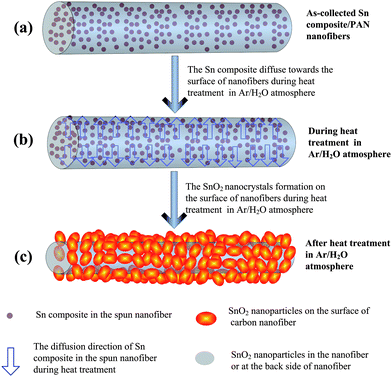 | ||
| Scheme 1 Schematic diagram showing the proposed growth mechanism for CNFs decorated with SnO2 nanocrystals during the heat treatment in the Ar/H2O atmosphere. | ||
Successful growth of plum-branch-like CNFs decorated with SnO2 nanocrystals is very unique both for fundamental study of new nanostructures and for creation of novel functional devices or photoelectronic application. One of the attractive features of these SnO2/CNF composites is that their sizes (the average diameters of CNFs and the average grain size of SnO2 nanocrystals) and their contents (carbon and SnO2) are tunable to some extent by adjusting the concentrations of starting materials and the subsequent temperature of heat treatment in the Ar/H2O atmosphere. In addition, these SnO2 nanocrystals on the surface of the CNFs can be very densely and tightly distributed around the CNFs or loosely decorate the CNFs to form completely different morphologies of SnO2/CNF composite through simple control of their heat treatment temperature in the Ar/H2O atmosphere. Furthermore, the fabrication process is simple and cost-effective; the composite is synthesized by a simple combination of electrospinning and the subsequent heat treatment in an Ar/H2O atmosphere. It is very advantageous to form the CNFs and the decorating SnO2 crystals on the surface of CNFs at the same time via simple introduction of water vapor during the heat treatment. The 1D plum-branch-like SnO2/CNF composite with the characteristic of highly separate SnO2 nanocrystals surrounding the CNFs has many advantages, such as porosity, large surface-to-volume ratio, good conductivity, etc., and has many potential applications such as in electrochemistry, gas sensing, solar energy, catalysts, and so forth. The advantages offered by this unique nanostructure include dramatically accelerated transport of gas/liquid in these loosely-distributed materials; significantly increased active surface areas for chemically or biologically selective catalysis; dramatically enhanced transport of ionic and electronic charge in the solid state due to both shorter diffusion lengths in this 1D novel material and introduction of 1D CNFs with good conductivity.
The cycling performance of SnO2/CNF composite electrodes (S13 and S23) from the first cycle to the 30th cycle was obtained at a constant current of approximately 100 m Ag−1, with a cut-off voltage window of 0.05 V to 1.5 V (versus Li/Li+), is shown in Fig. 5. The SnO2/CNF composites, S13 and S23, delivered high Li+ storage and a larger initial reversible capacity of 913 and 936 m Ahg−1 for the first cycle, respectively, as shown in Fig. 5(a) and (b). Additionally, the two samples display an initial coulombic efficiency of approximately 62.67% and 56.35%, respectively, which are obviously higher than that of SnO2 nanowire26 (46.91%). Moreover, the S13 and S23 samples present high reversible capacity (539.4 and 529.1 mAhg−1 after 30 cycles), as shown in Fig. 5(c). Further electrochemical properties relating to the charge/discharge mechanism of these novel SnO2/CNF composite electrodes, as determined by cyclic voltammetry and rate capabilities, and some other photoelectronic properties relating to gas sensing and catalysis are still being studied and will be reported in subsequent communications.
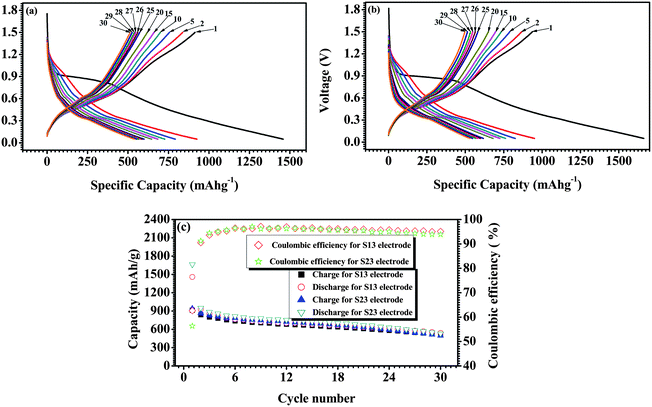 | ||
| Fig. 5 Electrochemical performance of a SnO2 nanocrystal-decorated carbon nanofiber electrode cycled between 0.05 and 1.5 V vs. Li+/Li. (The first cycle was between 0.05 V and 2.5 V vs. Li+/Li.) (a) Voltage profiles of S13 electrode at the cycling rate of 100 m Ag−1. (b) Voltage profiles of S23 electrode at the cycling rate of 100 m Ag−1. (c) Capacity–cycle number curves of S13 and S23 electrodes at the cycling rate of 100 m Ag−1. | ||
4. Conclusions
We have successfully synthesized a novel type of nanostructured material, plum-branch-like carbon nanofibers decorated with SnO2 nanocrystals, by a simple combination of electrospinning and subsequent thermal treatment in an Ar/H2O atmosphere. Both the average grain sizes of SnO2 nanocrystals and the average diameters of CNFs are tunable to some extent, depending not only on the concentration of starting materials used for electrospinning, but also on the temperature of heat treatment in Ar/H2O atmosphere. Additionally, the morphologies of as-synthesized SnO2/CNFs composites, and the content of carbon and SnO2 in the composites can be controlled by simply adjusting the heat treatment temperature. Several characterization techniques revealed that each SnO2 particle around the CNFs is actually one nanocrystal with rutile structure. It is proposed that the growth of SnO2/CNF composites follows the outward diffusion of tin composite from the as-spun tin composite/PAN nanofibers, pyrolysis of PAN and the oxidation of tin composite, and then formation of SnO2 nanocrystals around the CNFs in turn, while the water vapor in the heat treatment may play a crucial role in during the growth process. This novel 1D SnO2/CNF composite may have potential application in nanobatteries, nano fuel cells, and nanosensors. As an example, preliminary investigation of this SnO2/CNFs composite has shown good electrochemical performance, exhibiting its potential application as an anode material for lithium-ion batteries.Acknowledgements
Part of the work was funded by an Australian Research Council (ARC) Linkage Grant (LP0775456), the Postdoctoral Foundation Program of Fuzhou University (BSH-0601), the Natural Science Foundation Program of Fujian Province (A0510011), and the Talents Foundation Program of Fuzhou University. The authors also would like to thank Dr Tania Silver at the University of Wollongong for critical reading of the manuscript and Mr. Attard Darren for his great contribution. Furthermore, the authors are grateful to Dr Sean Li at the University of New South Wales for his contributions to the XPS and Raman experiments.References
- M. N. Rumyantseva, A. M. Gaskov, N. Rosman, T. Pagnier and J. R. Morante, Chem. Mater., 2005, 17, 893–901 CrossRef CAS.
- F. Song, H. Su, J. Han, D. Zhang and Z. Chen, Nanotechnology, 2009, 20, 495502 CrossRef.
- Y. Idota, T. Kubota, A. Matsufuji, Y. Maekawa and T. Miyasaka, Science, 1997, 276, 1395–1397 CrossRef CAS.
- S. Gubbala, V. Chakrapani, V. Kumar and M. K. Sunkara, Adv. Funct. Mater., 2008, 18, 2411–2418 CrossRef CAS.
- S. U. Lee, W. S. Choi and B. Hong, Phys. Scr., 2007, t129, 312–315 CrossRef CAS.
- E. N. Dattoli, Q. Wan, W. Guo, Y. Chen, X. Pan and W. Lu, Nano Lett., 2007, 7(8), 2463–2469 CrossRef CAS.
- X. Cui, F. Cui, Q. He, L. Guo, M. Ruan and J. Shi, Fuel, 2010, 89, 372–377 CrossRef CAS.
- R. K. Selvan, I. Perelshtein, N. Perkas and A. Gedanken, J. Phys. Chem. C, 2008, 112, 1825–1830 CrossRef CAS.
- K. Woan, G. Pyrgiotakis and W. Sigmund, Adv. Mater., 2009, 21, 2233–2239 CrossRef CAS.
- H. X. Zhang, C. Feng, Y. C. Zhai, K. L. Jiang, Q. Q. Li and S. S. Fan, Adv. Mater., 2009, 21, 2299–2304 CrossRef CAS.
- A. Yang, X. Tao, R. Wang, S. Lee and C. Surya, Appl. Phys. Lett., 2007, 91, 133110 CrossRef.
- N. J. Pinto, K. V. Carrasquillo, C. M. Rodd and R. Agarwal, Appl. Phys. Lett., 2009, 94, 083504 CrossRef.
- Z. Wen, Q. Wang, Q. Zhang and J. Li, Adv. Funct. Mater., 2007, 17, 2772–2778 CrossRef CAS.
- N. Du, H. Zhang, X. Ma and D. Yang, Chem. Commun., 2008, 6182–6184 RSC.
- J. Gong, J. Sun and Q. Chen, Sens. Actuators, B, 2008, 130, 829–835.
- R. Wei, K. Du, X. Gong, Q. Chen, Z. Tang, J. You, L. Li and H. Yang, Appl. Surf. Sci., 2009, 255, 6464–6467 CrossRef CAS.
- Q. Kuang, S. F. Li, Z. X. Xie, S. C. Lin, X. H. Zhang, S. Y. Xie, R. B. Huang and L. S. Zheng, Carbon, 2006, 44, 1166–1172 CrossRef CAS.
- N. Zhao, G. Wang, Y. Huang, B. Wang, B. Yao and Y. Wu, Chem. Mater., 2008, 20, 2612–2614 CrossRef CAS.
- Z. Ying, Q. Wan, H. Cao, Z. T. Song and S. L. Feng, Appl. Phys. Lett., 2005, 87, 113108 CrossRef.
- Z. Wang, G. Ge Chen and D. Xia, J. Power Sources, 2008, 184, 432–436 CrossRef CAS.
- N. Du, H. Zhang, B. Chen, X. Ma, X. Huang, J. Tu and D. Yang, Mater. Res. Bull., 2009, 44, 211–215 CrossRef CAS.
- G. Wang, Y. Ji, X. Huang, X. Yang, P. I. Pelagia-Irene Gouma and M. Dudley, J. Phys. Chem. B, 2006, 110, 23777–23782 CrossRef CAS.
- X. W. Lou, D. Deng, J. Y. Lee and L. A. Archer, Chem. Mater., 2008, 20, 6562–6566 CrossRef CAS.
- X. W. Lou, J. S. Chen, P. Chen and L. A. Archer, Chem. Mater., 2009, 21, 2868–2874 CrossRef CAS.
- D. P. Tunstall, S. Patou, R. S. Liu and Y. H. Kao, Mater. Res. Bull., 1999, 34(10–11), 1513–1520 CrossRef CAS.
- M. S. Park, G. X. Wang, Y. M. Kang, D. Wexler, S. X. Dou and H. K. Liu, Angew. Chem., Int. Ed., 2007, 46, 750–753 CrossRef CAS.
- R. S. Ningthoujam and S. K. Kulshreshtha, Mater. Res. Bull., 2009, 44, 57–62 CrossRef CAS.
- T. Moon, C. Kim, S. T. Hwang and B. Park, Electrochem. Solid-State Lett., 2006, 9(9), A408–A411 CrossRef CAS.
- F. Su, X. S. Zhao, Y. Wang, J. Zeng, Z. Zhou and J. Y. Lee, J. Phys. Chem. B, 2005, 109, 20200–20206 CrossRef CAS.
- Y. Fu, R. Ma, Y. Shu, Z. Cao and X. Ma, Mater. Lett., 2009, 63, 1946–1948 CrossRef CAS.
- J. K. Kim, G. S. Chauhan, J. H. Ahn and H. J. Ahn, J. Power Sources, 2009, 189, 391–396 CrossRef CAS.
- XPS database on Web: http://www.lasurface.com/database/elementxps.php (December 2009).
- S. H. Lee, M. Mathews, H. Toghiani, D. O. Wipf and C. U. Pittman, Chem. Mater., 2009, 21, 2306–2314 CrossRef CAS.
- M. S. Park, Y. M. Kang, J. H. Kim, G. X. Wang, S. X. Dou and H. K. Liu, Carbon, 2008, 46, 35–40 CrossRef CAS.
- Y. Wang, I. Djerdj, B. Smarsly and M. Antonietti, Chem. Mater., 2009, 21, 3202–3209 CrossRef CAS.
- N. Sharma, J. Plévert, S. Rao, B. V. R. Chowdari and T. J. White, Chem. Mater., 2005, 17, 4700–4710 CrossRef CAS.
- M. F. Al-Khatib, S. E. Iyuke, A. B. Mohamad, W. R. W. Daud, A. A. H. Kadhum, A. M. Shariff and M. A. Yarmo, Carbon, 2002, 40, 1929–1936 CrossRef CAS.
Footnote |
| † Electronic supplementary information (ESI) available: Figures S1–S6. See DOI: 10.1039/c0nr00009d |
| This journal is © The Royal Society of Chemistry 2010 |
