Highly localized non-linear optical white-light response at nanorod ends from non-resonant excitation
Matthias D.
Wissert
a,
Konstantin S.
Ilin
b,
Michael
Siegel
b,
Uli
Lemmer
c and
Hans-Jürgen
Eisler
*a
aLichttechnisches Institut (LTI), DFG Heisenberg Group ‘Nanoscale Science’, Karlsruher Institut für Technologie – KIT, Germany. E-mail: hans.eisler@lti.uni-karlsruhe.de
bInstitut für Mikro und Nanoelektronische Systeme (IMS), Karlsruher Institut für Technologie – KIT, Germany
cLichttechnisches Institut (LTI), Karlsruher Institut für Technologie – KIT, Germany
First published on 6th May 2010
Abstract
We investigate gold nanorods that are excited non-resonantly using a femtosecond 800 nm pulsed laser beam. We find that they emit very localized white light – two-photon induced photoluminescence (PL) – spatially confined in the optical far-field with a full-width-at-half-maximum of 138 nm (x–y plane) and 328 nm (z-plane). The PL spectrum is characterized to show at least two components – a second-harmonic peak and an intrinsic gold interband transition.
The optical properties of gold nanorods of small dimensions, both fabricated by chemical means or top-down approaches like electron-beam lithography, have been under investigation for the last two decades. Aside from linear spectroscopy,1–5 two-photon induced photoluminescence (TPI-PL) of gold nanoparticles hand-in-hand with non-linear optical microscopy techniques has attracted particular interest.6–9 Due to absorption minima of water and major biomolecules in the infrared, TPI-PL allows for damage-free imaging in biological environments. Additionally, it enables near-field optical experiments on the single-particle level, far-field investigations of resonant optical antennas, as well as far-field mode mapping of plasmon nanoantennas. TPI-PL also allows for smaller effective excitation volumes compared to single-photon excitation,10 opening 3D imaging capabilities for heterogeneous complex samples. Still, important properties of the white light continuum (WLC) response of gold, such as the origin of its spectral shape ranging from the UV–vis to the far-IR, and the specific electromagnetic field intensity conditions required to excite and maintain it, remain unresolved in detail.
In this paper, we report on the optical interaction of a strongly focused, femtosecond pulsed 800 nm Ti:Sapphire laser beam with a gold nanorod of dimensions 1 μm × 50 nm × 30 nm (L × W × H). We observe a very strongly localized white-light response from the ends of the rod, which is shown to be of high non-linear order in terms of its spatial extent, and present the optical spectrum of the white light, which contains a second-harmonic frequency component.
The gold nanorods used for the experiments were all produced using standard electron-beam lithography. A glass cover slip was used as a sample (pre-baked-out for 8 h at 510 °C for the suppression of sample fluorescence), which was then covered with a 30 nm layer of indium tin oxide (ITO) in a sputtering process to avoid glass charging during the lithography process. Subsequently, poly(methyl methacrylate) (PMMA) was spun onto the sample, and, after exposure and development, a 30 nm layer of gold was applied to the sample using thermal evaporation. Finally, a lift-off was performed using acetone.
The sample was two-photon-excited by an 800 nm (peak power wavelength) Ti:Sapphire laser. To avoid unwanted laser light, residual components with wavelength below 785 nm (including light of the first harmonic at 400 nm) were filtered out using a long-pass filter (Semrock) before sample illumination. To achieve a high quality focus, the collimated excitation light was beam-expanded for a factor of 2 overfill of the aperture of a 100× (NA 1.46) oil-immersion objective lens (Zeiss). The sample position with respect to the laser focus was controlled using a three-axis piezo crystal stage (JPK Instruments). For the detection channel, the same objective lens was used. The excitation light was filtered out using a high-quality short-pass filter (RazorEdge 785, Semrock), which allowed for a high signal-to-noise-ratio (SNR). The two-photon induced white-light continuum signal was recorded by integrating photon counts in the wavelength range between 600 to 700 nm using a single photon avalanche photo diode (APD) detector. Point-by-point measurements of the sample with a raster-scanning x–y piezo stage generated a 2D image. A 3D image of the excitation volume could also be generated by using an additional z-axis piezo crystal. For spectral investigations, it was alternatively possible to send the light emanating from the structures to a spectrometer (Acton 2500i, 50 lines/mm, 600 nm blazed) equipped with an electron-multiplying charge-coupled device (EMCCD) camera as a detection device.
When the gold nanorod was raster scanned with a laser excitation power (measured at the entrance plane of the objective lens) of 1 mW, white light could be seen emanating from the two ends of the rod. Fig. 1a shows the x–y plane image of the optical response as obtained by such a raster scan. Fig. 1b gives an image of the corresponding white light distribution in the z-direction (the image is very similar for both possible central cuts through both rod ends) as obtained by 50 nm stepping of raster images. Figs. 1c and d give the measured values as well as a Gaussian fit for both a cut in the x- and the z-direction, respectively. A very narrow distribution with a full-width-at-half-maximum (FWHM) of 138 nm (x–y along x) and 328 nm (x–z along z) is obtained.
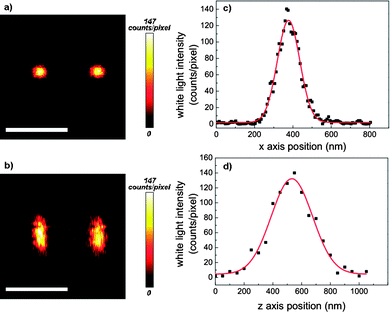 | ||
| Fig. 1 The TPI-PL signal as collected by a raster scan of the nanorod. a) Shows the profile as scanned in the x–y plane, b) gives a stacked image over the center of the x–z distribution, where z marks the axis along which the laser light propagates. Pixel integration time was 0.3 μs. Scale bar length is 1 μm. c) and d) show Gaussian fits (red line) to the white-light intensity (photon count) data for the original raster points shown as black dots for the x and the z planes, respectively. Only the data for the left spot is shown. The FWHM for c) is 138 nm, for d) it is 328 nm. | ||
If we assume the ends of the rods to be point-like detection probes compared to the extent of the laser focus, we can estimate the order of the total excitation process via the apparent dimensions of the excitation spot. A Gaussian beam profile in one dimension (in this case, x) can be described by (neglecting units) 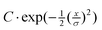 , where the FWHM of the profile is described by
  , x is the position on the x-axis, and C is a normalization factor which only scales the function, but does not influence the FWHM. The FWHM of an nth order process is then easily found by taking the nth power of this profile. Obviously, the FWHM is divided by
  for a process of nth order. So starting at
 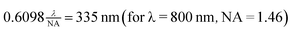 , we arrive at a total excitation process of approximately 6th order for a FWHM of 138 nm.
However, the logarithmically plotted dependence between excitation power and observed intensity for our measurement gives a clear indication that we still do indeed observe a two-photon induced luminescence process – the fitting curve (shown as an inset in Fig. 3) yields a slope of 2.15. We explain this apparent discrepancy with the presence of two effects going hand-in-hand: The strong localization is caused by an effective non-linearity due to electromagnetic field line crowding at the ends of the rod (lightning rod effect11,12), which then subsequently enables two-photon induced luminescence as a secondary process.
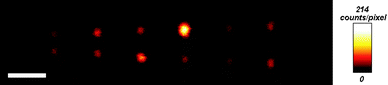 | ||
| Fig. 2 The TPI-PL signal for an xy-plane scan of rods of length 500 nm to 1 μm. Pixel integration time was 0.5 μs. Scale bar length is 1 μm. The reduction in length of the gold nanorod makes the two distinct peaks at the two ends approach each other. We attribute the differences in exact peak shape to differences in the surface properties of the rods due to imperfections in the electron-beam lithography process. This is, on the other hand, an additional feature to prove our point that we clearly observe an effect that is not dependent on the overall length of the rod. | ||
The observed optical effect is independent of rod length, as can be seen in Fig. 2. We reduced the length of the rod from 1 μm to 500 nm without any noticeable effect on the strongly localized spots, they simply start to move closer to each other, with the FWHM for all spots in the xy-plane comparable in size to the one shown in detail in Fig. 1. We did not investigate shorter rod lengths to make sure we avoid well known plasmon resonances. It is therefore justified to assume that we clearly observe a non-resonant lightning-rod effect, as compared to resonantly generated TPI-PL on shorter nanorods or purposely designed nanostructures.8,9,13 We required distinctly more power (factor between 102 and 103) to generate such a non-resonant white-light response from the nanorods compared to the excitation of resonant optical dipole antennas fabricated earlier by our group.14 Also, for those nanoantennas, only a typical TPI-PL spatial resolution slightly below the diffraction limit of  was achieved, which again indicates a distinct difference between the resonant case and the effect described in this work.
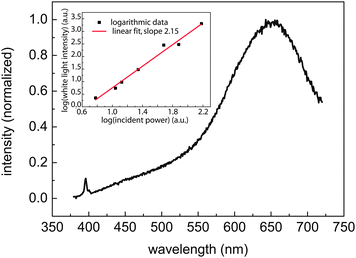 | ||
| Fig. 3 Spectrum of the white-light response at the end of one of the gold nanorods. The left peak around 400 nm is due to the second-harmonic generation, while the larger right peak around 650 nm can be explained by interband transitions in gold. The inset shows the emitted white light power (as detected by the APD) versus the incident laser power on a log–log scale. More details are given in the text. | ||
We also investigated the spectral properties of the white light generation. A spectrum measured from one of the ends of a rod of size 1 μm × 50 nm × 30 nm can be seen in Fig. 3. We found that the spectrum was very similar for all rod lengths under investigation (again from 1 μm to 500 nm) and independent of excitation polarization, with some second-harmonic light generated as well as a very large peak around 640 to 670 nm. The second-harmonic generation phenomenon is well-known for localized near-fields15 and again a strong indicator for a very strongly enhanced field at the rod ends, as well as a measure for its enhancement factor.16 When comparing our spectra to published work, we found that our higher peak wavelength seems to fit to the energy gap between the d-band and the Fermi level at the X-symmetry point of the first Brillouin zone, as already observed for TPI-PL of rods fabricated by colloidal synthesis, where higher order plasmon modes could be observed by near-field microscopy.17 The second interband peak they observe around 550 nm is not present in our experiment. We may speculate that the difference in fabrication technology between top-down and bottom-up approaches is responsible for the distinctly different behaviour of our nanorods in terms of the spectral behaviour and the distribution of the white light response over the structure.
In conclusion, the 3D spatial spread of the white-light system response of gold nanorods upon non-resonant laser illumination was thoroughly investigated. Notably, the 3D optical system response is well beyond the conventionally expected λ/3 limit for two-photon microscopy. The interpretation of the two-photon induced luminescence as a secondary process which follows the field line crowding at the rod ends due to the lightning rod effect, which determines the spatial extent of the white-light response, enables further studies on light-metal interaction. They could be performed e.g. on the influence of the high fields on the morphology on the structure, as those enhanced fields can easily induce significant temperatures at and above the melting point of gold, even for non-resonant processes, which enables a more varied choice for the excitation wavelength used. Moreover, the highly localized white-light source could be used for photoactivated chemistry or molecular sensing such as coherent anti-Stokes Raman spectroscopy (CARS).
Acknowledgements
The first author wishes to acknowledge generous support by the Karlsruhe School of Optics and Photonics (KSOP) and insightful discussions with B. Stein. The corresponding author would like to acknowledge support through Deutsche Forschungsgemeinschaft (DFG) under the project DFG EI 442/3-1 and the DFG Heisenberg Excellence Fellowship DFG EI 442/2-2.References
- S. Link and M. A. El-Sayed, J. Phys. Chem. B, 1999, 103, 8410 CrossRef CAS.
- C. Sönnichsen, T. Franzl, T. Wilk, G. von Plessen, J. Feldmann, O. Wilson and P. Mulvaney, Phys. Rev. Lett., 2002, 88, 077402 CrossRef CAS.
- E. Dulkeith, T. Niedereichholz, T. A. Klar, J. Feldmann, G. von Plessen, D. I. Gittins, K. S. Mayya and F. Caruso, Phys. Rev. B: Condens. Matter Mater. Phys., 2004, 70, 205424 CrossRef.
- J. Aizpurua, G. W. Bryant, L. J. Richter, F. J. García de Abajo, B. K. Kelley and T. Mallouk, Phys. Rev. B: Condens. Matter Mater. Phys., 2005, 71, 235420 CrossRef.
- O. L. Muskens, G. Bachelier, N. Del Fatti, F. Vallée, A. Brioude, X. Jiang and M.-P. Pileni, J. Phys. Chem. C, 2008, 112, 8917–8921 CrossRef CAS.
- H. Wang, T. B. Huff, D. A. Zweifel, W. He, P. S. Low, A. Wei and J.-X. Cheng, Proc. Natl. Acad. Sci. U. S. A., 2005, 102, 15752–15756 CrossRef CAS.
- K. Imura, T. Nagahara and H. Okamoto, J. Am. Chem. Soc., 2004, 126, 12730–12731 CAS.
- P. Mühlschlegel, H.-J. Eisler, O. J. F. Martin, B. Hecht and D. W. Pohl, Science, 2005, 308, 1607–1608 CrossRef CAS.
- P. Ghenuche, S. Cherukulappurath, T. H. Taminiau, N. F. van Hulst and R. Quidant, Phys. Rev. Lett., 2008, 101, 116805 CrossRef.
- J. R. Lakowicz. Principles of Fluorescence Sepctroscopy, Kluwer Academic, New York, 2nd edn, 1999 Search PubMed.
- J. I. Gersten, J. Chem. Phys., 1980, 72, 5779–5780 CrossRef CAS.
- P. Liao and A. Wokaun, J. Chem. Phys., 1982, 76, 751–752 CrossRef CAS.
- O. L. Muskens, V. Giannini, J. A. Sánchez and J. Gómez-Rivas, Opt. Express, 2007, 15, 17736–17746 CrossRef CAS.
- M. D. Wissert, A. W. Schell, K. S. Ilin, M. Siegel and H.-J. Eisler, Nanotechnology, 2009, 20, 425203 CrossRef.
- S. I. Bozhevolnyi, J. Beermann and V. Coello, Phys. Rev. Lett., 2003, 90, 197403 CrossRef.
- A. Bouhelier, M. Beversluis, A. Hartschuh and L. Novotny, Phys. Rev. Lett., 2003, 90, 013903 CrossRef CAS.
- K. Imura and H. Okamoto, J. Phys. Chem. C, 2009, 113, 11756 CrossRef CAS.
| This journal is © The Royal Society of Chemistry 2010 |