DOI:
10.1039/C0NR00019A
(Paper)
Nanoscale, 2010,
2, 1196-1202
Energy transfer study between Ce3+ and Tb3+ ions in doped and core-shell sodium yttrium fluoride nanocrystals†
Received
(in Gainesville, FL, USA)
12th January 2010
, Accepted 19th February 2010
First published on
9th April 2010
1. Introduction
There has been a steadily increasing interest in rare-earth (RE) ion doped sodium yttrium fluoride nanocrystals for their fundamental and technological importance.1–7 Due to their multicolour emission, long lifetime and high brightness, RE ion based luminescent materials have tremendous promise as indicators and photon sources for numerous applications such as bio-labels, light emitting devices, sensor technology and lasers.8–10 On the other hand, low phonon energy, high refractive index and tunable crystal phase make sodium yttrium fluoride an efficient host material for RE ions compared to oxide hosts.11–13 Hexagonal and cubic are the two existing polymorphs of sodium yttrium fluoride nanocrystals depending on the synthesis condition. Recently, it is reported that the efficiency of the RE ion doped sodium yttrium fluoride can be tuned by tuning the crystal phase and excitation wavelength.14,15 RE ion doped nanocrystals can be activated either by directly exciting 4fn energy levels or by exciting the charge transfer band (CT). The opposite parity excited state of the RE ion (charge transfer of fn−1d) and same parity excited state of the RE ion (direct transition of 4fn) appeared to be important factors for tuning the efficiency of the materials. In addition to this, energy transfer (ET) between different RE ions has been used to prepare efficient materials. A few papers have already described the influence of crystal phase, morphology and wavelength of excitation on the luminescence properties of sodium yttrium fluoride.16–19 However, energy transfer using different RE ions inside a sodium yttrium fluoride host is not well studied. Ce3+ and Tb3+ ions are used for blue and green phosphors, respectively. As efficient green phosphors, Ce3+ and Tb3+ co-activated LaPO4 powders were extensively used in fluorescence lamps, cathode ray tubes (CRTs) and plasma display panels (PDPs) due to the high efficiency energy transfer between Ce3+ and Tb3+ ions.20,21 Yu et al. reported energy transfer process in LaPO4–Ce3+/Tb3+ nanowires.20 Kömpe et al. reported enhancement of luminescence intensity in CePO4–Tb/LaPO4 core-shell structure.22 Meyssamy and co-workers synthesized LaPO4–Eu and colloidal CePO4–Tb nanoparticles and nanowires and reported their luminescence properties.23–25 Recently, Caruso and co-workers25 have demonstrated the bio-functionalization of rare-earth-doped (Ce, Tb) lanthanum phosphate colloidal nanoparticles. Water-soluble luminescent lanthanide nanoparticles have already proven to be novel strategies for designing highly luminescent and photostable lanthanide nanoprobes applicable for biological uses.
Here, we use solution based process “soft chemistry” for making water dispersible luminescent nanostructure materials. Of particular interest is how the other physical properties of these materials vary with the modification of the shape and surface coating with the hope that such knowledge will enable us to construct efficient nanomaterials. Lattice strain may vary with core-shell structure of nanoparticles, which may affect the photoluminescence properties of the doped rare-earth ion.26,27 The fundamental question that we are attempting to address here is how the energy transfer between Ce3+ and Tb3+ ions varies in doped Na(Y1.5Na0.5)F6:Ce:Tb nanorods and core-shell NaYF4:Ce/Tb nanoparticles. The crystal phase, morphology, structure, formation mechanism, and luminescence properties of these nanocrystals are investigated in detail.
2. Experimental section
2.1 Preparation of Na(Y1.5Na0.5)F6:Ce and Na(Y1.5Na0.5)F6:Ce:Tb nanorods
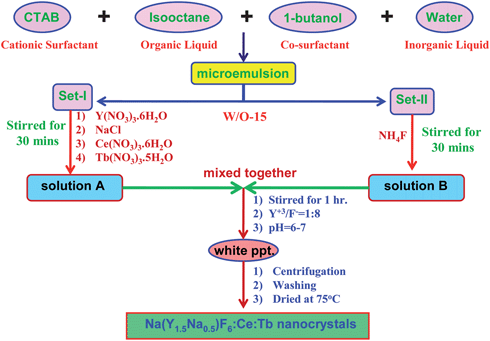
Two sets of nanoreactors (Set 1 and Set 2) were prepared through water-in-oil (w/o) type emulsion with 0.456M cetyl trimethyl ammonium bromide (CTAB) (ALFA AESAR), 38 ml isooctane and 10 ml 1-butanol as the cationic surfactant, organic liquid phase and co-surfactant, respectively. 3.5 ml water is required to prepare the micro-emulsion. The amount of water is adjusted to keep the water to surfactant ratio (w/o) at 15. 0.425 (M) Y(NO3)3·6H2O (Indian Rare Earth Ltd), 0.425 (M) NaCl (Merck) and the required amount of cerium nitrate (for 1 mol% Ce2O3, Aldrich) were placed in 3.5 ml water and stirred for a few minutes. Then, the solution mixture was added to Set 1 and stirred for 30 min. 1.7 (M) NH4F solution (Merck) was added to Set 2 and stirred for 30 min. Now, the fluoride containing micro-emulsion is added to the previous emulsion and stirred for one hour. In this preparation technique, Y3+/F− ratio and pH of the solution were maintained at 1![[thin space (1/6-em)]](https://www.rsc.org/images/entities/char_2009.gif) :
:![[thin space (1/6-em)]](https://www.rsc.org/images/entities/char_2009.gif) 8 and 6–7, respectively. Finally, a white precipitate was obtained. Particles were then collected by centrifugation (6000 rpm) and then the particles were washed twice with acetone and methanol and dried at 75 °C for 12 h in a vacuum oven and the crystalline particles were collected. Using the same method, Na(Y1.5Na0.5)F6:Ce:Tb nanocrystals are prepared by taking the required amount of cerium nitrate (for 1 mol % Ce2O3, Aldrich) and terbium nitrate (for 0.5 mol % Tb2O3, Aldrich). Scheme 1 represents the preparation of Na(Y1.5Na0.5)F6: Ce:Tb nanocrystals.
8 and 6–7, respectively. Finally, a white precipitate was obtained. Particles were then collected by centrifugation (6000 rpm) and then the particles were washed twice with acetone and methanol and dried at 75 °C for 12 h in a vacuum oven and the crystalline particles were collected. Using the same method, Na(Y1.5Na0.5)F6:Ce:Tb nanocrystals are prepared by taking the required amount of cerium nitrate (for 1 mol % Ce2O3, Aldrich) and terbium nitrate (for 0.5 mol % Tb2O3, Aldrich). Scheme 1 represents the preparation of Na(Y1.5Na0.5)F6: Ce:Tb nanocrystals.
2.2 Preparation of core-shell NaYF4:Ce/Tb nanoparticles
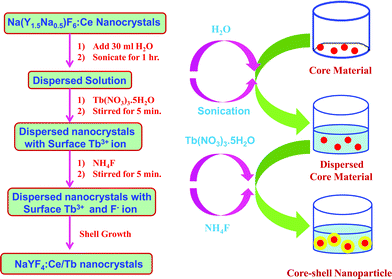
To prepare core-shell NaYF4:Ce/Tb nanoparticles, the required amount of 1 mol% Ce3+-doped sodium yttrium fluoride nanocrystals were placed in a beaker with 30 mL of water and sonicated for 1 h in an open beaker kept in an ice bath. After sonication, the required amount of terbium nitrate (0.5 mol%) solution was added and stirred for 5 min, followed by the addition of the required amount of NH4F solution. The resulting product was washed extensively with water, centrifuged, and dried under vacuum. Finally, the white precipitate was washed and dried at 75 °C. Scheme 2 represents the preparation of NaYF4:Ce/Tb nanocrystals.
Transmission electron microscopy (TEM) (JEOL Model 200) was used to study the morphology and particle size of the resulting powders. The crystalline phases of annealed powders were identified by X-ray diffraction (XRD) using a Siefert XRD 3000 P. The crystallite sizes of the nanocrystals were calculated following Scherrer's equation:
where
K = 0.9,
D represents crystallite size (Å),
λ is the wavelength of Cu Kα radiation, and β is the corrected half width of the diffraction peak. The volume fraction of the cubic (X
c) and hexagonal (X
h) phases were estimated from the integrated peak intensity of the (100)
h, (110)
h, (101)
h, (201)
h, (211)
h planes of the hexagonal phase and the (111)
c plane of the cubic phase using the following equation:
| | | Xc = Ic (111)/[Ih (100) + Ih (110) + Ic (111) + Ih (101) + Ih (201) + Ih (211)]. | (2) |
The excitation and emission spectra and decay times were recorded in a Fluro MaX-P (Horiba Jobin Yvon) spectrometer, using both solid and liquid sample holders at room temperature. We used an optical filter during the measurement of photoluminescence (PL) emission spectra.
3. Results and discussion
3.1 Structural characterization
Fig. 1 depicts the XRD patterns of doped and coated sodium yttrium fluoride nanocrystals prepared at a 1![[thin space (1/6-em)]](https://www.rsc.org/images/entities/char_2009.gif) :
:![[thin space (1/6-em)]](https://www.rsc.org/images/entities/char_2009.gif) 8 ratio of Y3+
8 ratio of Y3+![[thin space (1/6-em)]](https://www.rsc.org/images/entities/char_2009.gif) :
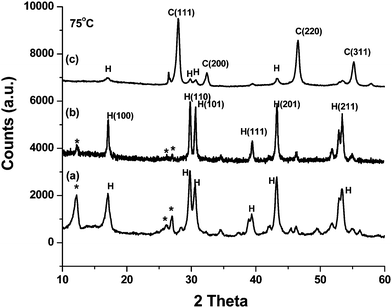
:![[thin space (1/6-em)]](https://www.rsc.org/images/entities/char_2009.gif) F− and pH = 6–7. The phase composition, crystallite size and cell parameters as a function of doping and surface coating are summarized in Table 1. Fig. 1a depicts the XRD pattern of 75 °C dried 1 mol% Ce3+ doped Na(Y1.5Na0.5)F6 nanocrystals. All the diffraction peaks match well with the hexagonal Na(Y1.5Na0.5)F6 (JCPDS card no. 16-334) except the peaks marked with the asterisks. The peaks marked with the asterisks are due to the formation of monoclinic ammonium fluorolanthate (NH4)3Y2F9 (JCPDS card no. 43-0840). These can be easily removed by sonication leaving pure hexagonal Na(Y1.5Na0.5)F6 (supporting information Fig. S1†). It is reported earlier that ammonium fluorolanthate can form a layered structure with sodium yttrium fluoride which decomposes on heating.14 The XRD pattern of 75 °C dried 1 mol% Ce3+, 0.5 mol% Tb co-doped Na(Y1.5Na0.5)F6 nanocrystals is shown in Fig. 1b. Here, we obtained hexagonal sodium yttrium fluoride with a small amount of ammonium fluorolanthate and the diffraction peaks are slightly shifted to the right side compared to Fig. 1a. This gradual shifting of the diffraction lines indicates the effective doping. We calculated lattice volume and it is seen that the lattice volume of Tb3+ and Ce3+ co-doped sample decreases from the Ce3+-only doped sample (see Table 1) and it matches with the shifting of the diffraction peak. Multiple cationic sites are the main feature of the crystal structure of the hexagonal phase. According to Burn,28 there are three types of cation sites: one-fold site occupied by Y3+, one-fold site occupied randomly by ½ Na+ and ½ Y3+, and a twofold site occupied randomly by Na+ and vacancies of the structure of the hexagonal NaYF4. The fluoride coordination about the first two sites are nine-fold, whereas the cubic structure is like the fluorite type structure.29 Haase and coworkers16 and others also support the presence of 3 cationic sites inside the hexagonal phase. Fig. 1c depicts the XRD pattern of 75 °C dried core-shell NaYF4:Ce/Tb nanorods. Here, the major crystalline phase is cubic and the volume fraction of the cubic crystal phase is 85%. A drastic change in the crystal phase is observed due to the core-shell structure. It is well established that the cubic phase is a more disordered and thermodynamically unstable phase. The transition from hexagonal to a cubic phase has an order-to-disorder character with respect to the cations.30 This phase transition behavior can be controlled by changing the environment or changing the energy barrier. It is reported that the phase transition from cubic α-NaYF4 to β-NaYF4 is mainly due to the modification of the environment of Y3+ occupation sites, including coordination number.31,32 Thoma et al.33 reported that the kinetic energy influences the phase change from cubic to hexagonal NaYF4. Recently, Mai et al.34 also reported that the energy barrier is the main reason for β-NaREF4 formation. We have reported earlier that the cubic to hexagonal phase transition can be tuned by changing the reactant ratio (such as the Y3+/F− ratio), pH of the solution and heating temperature.14 To the best of our knowledge, the modification of the crystal structure of sodium yttrium fluoride nanocrystals by surface coating has not been reported in the literature. Several studies have reported that phase transformation is a surface phenomenon.35,36 It was earlier reported that 92% tetragonal ZrO2 was observed instead of monoclinic by surface coating by Eu2O3.37 Similarly, cubic uncapped CdS nanoparticles are converted to hexagonal CdS nanoparticles at 80 °C after coating with TSA (thiosalicylic acid) because of the small energy difference between the zinc blende and wurtzite structure of CdS.38,39 Similarly, the energy difference between the cubic and hexagonal phase of sodium yttrium fluoride nanocrystals is very small.14,15 In the present study, during surface coating of Na(Y1.5Na0.5)F6:Ce nanocrystals by TbF3, the surface energy changes at the interface, which drives the transformation from hexagonal to cubic phase. To understand the effect of surface energy behind the crystal phase change, we have first taken layered sodium yttrium fluoride (as prepared) and then dispersed it in water, followed by surface coating by TbF3. We obtained a similar hexagonal pattern like the as-prepared sample (supporting information Fig. S2a†). Here, no effect of surface coating on the crystal phase is observed. This is because the layered structure between sodium yttrium fluoride and ammonium fluorolanthate appears in the as-prepared sample. When as-prepared samples are sonicated strongly for 40 min in an open beaker kept in an ice bath, this layered structure is destroyed due to decomposition of (NH4)3Y2F9 and only hexagonal sodium yttrium fluoride prevails after sonication (supporting information Fig. S1†). However, after sonication, the crystal phase changes from hexagonal to cubic (supporting information Fig. S2b†). Thus, the crystal phase modification can be done by surface coating and sonication.
F− and pH = 6–7. The phase composition, crystallite size and cell parameters as a function of doping and surface coating are summarized in Table 1. Fig. 1a depicts the XRD pattern of 75 °C dried 1 mol% Ce3+ doped Na(Y1.5Na0.5)F6 nanocrystals. All the diffraction peaks match well with the hexagonal Na(Y1.5Na0.5)F6 (JCPDS card no. 16-334) except the peaks marked with the asterisks. The peaks marked with the asterisks are due to the formation of monoclinic ammonium fluorolanthate (NH4)3Y2F9 (JCPDS card no. 43-0840). These can be easily removed by sonication leaving pure hexagonal Na(Y1.5Na0.5)F6 (supporting information Fig. S1†). It is reported earlier that ammonium fluorolanthate can form a layered structure with sodium yttrium fluoride which decomposes on heating.14 The XRD pattern of 75 °C dried 1 mol% Ce3+, 0.5 mol% Tb co-doped Na(Y1.5Na0.5)F6 nanocrystals is shown in Fig. 1b. Here, we obtained hexagonal sodium yttrium fluoride with a small amount of ammonium fluorolanthate and the diffraction peaks are slightly shifted to the right side compared to Fig. 1a. This gradual shifting of the diffraction lines indicates the effective doping. We calculated lattice volume and it is seen that the lattice volume of Tb3+ and Ce3+ co-doped sample decreases from the Ce3+-only doped sample (see Table 1) and it matches with the shifting of the diffraction peak. Multiple cationic sites are the main feature of the crystal structure of the hexagonal phase. According to Burn,28 there are three types of cation sites: one-fold site occupied by Y3+, one-fold site occupied randomly by ½ Na+ and ½ Y3+, and a twofold site occupied randomly by Na+ and vacancies of the structure of the hexagonal NaYF4. The fluoride coordination about the first two sites are nine-fold, whereas the cubic structure is like the fluorite type structure.29 Haase and coworkers16 and others also support the presence of 3 cationic sites inside the hexagonal phase. Fig. 1c depicts the XRD pattern of 75 °C dried core-shell NaYF4:Ce/Tb nanorods. Here, the major crystalline phase is cubic and the volume fraction of the cubic crystal phase is 85%. A drastic change in the crystal phase is observed due to the core-shell structure. It is well established that the cubic phase is a more disordered and thermodynamically unstable phase. The transition from hexagonal to a cubic phase has an order-to-disorder character with respect to the cations.30 This phase transition behavior can be controlled by changing the environment or changing the energy barrier. It is reported that the phase transition from cubic α-NaYF4 to β-NaYF4 is mainly due to the modification of the environment of Y3+ occupation sites, including coordination number.31,32 Thoma et al.33 reported that the kinetic energy influences the phase change from cubic to hexagonal NaYF4. Recently, Mai et al.34 also reported that the energy barrier is the main reason for β-NaREF4 formation. We have reported earlier that the cubic to hexagonal phase transition can be tuned by changing the reactant ratio (such as the Y3+/F− ratio), pH of the solution and heating temperature.14 To the best of our knowledge, the modification of the crystal structure of sodium yttrium fluoride nanocrystals by surface coating has not been reported in the literature. Several studies have reported that phase transformation is a surface phenomenon.35,36 It was earlier reported that 92% tetragonal ZrO2 was observed instead of monoclinic by surface coating by Eu2O3.37 Similarly, cubic uncapped CdS nanoparticles are converted to hexagonal CdS nanoparticles at 80 °C after coating with TSA (thiosalicylic acid) because of the small energy difference between the zinc blende and wurtzite structure of CdS.38,39 Similarly, the energy difference between the cubic and hexagonal phase of sodium yttrium fluoride nanocrystals is very small.14,15 In the present study, during surface coating of Na(Y1.5Na0.5)F6:Ce nanocrystals by TbF3, the surface energy changes at the interface, which drives the transformation from hexagonal to cubic phase. To understand the effect of surface energy behind the crystal phase change, we have first taken layered sodium yttrium fluoride (as prepared) and then dispersed it in water, followed by surface coating by TbF3. We obtained a similar hexagonal pattern like the as-prepared sample (supporting information Fig. S2a†). Here, no effect of surface coating on the crystal phase is observed. This is because the layered structure between sodium yttrium fluoride and ammonium fluorolanthate appears in the as-prepared sample. When as-prepared samples are sonicated strongly for 40 min in an open beaker kept in an ice bath, this layered structure is destroyed due to decomposition of (NH4)3Y2F9 and only hexagonal sodium yttrium fluoride prevails after sonication (supporting information Fig. S1†). However, after sonication, the crystal phase changes from hexagonal to cubic (supporting information Fig. S2b†). Thus, the crystal phase modification can be done by surface coating and sonication.
| Sample |
T/°C |
Crystal Phase |
Crystallite Size/nm |
Cell Parameter/Å |
Cell Volume/Å3 |
Lattice strain |
| Na(Y1.5Na0.5)F6:Ce(1) |
75 |
Hexagonal |
21.1 |
a =6.189 |
118.39 |
−0.38% (compressive) |
| c = 3.569 |
| Na(Y1.5Na0.5)F6:Tb(1) |
75 |
Hexagonal |
20 |
a =6.187 |
118.19 |
−0.35% (compressive) |
| c = 3.565 |
| Na(Y1.5Na0.5)F6:Ce(1),Tb(0.5) |
75 |
Hexagonal |
29.4 |
a =6.174 |
117.49 |
+0.15% (tensile) |
| c = 3.392 |
| NaYF4:Ce(1)/Tb(0.5) |
75 |
Cubic (major) |
17.7 |
a =5.448 |
161.77 |
+0.43% |
| Hexagonal (minor) |
22.3 |
a =6.478 |
122.89 |
−1.02%. |
| c = 3.381 |
The lattice strain is being calculated to understand the effect of doping and surface coating using Williamson and Hall theorem:40
| | | β cos θ/λ = 1/D+ η sin θ/λ | (3) |
where β is the full width at half maximum (FWHM),
θ is the diffraction angle,
λ is the X-ray wavelength, D is the effective particle size, and η is the effective strain. The strain and the crystallite size (D) are calculated from the slope and the intercept of a plot of β cos
θ/
λ against sin
θ/
λ, respectively. Compressive strain (−0.4%) is obtained for 75 °C dried 1 mol% Ce
3+ doped Na(Y
1.5Na
0.5)F
6 sample (
Table 1). However, tensile strain (+0.15%) is observed for the Ce–Tb co-doped sample (
Fig. 2a). Previously, it is reported that tensile strain increases with doping concentration.
15,26,27 Thus, the nature of lattice strain can be tuned by changing the concentration.
Fig. 2b shows the plot for 75 °C dried core-shell NaYF
4:
Ce/Tb
nanocrystals where both cubic (major) and hexagonal phases (minor) are present. The tensile strain (+0.43%) and compressive strain (−1.02%) are obtained on considering the cubic and hexagonal phases, respectively. Therefore, the lattice strain can be modified by changing the crystal phase and doping concentration, which matches with previous results.
15,26,27
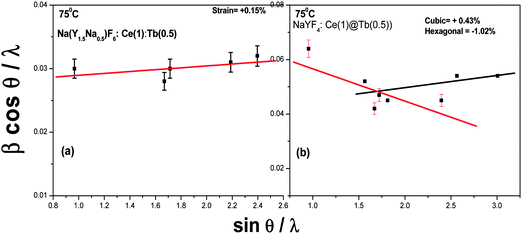 |
| | Fig. 2 The plot of β cos θ/λ against sin θ/λ for sodium yttrium fluoride sample prepared by micro-emulsion at 75 °C co-doped (a), and 75 °C coated (b), respectively. | |
Fig. 3a shows the low magnification TEM images of 75 °C dried Ce3+-doped Na(Y1.5Na0.5)F6 nanocrystals layered with ammonium fluorolanthate. Nanorods and nanowires of high aspect ratio using CTAB mediated reverse micelle technique are obtained. It is reported that by varying water to surfactant ratio (W0), nanomaterials of different morphology can be produced using CTAB as cationic surfactant.41 In the present study, we used W0 = 15, and obtained nanowire/nanorods which are consistent with previous results.41 To prepare core-shell materials, we have sonicated the samples to remove ammonium fluorolanthate and obtained a spherical interior hollow type structure (Fig. 3b). Hollow type structure is obtained due to removal of ammonium fluorolanthates. Finally, it is coated by TbF3 and core-shell NaYF4:Ce/Tb nanoparticles are obtained. The measured diameter of the core is 60 nm and the shell thickness is 15–20 nm. The fast Fourier transform (FFT) pattern taken from both the core and the shell supports the core-shell formation (supporting information Fig. S3†). The FFT pattern in Fig. S3b of the supporting information† confirms the (210) plane of the TbF3 phase (JCPDS File no 37-1487). A schematic sketch of morphology change is given (Fig. 3d). The morphology change from anisotropic rod to sphere type is noteworthy. Recently, Ni et al. reported the transition of Cu(OH)2 nanowires to 3D CuO microstructures under ultrasonic irradiation and explained it on the basis of oriented attachment mechanism.42 It is already reported that the morphological change of LaPO4 nanorod to nanoparticle is due to orientated attachment.43 Alivisatos and co-workers44 have reported this kind of morphology change from rod to sphere for Ag2Se nanoparticles synthesized from CdSe nanorods by cation exchange method and explained the phenomenon on diffusion kinetics.
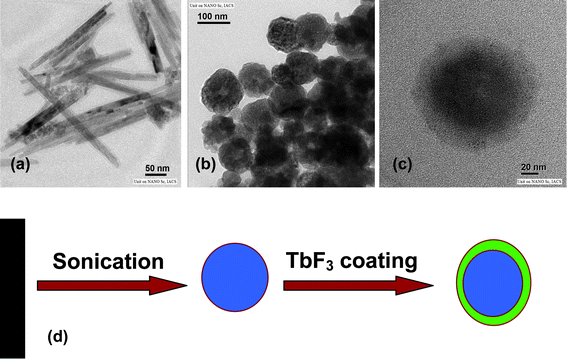 |
| | Fig. 3 Low magnification TEM images of 75 °C dried Na(Y1.5Na 0.5)F6:Ce(1) doped nanorods (a), 75 °C dried sonicated Na(Y1.5Na0.5)F6:Ce(1) doped nanoparticles (b) and core-shell NaYF4:Ce(1)/Tb nanoparticles (c). Schematic diagram of morphology change (d). | |
3.2 Luminescence studies
Fig. 4 shows the photoluminescence excitation (PLE) and photoluminescence (PL) spectra of water dispersible Na(Y1.5Na 0.5)F6:Ce(1), Na(Y1.5Na 0.5)F6:Ce(1):Tb(0.5), nanorods and NaYF4:Ce(1)/Tb (0.5) nanoparticles under excitation of 4f–5d absorption bands of Ce3+ ion. A strong excitation peak near 256 nm and a weak peak near 289 nm, monitored with the emission wavelength of 365 nm, corresponds to the transitions from the ground state, 2F5/2, of Ce3+ (4f) to the different components of the excited Ce3+ 5d states.45 Since this transition is parity allowed, its oscillator strength is much higher compared to other rare-earth ions. There is a single electron present in the 4f configuration of Ce3+ ion and the irradiation of UV photon will excite this 4f electron into a 5d orbital, leaving the 4f shell empty. A broad emission band ranging from 350 nm to 500 nm with a maximum of 365 nm is observed for Ce3+ doped nanorod samples. This emission band is assigned to the parity allowed transition of the lowest component of the 2D state to the spin–orbit components of the ground state 2F5/2, 7/2 of Ce3+ ion. Generally, the emission of Ce3+ has a doublet character with an average distance of about 2000 cm−1 due to the ground state splitting (2F5/2 and 2F7/2). According to the asymmetric curve shape and position, it is deconvoluted into two peaks; one strong at 365 nm and the other weak at 467 nm. During the excitation (same wavelength) of Ce–Tb co-doped samples, the significant decrease in PL intensities of Ce3+ ion and the appearance of new peaks at 489 nm, 544 nm, 585 nm and 621 nm are due to transitions of 5D4-7F6, 5, 4, 3 for Tb3+ ion. The green emission transition (5D4-7F5) at 544 nm, which is a magnetic dipole transition with ΔJ = ±1, is more intense than other transitions.46 In the present case, Ce3+ ions are excited first, then the energy transfer takes place from Ce3+ to Tb3+ ions which non-radiatively decay to the upper excited level (5D4) of Tb3+. Finally, radiative decay occurs from this level to the various underlying levels of 5FJ = 0, 1, 2, 3, 4, 5, 6 of Tb3+ ions (Fig. 5). The energy levels of Tb3+ are suitable for an energy transfer to take place from the allowed absorption on the Ce3+ ion upon excitation with an UV source. The emission intensity of Ce–Tb co-doped samples is 12 times higher than Tb-only doped sample (supporting information Fig. S4†). When NaYF4:Ce/Tb core-shell nanocrystals are excited by the 4f–5d absorption band of Ce3+ ion, energy transfer takes place from Ce3+ to Tb3+. However, the emission intensity for the Tb3+ ion for the core-shell sample is 2 times lower than the doped sample. The energy transfer (ET) efficiency from a donor (Ce3+) to an acceptor (Tb3+) can be calculated according to the formula ηET = 1 − Id/Id0 where Id and Id0 are the corresponding luminescence donor intensities in the presence and absence of the acceptor for the same donor concentration, respectively.20 The energy transfer efficiencies are 65% and 45% for water soluble doped and core-shell samples, respectively. The decay time for the Tb3+ ion monitored at λem = 544 nm and λex = 266 nm are measured and depicted in Fig. 6. It is seen that decay time for the doped sample is higher (8.41 ms) than coated (5.67 ms) and agrees well with the emission spectra.
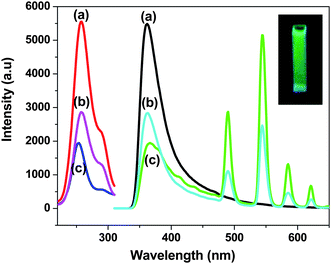 |
| | Fig. 4 Excitation and photoluminescence spectra of (a) 1 mol% Ce3+ doped, (b) 1 mol% Ce3+ and 0.5 mol% Tb3+ doped and (c) 1 mol% Ce3+ doped and 0.5 mol% Tb3+coated Na(Y1.5Na0.5)F6 nanocrystals. | |
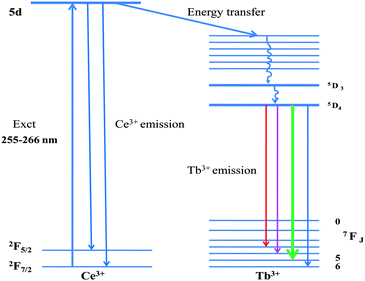 |
| | Fig. 5 Energy level diagram of Na(Y1.5Na0.5)F6:Ce,Tb with electronic transitions and energy transfer process. | |
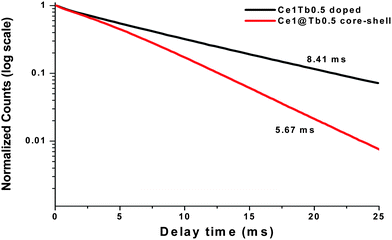 |
| | Fig. 6 Normalized photoluminescence (PL) decays of 75 °C dried Na(Y1.5Na0.5)F6:Ce,Tb and NaYF4:Ce/Tb nanocrystals monitored at the 5D4-7F5 Tb3+ transition and 256/258 nm excitation. | |
Considering the emission lines for Tb3+, quantum yield is calculated using the following equation:47
| |  | (4) |
| |  | (5) |
A
rad
is the radiative contribution, A4–5 is the Einstein's coefficient between 5D4-7F5 levels, γ is the energy baricenter of the corresponding transition and I is respective PL intensity. The quantum yields are found to be 75% and 42% for the doped and core-shell samples, respectively. Bühler et al.48 and Riwotzki et al.24 reported 70% and 42% quantum yield considering only the Tb3+ emission lines for LaPO4:Ce/Tb nanocrystals respectively. In the present case, high quantum yield for the doped sample confirms the formation of efficient green emitting luminescent materials (inset of Fig. 4). From the above analysis, it is confirmed that energy transfer is more efficient in the doped sample than the coated one. This may be due to the hexagonal structure of sodium yttrium fluoride. It is known that there are three cationic sites in this hexagonal structure where rare-earth dopants can be accommodated. It is also reported49 that the interatomic distance between Eu and neighboring atoms, coordination number, and bond length of doped nanocrystals are different from the coated nanocrystals. Thus, the local structures play the most important role in the modifications of luminescence properties observed in Eu-doped and coated ZrO2 nanocrystals.49 It reveals that non-radiative decay is higher in the case of the coated sample than the doped sample. The contributions of ions at the surface sites increases in the case of the surface coated sample. Therefore, the fraction of ion-pairs for a coated sample is much higher because the distances between two ions are shortened, thus leading to formation of ions clusters. As a result, concentration-quenching processes (cross-relaxation) will be the predominant non-radiative decay process in the coated sample. This is the plausible explanation for the lower quantum yield of coated samples.
4. Conclusion
In conclusion, solution based technique is a promising route for the synthesis of doped and core-shell sodium yttrium fluoride materials. Crystal phase and morphology can be tuned by surface coating. Again, compressive strain is obtained for Ce3+ doped sample and tensile strain for Ce–Tb co-doped sample and the nature of lattice strain changes after a certain doping concentration. The energy transfer efficiency and quantum yield values are higher in doped samples than core-shell samples. It is found that the local structures play the most important role in the modifications of luminescence properties observed in doped and core-shell nanoparticles.
Acknowledgements
The Department of Science and Technology (NSTI) and “Ramanujan Fellowship” are acknowledged for financial support. P.G thanks S.R.F (Ext) fellowship provided by Council of Scientific and Industrial Research (CSIR). A.K also thanks CSIR for providing fellowship.
References
- F. Wang and X. Liu, Chem. Soc. Rev., 2009, 38, 976 RSC.
- J.-C. Boyer, F. Vetrone, L. A. Cuccia and J. A. Capobianco, J. Am. Chem. Soc., 2006, 128, 7444 CrossRef CAS.
- J. F. Suyver, J. Grimm, M. K. van Veen, D. Biner, K. W. Krämer and H. U. Güdel, J. Lumin., 2006, 117, 1 CrossRef CAS.
- C. Li, J. Yang, Z. Quan, P. Yang, D. Kong and J. Lin, Chem. Mater., 2007, 19, 4933 CrossRef CAS.
- G. Yi, H. Lu, S. Zhao, Y. Ge, W. Yang, D. Chen and L.-H. Guo, Nano Lett., 2004, 4, 2191 CrossRef CAS.
- G.-S. Yi and G.-M. Chow, Chem. Mater., 2007, 19, 341 CrossRef CAS.
- L. Wang and Y. Li, Nano Lett., 2006, 6, 1645 CrossRef CAS.
-
P. N. Prasad, Nanophotonics, John Wiley & Sons, New York, 2004 Search PubMed.
- S. Sivakumar, F. C. J. M. V. Veggel and P. S. May, J. Am. Chem. Soc., 2007, 129, 620 CrossRef CAS.
- A. Shalav, B. S. Richards, T. Trupke, K. W. Krämer and H. U. Güdel, Appl. Phys. Lett., 2005, 86, 13505 CrossRef.
- M. Wang, C.-C. Mi, W.-X. Wang, C.-H. Liu, Y.-F. Wu, Z.-R. Xu, C.-B. Mao and S.-K. Xu, ACS Nano, 2009, 3, 1580 CrossRef CAS.
- F. Liu, E. Ma, D. Chen, Y. Yu and Y. Wang, J. Phys. Chem. B, 2006, 110, 20843 CrossRef CAS.
- D.-K. Ma, S-M. Huang, Y.-Y. Yu, Y.-F. Xu and Y.-Q. Dong, J. Phys. Chem. C, 2009, 113, 8136 CrossRef CAS.
- P. Ghosh and A. Patra, J. Phys. Chem. C, 2008, 112, 3223 CrossRef CAS.
- P. Ghosh and A. Patra, J. Phys. Chem. C, 2008, 112, 19283 CrossRef CAS.
- P. Ptacek, H. Schäfer, K. Kömpe and M. Haase, Adv. Funct. Mater., 2007, 17, 3843 CrossRef CAS.
- Z. Li and Y. Zhang, Nanotechnology, 2008, 19, 345606 CrossRef.
- B. Dong, H. Song, H. Yu, H. Zhang, R. Quin, B. Xue, G. Pan, S. Lu, F. Wang, L. Fan and Q. Dai, J. Phys. Chem. C, 2008, 112, 1435 CrossRef CAS.
- Y. Sun, Y. Chen, L. Tian, Y. Yu, X. Kong, J. Zhao and H. Zhang, Nanotechnology, 2007, 18, 275609 CrossRef.
- L. Yu, H. Song, Z. Liu, L. Yang, S. Lu and Z. Zheng, J. Phys. Chem. B, 2005, 109, 11450 CrossRef CAS.
- V. Buissette, M. Moreau, T. Gacoin, J.-P. Boilot, J.-Y. Chane-Ching and T. L. Mercier, Chem. Mater., 2004, 16, 3767 CrossRef CAS.
- K. Kömpe, H. Borchert, J. Storz, A. Lobo, S. Adam, T. Moller and M. Haase, Angew. Chem., Int. Ed., 2003, 42, 5513 CrossRef.
- H. Meyssamy, K. Riwotzki, A. Koronowski, S. Naused and M. Haase, Adv. Mater., 1999, 11, 840 CrossRef CAS.
- K. Riwotzki, H. Meyssamy, H. Schnablegger, A. Koronowski and M. Haase, Angew. Chem., Int. Ed., 2001, 40, 573 CrossRef CAS.
- F. Meiser, C. Cortez and F. Caruso, Angew. Chem., Int. Ed., 2004, 43, 5954 CrossRef CAS.
- P. Ghosh, J. Oliva, E. De laRosa, K. K. Haldar, D. Solis and A. Patra, J. Phys. Chem. C, 2008, 112, 9650 CrossRef CAS.
- P. Ghosh, E. De la Rosa, J. Oliva, D. Solis, A. Kar and A. Patra, J. Appl. Phys., 2009, 105, 113532 CrossRef.
- J. H. Burns, Inorg. Chem., 1965, 4, 881 CrossRef CAS.
- F. Hund, Z. Anorg. Allg. Chem., 1950, 263, 102 CrossRef CAS.
- K. W. Krämer, D. Biner, G. Frei, H. U. Güdel, M. P. Hehlen and S. R. Lüthi, Chem. Mater., 2004, 16, 1244 CrossRef.
- M. D. Mathews, B. R. Ambekar, A. K. Tyagi and J. Köhler, J. Alloys Compd., 2004, 377, 162 CrossRef CAS.
- N. Martin, P. Boutinaud, M. Malinowski, R. Mahiou and J. C. Cousseins, J. Alloys Compd., 1998, 275–277, 304 CrossRef CAS.
- R. E. Thoma, H. Insley and G. M. Hebert, Inorg. Chem., 1966, 5, 1222 CrossRef CAS.
- H.-X. Mai, Y.-W. Zhang, R. Si, Z.-G. Yan, L.-D. Sun, L.-P. You and C.-H. Yan, J. Am. Chem. Soc., 2006, 128, 6426 CrossRef CAS.
- S. M. Chang and R.-a. Doong, Chem. Mater., 2005, 17, 4837 CrossRef CAS.
- X. Guo, J. Phys. Chem. Solids, 1999, 60, 539 CrossRef CAS.
- P. Ghosh and A. Patra, Langmuir, 2006, 22, 6321 CrossRef CAS.
- P. S. Chowdhury, P. Ghosh and A. Patra, J. Lumin., 2007, 124, 327 CrossRef CAS.
- L. Manna, E. C. Scher and A. P. Alivisatos, J. Am. Chem. Soc., 2000, 122, 12700 CrossRef CAS.
- G. K. Williamson and W. H. Hall, Acta Metall., 1953, 1, 22 CrossRef CAS.
- P. Ghosh, A. Kar and A. Patra, J. Phys. Chem. C, 2010, 114, 715 CrossRef CAS.
- Y. Ni, H. Li, L. Jin and J. Hong, Cryst. Growth Des., 2009, 9, 3868 CrossRef CAS.
- P. Ghosh and A. Patra, J. Nanosci. Nanotechnol., 2008, 8, 3458 CrossRef CAS.
- D. H. Son, S. M. Hughes, Y. Yin and A. P. Aliivisatos, Science, 2004, 306, 1009 CrossRef CAS.
- R. Chai, H. Lian, C. Li, Z. Cheng, Z. Hou, S. Huang and J. Lin, J. Phys. Chem. C, 2009, 113, 8070 CrossRef CAS.
- S. D. Cheng, C. H. Kam and S. Buddhudu, Mater. Res. Bull., 2001, 36, 1131 CrossRef CAS.
- C. Peng, H. Zhang, J. Yu, Q. Meng, L. Fu, H. Li, L. Sun and X. Guo, J. Phys. Chem. B, 2005, 109, 15278 CrossRef CAS.
- G. Bühler and C. Feldmann, Angew. Chem., Int. Ed., 2006, 45, 4864 CrossRef.
- P. Ghosh, K. R. Priolkar and A. Patra, J. Phys. Chem. C, 2007, 111, 571 CrossRef CAS.
|
| This journal is © The Royal Society of Chemistry 2010 |
Click here to see how this site uses Cookies. View our privacy policy here. ![[thin space (1/6-em)]](https://www.rsc.org/images/entities/char_2009.gif) :
:![[thin space (1/6-em)]](https://www.rsc.org/images/entities/char_2009.gif) 8 and 6–7, respectively. Finally, a white precipitate was obtained. Particles were then collected by centrifugation (6000 rpm) and then the particles were washed twice with acetone and methanol and dried at 75 °C for 12 h in a vacuum oven and the crystalline particles were collected. Using the same method, Na(Y1.5Na0.5)F6:Ce:Tb nanocrystals are prepared by taking the required amount of cerium nitrate (for 1 mol % Ce2O3, Aldrich) and terbium nitrate (for 0.5 mol % Tb2O3, Aldrich). Scheme 1 represents the preparation of Na(Y1.5Na0.5)F6: Ce:Tb nanocrystals.
8 and 6–7, respectively. Finally, a white precipitate was obtained. Particles were then collected by centrifugation (6000 rpm) and then the particles were washed twice with acetone and methanol and dried at 75 °C for 12 h in a vacuum oven and the crystalline particles were collected. Using the same method, Na(Y1.5Na0.5)F6:Ce:Tb nanocrystals are prepared by taking the required amount of cerium nitrate (for 1 mol % Ce2O3, Aldrich) and terbium nitrate (for 0.5 mol % Tb2O3, Aldrich). Scheme 1 represents the preparation of Na(Y1.5Na0.5)F6: Ce:Tb nanocrystals.
![[thin space (1/6-em)]](https://www.rsc.org/images/entities/char_2009.gif) :
:![[thin space (1/6-em)]](https://www.rsc.org/images/entities/char_2009.gif) 8 ratio of Y3+
8 ratio of Y3+![[thin space (1/6-em)]](https://www.rsc.org/images/entities/char_2009.gif) :
:![[thin space (1/6-em)]](https://www.rsc.org/images/entities/char_2009.gif) F− and pH = 6–7. The phase composition, crystallite size and cell parameters as a function of doping and surface coating are summarized in Table 1. Fig. 1a depicts the XRD pattern of 75 °C dried 1 mol% Ce3+ doped Na(Y1.5Na0.5)F6 nanocrystals. All the diffraction peaks match well with the hexagonal Na(Y1.5Na0.5)F6 (JCPDS card no. 16-334) except the peaks marked with the asterisks. The peaks marked with the asterisks are due to the formation of monoclinic ammonium fluorolanthate (NH4)3Y2F9 (JCPDS card no. 43-0840). These can be easily removed by sonication leaving pure hexagonal Na(Y1.5Na0.5)F6 (supporting information Fig. S1†). It is reported earlier that ammonium fluorolanthate can form a layered structure with sodium yttrium fluoride which decomposes on heating.14 The XRD pattern of 75 °C dried 1 mol% Ce3+, 0.5 mol% Tb co-doped Na(Y1.5Na0.5)F6 nanocrystals is shown in Fig. 1b. Here, we obtained hexagonal sodium yttrium fluoride with a small amount of ammonium fluorolanthate and the diffraction peaks are slightly shifted to the right side compared to Fig. 1a. This gradual shifting of the diffraction lines indicates the effective doping. We calculated lattice volume and it is seen that the lattice volume of Tb3+ and Ce3+ co-doped sample decreases from the Ce3+-only doped sample (see Table 1) and it matches with the shifting of the diffraction peak. Multiple cationic sites are the main feature of the crystal structure of the hexagonal phase. According to Burn,28 there are three types of cation sites: one-fold site occupied by Y3+, one-fold site occupied randomly by ½ Na+ and ½ Y3+, and a twofold site occupied randomly by Na+ and vacancies of the structure of the hexagonal NaYF4. The fluoride coordination about the first two sites are nine-fold, whereas the cubic structure is like the fluorite type structure.29 Haase and coworkers16 and others also support the presence of 3 cationic sites inside the hexagonal phase. Fig. 1c depicts the XRD pattern of 75 °C dried core-shell NaYF4:Ce/Tb nanorods. Here, the major crystalline phase is cubic and the volume fraction of the cubic crystal phase is 85%. A drastic change in the crystal phase is observed due to the core-shell structure. It is well established that the cubic phase is a more disordered and thermodynamically unstable phase. The transition from hexagonal to a cubic phase has an order-to-disorder character with respect to the cations.30 This phase transition behavior can be controlled by changing the environment or changing the energy barrier. It is reported that the phase transition from cubic α-NaYF4 to β-NaYF4 is mainly due to the modification of the environment of Y3+ occupation sites, including coordination number.31,32 Thoma et al.33 reported that the kinetic energy influences the phase change from cubic to hexagonal NaYF4. Recently, Mai et al.34 also reported that the energy barrier is the main reason for β-NaREF4 formation. We have reported earlier that the cubic to hexagonal phase transition can be tuned by changing the reactant ratio (such as the Y3+/F− ratio), pH of the solution and heating temperature.14 To the best of our knowledge, the modification of the crystal structure of sodium yttrium fluoride nanocrystals by surface coating has not been reported in the literature. Several studies have reported that phase transformation is a surface phenomenon.35,36 It was earlier reported that 92% tetragonal ZrO2 was observed instead of monoclinic by surface coating by Eu2O3.37 Similarly, cubic uncapped CdS nanoparticles are converted to hexagonal CdS nanoparticles at 80 °C after coating with TSA (thiosalicylic acid) because of the small energy difference between the zinc blende and wurtzite structure of CdS.38,39 Similarly, the energy difference between the cubic and hexagonal phase of sodium yttrium fluoride nanocrystals is very small.14,15 In the present study, during surface coating of Na(Y1.5Na0.5)F6:Ce nanocrystals by TbF3, the surface energy changes at the interface, which drives the transformation from hexagonal to cubic phase. To understand the effect of surface energy behind the crystal phase change, we have first taken layered sodium yttrium fluoride (as prepared) and then dispersed it in water, followed by surface coating by TbF3. We obtained a similar hexagonal pattern like the as-prepared sample (supporting information Fig. S2a†). Here, no effect of surface coating on the crystal phase is observed. This is because the layered structure between sodium yttrium fluoride and ammonium fluorolanthate appears in the as-prepared sample. When as-prepared samples are sonicated strongly for 40 min in an open beaker kept in an ice bath, this layered structure is destroyed due to decomposition of (NH4)3Y2F9 and only hexagonal sodium yttrium fluoride prevails after sonication (supporting information Fig. S1†). However, after sonication, the crystal phase changes from hexagonal to cubic (supporting information Fig. S2b†). Thus, the crystal phase modification can be done by surface coating and sonication.
F− and pH = 6–7. The phase composition, crystallite size and cell parameters as a function of doping and surface coating are summarized in Table 1. Fig. 1a depicts the XRD pattern of 75 °C dried 1 mol% Ce3+ doped Na(Y1.5Na0.5)F6 nanocrystals. All the diffraction peaks match well with the hexagonal Na(Y1.5Na0.5)F6 (JCPDS card no. 16-334) except the peaks marked with the asterisks. The peaks marked with the asterisks are due to the formation of monoclinic ammonium fluorolanthate (NH4)3Y2F9 (JCPDS card no. 43-0840). These can be easily removed by sonication leaving pure hexagonal Na(Y1.5Na0.5)F6 (supporting information Fig. S1†). It is reported earlier that ammonium fluorolanthate can form a layered structure with sodium yttrium fluoride which decomposes on heating.14 The XRD pattern of 75 °C dried 1 mol% Ce3+, 0.5 mol% Tb co-doped Na(Y1.5Na0.5)F6 nanocrystals is shown in Fig. 1b. Here, we obtained hexagonal sodium yttrium fluoride with a small amount of ammonium fluorolanthate and the diffraction peaks are slightly shifted to the right side compared to Fig. 1a. This gradual shifting of the diffraction lines indicates the effective doping. We calculated lattice volume and it is seen that the lattice volume of Tb3+ and Ce3+ co-doped sample decreases from the Ce3+-only doped sample (see Table 1) and it matches with the shifting of the diffraction peak. Multiple cationic sites are the main feature of the crystal structure of the hexagonal phase. According to Burn,28 there are three types of cation sites: one-fold site occupied by Y3+, one-fold site occupied randomly by ½ Na+ and ½ Y3+, and a twofold site occupied randomly by Na+ and vacancies of the structure of the hexagonal NaYF4. The fluoride coordination about the first two sites are nine-fold, whereas the cubic structure is like the fluorite type structure.29 Haase and coworkers16 and others also support the presence of 3 cationic sites inside the hexagonal phase. Fig. 1c depicts the XRD pattern of 75 °C dried core-shell NaYF4:Ce/Tb nanorods. Here, the major crystalline phase is cubic and the volume fraction of the cubic crystal phase is 85%. A drastic change in the crystal phase is observed due to the core-shell structure. It is well established that the cubic phase is a more disordered and thermodynamically unstable phase. The transition from hexagonal to a cubic phase has an order-to-disorder character with respect to the cations.30 This phase transition behavior can be controlled by changing the environment or changing the energy barrier. It is reported that the phase transition from cubic α-NaYF4 to β-NaYF4 is mainly due to the modification of the environment of Y3+ occupation sites, including coordination number.31,32 Thoma et al.33 reported that the kinetic energy influences the phase change from cubic to hexagonal NaYF4. Recently, Mai et al.34 also reported that the energy barrier is the main reason for β-NaREF4 formation. We have reported earlier that the cubic to hexagonal phase transition can be tuned by changing the reactant ratio (such as the Y3+/F− ratio), pH of the solution and heating temperature.14 To the best of our knowledge, the modification of the crystal structure of sodium yttrium fluoride nanocrystals by surface coating has not been reported in the literature. Several studies have reported that phase transformation is a surface phenomenon.35,36 It was earlier reported that 92% tetragonal ZrO2 was observed instead of monoclinic by surface coating by Eu2O3.37 Similarly, cubic uncapped CdS nanoparticles are converted to hexagonal CdS nanoparticles at 80 °C after coating with TSA (thiosalicylic acid) because of the small energy difference between the zinc blende and wurtzite structure of CdS.38,39 Similarly, the energy difference between the cubic and hexagonal phase of sodium yttrium fluoride nanocrystals is very small.14,15 In the present study, during surface coating of Na(Y1.5Na0.5)F6:Ce nanocrystals by TbF3, the surface energy changes at the interface, which drives the transformation from hexagonal to cubic phase. To understand the effect of surface energy behind the crystal phase change, we have first taken layered sodium yttrium fluoride (as prepared) and then dispersed it in water, followed by surface coating by TbF3. We obtained a similar hexagonal pattern like the as-prepared sample (supporting information Fig. S2a†). Here, no effect of surface coating on the crystal phase is observed. This is because the layered structure between sodium yttrium fluoride and ammonium fluorolanthate appears in the as-prepared sample. When as-prepared samples are sonicated strongly for 40 min in an open beaker kept in an ice bath, this layered structure is destroyed due to decomposition of (NH4)3Y2F9 and only hexagonal sodium yttrium fluoride prevails after sonication (supporting information Fig. S1†). However, after sonication, the crystal phase changes from hexagonal to cubic (supporting information Fig. S2b†). Thus, the crystal phase modification can be done by surface coating and sonication.
