Visible light induced photobleaching of methylene blue over melamine-doped TiO2 nanocatalyst†
Jurate
Virkutyte‡
*,
Babita
Baruwati§
and
Rajender S.
Varma
*
Sustainable Technology Division, National Risk Management Research Laboratory, Environmental Protection Agency, MS 443, 26 West M. L. K. Drive, Cincinnati, Ohio 45268, USA. E-mail: Virkutyte.Jurate@epa.gov; Baruwati.Babita@epa.gov; Varma.Rajender@epa.gov; Fax: +1 5135697677; Tel: +1 5134872701
First published on 11th May 2010
Abstract
TiO2 doping with N-rich melamine produced a stable, active and visible light sensitized nanocatalyst that showed a remarkable efficiency towards the photobleaching of a model compound – methylene blue (MB) in aqueous solution. The photobleaching followed a mixed reaction order kinetics with the distinctive induction and acceleration periods.
TiO2 is one of the most promising photocatalysts for various applications including degradation of organic pollutants in both liquid and gas phase environments, photocatalytic dissociation of water, partial oxidation of aromatic hydrocarbons under room temperature and atmospheric pressure, air purification, antibacterial and self-cleaning coatings, sterilization, antifouling and demisting.1–5
However, the main drawback of photocatalysis is that titanium dioxide is only active in the UV range (<390 nm) due to the very large band gap of 3.2 eV.6,7 Therefore it must be modified in order to take advantage of abundant solar light or be applicable for use in poorly illuminated indoor areas.8 Thus, it is important to expand the range of TiO2 photocatalytic activity for practical purposes, i.e. to narrow the band gap of the catalyst to allow electron excitation in the visible (400–800 nm) light range.9 Various approaches are pursued with cationic10 and anionic5,6,11 doping of TiO2.
Doping with nitrogen results in substitutional ((NO)s, Nsetc.) and interstitial ((NO)x, Nx, etc.) nitrogen species.12 It has been determined that increased photocatalytic activity of N-doped TiO2 under visible light is attributed to the narrowing of the band gap by mixing the O 2p and substitutional N 2p states as well as interstitial N species doped into the TiO2 lattice.6,13 However, many of N-doping methods require high temperature and usage of expensive precursors or preparation instruments.5
Herein, we present a facile and simple visible light sensitization of nano TiO2 with melamine as N-doping agent and its applicability for the photobleaching of the model pollutant methylene blue in aqueous solution.
N-doped TiO2 nano-powders were prepared by a simple sol–gel method: 20 g of TiCl4 (digested to 50% in HCl) was dispersed in 1000 ml of distilled water. Then 80 g of melamine was added to the solution and magnetically stirred for 30 min. The amount of dopant was calculated based on the assumption that in order to assure an increased photocatalytic activity, the content of nitrogen in the catalyst after hydrolysis should not be less than 0.5 wt% of the catalyst dry mass.14 Therefore, the ratio between the molar concentration of Ti4+ and melamine was maintained at 1![[thin space (1/6-em)]](https://www.rsc.org/images/entities/char_2009.gif) :
:![[thin space (1/6-em)]](https://www.rsc.org/images/entities/char_2009.gif) 4.
4.
Ammonium hydroxide (NH4OH, 33 wt%) solution was added to bring the pH of the solution to 9. The reaction was then stirred for 24 h at room temperature and atmospheric pressure. The final product was dried at 60 °C overnight in air, powdered, calcined at 450 °C for 2 h and characterized by means of thermogravimetric analysis (TGA), X-ray diffraction (XRD), diffuse reflectance spectroscopy (DRS) and scanning electron microscopy (SEM-EDS). The yellow color of calcined N-doped TiO2 suggested its ability to absorb light in the visible region.15
The UV DRS spectra were recorded on a Shimadzu UV-250IPC instrument in the range 200 to 800 nm. Crystal structure patterns of N-doped TiO2 powder samples were examined by X'Pert Pro MPD X-ray diffractometer with a Cu-Kα source and diffraction angle range of 2θ = 10 to 70°. The data was collected at a step of 1 degree min−1 and a typical angle of 0.5°. The average crystallite size (d) was calculated as a function of the peak width (d = Kλ/βcosθ) according to the Sherrer's equation, where λ is the wavelength of X-rays (0.154 nm Cu-Kα), β is the full width at half maximum (FWHM) in radians and θ is the Bragg angle in degrees. The thermogravimetric analysis (TGA) was performed using a TGA Q5000 (TA Instruments) analyzer with a heating rate of 10 °C min−1 in an air flow employing a ramp method (temperature increase from 100 to 1200 °C). The morphology and elemental composition analysis were performed by scanning electron microscopy (SEM, FEI XL30 ESEM) equipped with EDS (energy dispersive X-ray spectroscopy) operating at 15–30 kV on gold-sputtered samples. TEM micrographs were recorded on a Phillips CM 20 TEM microscope at an operating voltage of 200 kV.
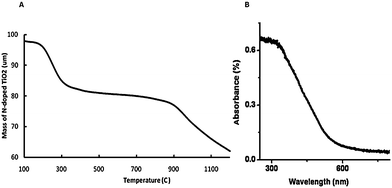
Fig. 1a presents a thermal decomposition profile of N-doped TiO2 in air. There are three distinct regions at 100–150, 250–300 and 700–1100 °C. The weight loss in the first region may be attributed to the adsorbed water, the second is due to the decomposition of free and non-complexed melamine, whereas last region may be assigned to the degradation of residuals, which are formed during the oxidation of melamine.16
 | ||
| Fig. 1 (a) Thermogravimetric spectra and (b) UV-vis diffuse reflectance spectra for N-doped TiO2 nanocatalyst calcined at 450 °C. | ||
Diffuse reflectance UV-vis spectra is presented in Fig. 1b. It shows the adsorption of N-doped TiO2 in the visible light region. The band gap energy was 2.2 eV in the nano N-doped TiO2, which was estimated for the absorption edge17 (E (eV) = 1240/λ (nm)), where the adsorption threshold was 568 nm. The first edge (∼400 nm) may be attributed to the band structure of original titania,18 whereas the edge at 568 nm is assigned to the newly formed N 2p band (Fig. 1b). The band gap narrowing may be attributed to the doping of interstitial N species, i.e. the narrowing of isolated N 2p band formed above the O 2p valence band.3,16
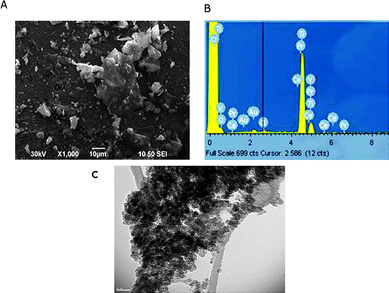
An SEM image of N-doped TiO2 nanocatalyst calcined at 450 °C is shown in Fig. 2a. Combined with XRD data it is evident that N-doped TiO2 powder is agglomerated to some degree after calcination, with some larger particles remaining intact after heating. The EDS data of N-doped TiO2 is shown in Fig. 2b. The nano catalyst shows a peak around 0.2–0.3 keV, which is attributed to TiO2 surface and an intense peak at about 4.5 keV, which is assigned to TiO2 in the bulk form.19 TEM images of N-doped TiO2 are shown in Fig. 2c. It is clear that no porous structure was formed during calcination at 450 °C and nearly cubical particles prevailed. Moreover, the particle size in N-doped TiO2 nanocatalyst was less than 20 nm, which is in a good agreement with that obtained from XRD patterns.
 | ||
| Fig. 2 Representative (a) SEM microgram, (b) EDS pattern and (c) TEM microgram of N-doped TiO2 nanocatalyst. | ||
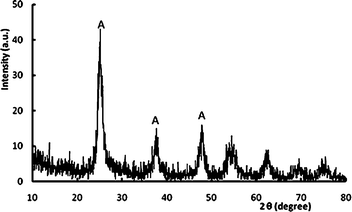
The X-ray diffraction pattern of N-doped TiO2 photocatalyst is presented in Fig. 3. Clearly, the as-prepared photocatalyst exhibited an XRD pattern that can be attributed to anatase with strong peaks at 25°, 38° and 48°.2,4 The average crystallite size of N-doped TiO2 calculated from Sherrer's equation was 17.3 nm.
 | ||
| Fig. 3 XRD pattern of N-doped TiO2 nanocatalyst calcined at 450 °C. | ||
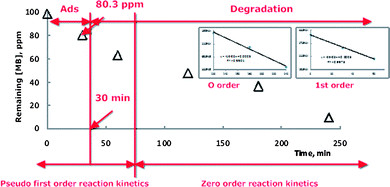
The photobleaching of methylene blue (MB) as the model pollutant was quantified by measuring its degradation rates under visible light in the presence of synthesized N-doped TiO2 photocatalyst. 3 g L−1 of as-prepared N-doped TiO2 was dispersed in 20 ml of fresh MB solution (100 ppm). Before irradiation, the reaction suspension was magnetically stirred in the dark for 30 min to obtain an equilibrium of MB on the N-doped TiO2 surface. Moreover, the non-adsorbed MB concentration (80.3 ppm) was taken as the initial concentration to evaluate the efficiency of photobleaching. A medium pressure metal halogen desk lamp (300 W) was used as a visible light source. To cut the infrared irradiation, the glass reactor was inserted into a water circulating jacket and continuously bubbled with O2. The MB photobleaching was monitored by collecting time-sequenced (every 60 min) aliquots, which were subsequently filtered through a 0.45 μm PTFE syringe filter to remove TiO2 particles. The absorption spectra was recorded using Hewlett Packard 854× UV-Visible instrument at a maximum peak of 664 nm from which the photocatalytic activity was evaluated. Triple photocatalytic experiments were performed under the identical reaction conditions to determine reproducibility.
The formation of visible light active N-doped TiO2 is as follows:4
 | ||
| Fig. 4 Visible light-induced photobleaching of methylene blue over N-doped TiO2 nanocatalyst. | ||
High photocatalytic activity of the N-doped TiO2 samples were assigned to the activity of highly crystalline anatase.9,16 Moreover, as oxygen was continuously supplied to the reaction system, electrons were trapped in the conduction band to form ˙O2− which could subsequently generate active ˙OOH radicals5 that contributed to the increased photobleaching of MB.
We have revealed that N-rich melamine doping of TiO2 produced an extremely efficient and stable nanophotocatalyst that is activated in the visible light range due to the narrowing of the band gap from 3.2 eV for pure anatase to 2.2 eV for as-synthesized nanocatalyst. The data obtained during this research can be utilized in the fabrication of stable and photoactive nanocatalysts that are effective in the visible light range and may be used for various environmental applications, partial or full oxidation of hydrocarbons, etc.
Further work on the optimisation of the synthesis and the reaction conditions, and a detailed discussion of the different synthesis parameters on the structural properties and the photocatalytic activity in the visible light range is currently under way.
J. V. is National Research Council funded Research Associate and B. B. is ORISE fellow at US EPA, Cincinnati, Ohio, USA. Dr. Mallikarjuna Nadagouda is particularly acknowledged for the SEM and EDS measurements.
Notes and references
- J. Choi, H. Park and M. R. Hoffmann, J. Phys. Chem. C, 2010, 114, 783 CrossRef CAS; Fujishima, T. N. Rao and D. A. Tryk, J. Photochem. Photobiol., C, 2000, 1, 1 CrossRef CAS.
- A. Kubacka, B. Bachiller-Baeza, G. Colón and M. Fernández-García, Appl. Catal., B, 2010, 93, 274 CrossRef CAS.
- J. Fang, F. Wang, K. Qian, H. Bao, Z. Jiang and W. Huang, J. Phys. Chem. C, 2008, 112, 18150 CrossRef CAS.
- S. Sato, R. Nakamura and S. Abe, Appl. Catal., A, 2005, 284, 131 CrossRef CAS.
- S. Yin, K. Ihara, Y. Aita, M. Komatsu and T. Sato, J. Photochem. Photobiol., A, 2006, 179, 105 CrossRef CAS.
- R. Asahi, T. Morikawa, T. Ohwaki, K. Aoki and Y. Taga, Science, 2001, 293, 269 CrossRef CAS.
- G. Liu, H. G. Yang, X. Wang, L. Cheng, J. Pan, G. Q. Lu and H.-M. Cheng, J. Am. Chem. Soc., 2009, 131, 12868 CrossRef CAS.
- A. Maldotti, A. Molinari and R. Amadelli, Chem. Rev., 2002, 102, 3811 CrossRef CAS; Y. Shiraishi and T. Hirai, J. Photochem. Photobiol., C, 2008, 9, 157 CrossRef CAS.
- M. D'Arienzo, R. Scotti, L. Wahba, C. Battocchio, E. Bemporad, A. Nale and F. Morazzoni, Appl. Catal., B, 2009, 93, 149 CrossRef CAS.
- J. Zhu, F. Chen, J. Zhang, H. Chen and M. Anpo, J. Photochem. Photobiol., A, 2006, 180, 196 CrossRef CAS; X. Zhang and L. Lei, Mater. Lett., 2008, 62, 895 CrossRef CAS; T. Ohno, F. Tanigawa, K. Fujihara, S. Izumi and M. Matsumura, J. Photochem. Photobiol., A, 1999, 127, 107 CrossRef CAS; R. Niishiro, H. Kato and A. Kudo, Phys. Chem. Chem. Phys., 2005, 7, 2241 RSC.
- G. Wu, T. Nishikawa, B. Ohtani and A. Chen, Chem. Mater., 2007, 19, 4530 CrossRef CAS; T. Yamaki, T. Sumita and S. Yamamoto, J. Mater. Sci. Lett., 2002, 21, 33 CrossRef CAS; Q. Li, R. Xie, Y. W. Li, E. A. Mintz and J. K. Shang, Environ. Sci. Technol., 2007, 41, 5050 CrossRef CAS; J. L. Gole, J. D. Stout, C. Burda, Y. Lou and X. Chen, J. Phys. Chem. B, 2004, 108, 1230 CrossRef CAS; K. Madhusudan Reddy, B. Baruwati, M. Jayalakshmi, M. Mohan Rao and S. V. Manorama, J. Solid State Chem., 2005, 178, 3352 CrossRef CAS.
- S. Rehman, R. Ullah, A. M. Butt and N. D. Gohar, J. Hazard. Mater., 2009, 170, 560 CrossRef CAS; R. Asahi and T. Morikawa, Chem. Phys., 2007, 339, 57 CrossRef CAS.
- H. Irie, S. Washizuka and K. Hashimoto, Thin Solid Films, 2006, 510, 21 CrossRef CAS; O. Diwald, T. L. Thompson, T. Zubkov, S. D. Walck and J. T. Yates, J. Phys. Chem. B, 2004, 108, 6004 CrossRef CAS.
- A. Zaleska, P. Górska, J. W. Sobczak and J. Hupka, Appl. Catal., B, 2007, 76, 1 CrossRef CAS.
- X. Chen and C. Burda, J. Am. Chem. Soc., 2008, 130, 5018 CrossRef CAS.
- M. Sathish, B. Viswanathan and R. P. Viswanath, Appl. Catal., B, 2007, 74, 307 CrossRef CAS.
- H.-Y. Xu, Z. Zheng and G.-J. Mao, J. Hazard. Mater., 2010, 175, 658 CrossRef CAS.
- A. R. Gandhe, S. P. Naik and J. B. Fernandes, Microporous Mesoporous Mater., 2005, 87, 103 CrossRef CAS.
- M. Hamadanian, A. Reisi-Vanani and A. Majedi, Mater. Chem. Phys., 2009, 116, 376 CrossRef CAS.
Footnotes |
| † Electronic supplementary information (ESI) available: Fig. S1. See DOI: 10.1039/c0nr00089b/ |
| ‡ NRC Research Associate. |
| § ORISE fellow. |
| This journal is © The Royal Society of Chemistry 2010 |

