Microemulsion-based synthesis of nanoscaled silver hollow spheres and direct comparison with massive particles of similar size
Christian
Kind
a,
Radian
Popescu
b,
Erich
Müller
b,
Dagmar
Gerthsen
b and
Claus
Feldmann
*a
aInstitut für Anorganische Chemie, Karlsruhe Institute of Technology (KIT), Engesserstrasse 15, D-76131, Karlsruhe, Germany. E-mail: claus.feldmann@kit.edu; Fax: +49-721-6084892; Tel: +49-721-6082855
bLaboratorium für Elektronenmikroskopie, Karlsruhe Institute of Technology (KIT), Engesserstrasse 7, D-76131, Karlsruhe, Germany
First published on 6th August 2010
Abstract
Nanoscale silver hollow spheres are first prepared via a microemulsion approach with 15–20 nm as the outer diameter, 3–5 nm as the wall thickness, and 10–15 nm as the diameter of the inner cavity. The presence of hollow spheres is confirmed by electron microscopy (SEM, BF-/HAADF-STEM, HRTEM) as well as by X-ray diffraction with a line-shape analysis to characterize the microcrystalline properties. In addition to the hollow spheres, massive silver nanoparticles of similar size (outer diameter of 15–20 nm) are gained via microemulsions. Based on the similarity of experimental conditions and the resulting particle size, as-prepared silver hollow spheres and massive nanoparticles are used to compare their optical properties and surface-plasmon resonance. In contrast to reducing the diameter of massive particles, “hollowing” of silver nanoparticles leads to a red-shift of the plasmon resonance. With a red shift of about 33 nm in the case of the hollow spheres, a quantum-size effect is indeed observed and in accordance with the thin sphere wall.
1. Introduction
Nanoscaled silver arouses particular interest due to its antimicrobial properties,1 its use for thin-film electrodes2 and its applicability in oxidation catalysis.3 Nanoscaled silver is furthermore well-known for its colour that is closely correlated to the underlying particle size and morphology.4 Similar to well-known gold nanoparticles, colour and morphological colour-shift originate from the size-dependence of the surface-plasmon resonance. Thus, nanoscaled silver and gold belong to the most prominent examples for quantum-size effects.5 Since the colour can be shifted throughout the whole visible spectrum, the nanoscaled metals are widely applied as colour pigments.6 Even more challenging, the plasmon resonance can be used for biological and medical detection.7 Here, especially nanoscale gold is widely used as a biomarker, in particular, to detect biomolecules, cells and viruses, or even to directly observe gene regulation.8In comparison to quasi-zero-dimensional massive metal nanoparticles (i.e., outer diameter < 5 nm), nanoscale hollow spheres exhibit a quasi-infinite two-dimensional layer (viz. is along the sphere wall) as well as a quasi-zero-dimensional direction (viz. is perpendicular to the sphere wall). Such morphology could lead to quantum-size effects that differ from massive particles of similar size.9 Moreover, the outer and inner surfaces of hollow spheres may allow specific surfaces that are otherwise only reached by very small particles. The latter, however, are difficult to prepare and tend to rapid agglomeration. To this concern, the extended surface of hollow spheres can be advantageous from the perspective of biocidity and catalysis, too.
To date, literature addressing the synthesis of silver hollow spheres is rather limited. Although, miscellaneous synthetic approaches—mainly including emulsion techniques and hard templates—have been involved, polycrystalline and agglomerated hollow spheres have been gained most often.10–18 Moreover, hollow spheres of metallic silver have been only reported with diameters exceeding 100 nm. In this study, non-agglomerated silver hollow spheres with diameters <50 nm are firstly realised. Synthesis was performed via a microemulsion-based strategy.19 Based on very similar experimental conditions, but an essential difference regarding the addition of the starting materials, the microemulsion approach allows to prepare silver hollow spheres as well as massive silver nanoparticles of similar size. Consequently, the optical properties and eventual quantum-size effects can be validated based on both morphologies. Such a comparison of hollow spheres and massive nanoparticle—based on similar conditions of synthesis and an identical surface functionalisation—has been barely applied till now.
2. Experimental section
2.1 Materials and synthesis
All chemicals were applied as received: n-dodecane (99%, ABCR); cetyltrimethylammonium tosylate (CTATos, ≥99%, Merck); 1-hexanol (98%, Fluka); silver nitrate (99.8%, Riedel de Haën); triphenylphosphine (99%, ABCR); sodium borohydride (95%, Riedel de Haën); ethanol (98%, Seulberger); sodium hydroxide (≥99%, Riedel de Haën) and polyvinylpyrrolidone (PVP, Aldrich). Aqueous solutions were prepared by using demineralised water. [Ag(PPh3)4]NO3 as a starting material was synthesised as given elsewhere; its purity was validated via FT-IR spectroscopy.202.2 Materials characterisation and analytical tools
Low-energy scanning transmission electron microscopy (STEM) was performed on a Zeiss Supra 40 VP, using an acceleration voltage of 20 kV and a working distance of 4 mm to analyse the size distribution and shape of the particles. Further low-energy STEM measurements were carried out at 30 kV with a FEI Strata 400S in the bright-field (BF) and high-angle annular dark-field (HAADF) mode to resolve the cavity of the silver hollow spheres. The measured STEM intensity was evaluated on the basis of Monte-Carlo simulations performed with the NIST-Monte programme package21 to quantify the local sample thickness. Samples for low-energy STEM were prepared by evaporating dispersions of as-prepared particles in diethylene glycol (DEG) on an amorphous carbon (Lacey-)film copper grid for 10 h by slowly heating up the sample from room temperature to 100 °C in vacuum. Transmission electron microscopy (TEM) was conducted using a Philips CM 200 FEG/ST microscope operated at 200 kV. TEM samples were prepared by evaporating ethanolic dispersions on a Lacey-film copper grid, followed by 4 h drying at 50 °C in vacuum or out of dispersions of as-prepared particles in DEG evaporated by slowly heating up the sample from room temperature to 100 °C in vacuum for 10 h. Dynamic light scattering (DLS) was performed with a Nanosizer ZS from Malvern Instruments (equipped with a He–Ne laser (633 nm), detection via non-invasive back scattering at an angle of 173°, 256 detector channels and polystyrene cuvettes). X-Ray powder diffraction (XRD) was carried out with a Stoe Stadi-P diffractometer using Ge-monochromatised Cu-Kα1 radiation. Fourier-transform infrared spectra (FT-IR) were recorded on a Bruker Vertex 70 FT-IR spectrometer using KBr pellets. For this purpose 400 mg of dried KBr were carefully pestled with 1 mg of the sample and pressed to a thin pellet. UV-Vis spectra were recorded with a Varian Cary Scan 100 and dispersions of the as-prepared hollow spheres as well as massive silver nanoparticles in ethanol. Measurements were performed in transmission geometry since a significant contribution due to scattering is not expected for particle diameters below 50 nm, and which was indeed not observed here, too.22,23 In order not to cause a significant shift of the plasmon resonance due to stabilising agents such as long-chained alkylamines, alkylthioles or alkylcarbonic acids, both types of nanoparticles—after separation from the microemulsion and careful washing—were redispersed in ethanol. Excessive dilution was also avoided to guarantee for sufficient absorption, resulting in dispersions containing approximately 1 wt% of Ag hollow spheres and massive Ag nanoparticles. Right in advance to recording UV-Vis spectra, the suspensions were selectively centrifuged at 7000 rpm to avoid misinterpretation due to beginning agglomeration of the weakly stabilized particles. Note that a centrifugation of non-agglomerated hollow spheres and massive silver nanoparticles needs at least 20![[thin space (1/6-em)]](https://www.rsc.org/images/entities/char_2009.gif) 000 rpm for separation. We also observed that a beginning agglomeration of the nanoparticles only resulted in a broadened plasmon resonance, whereas the position of the maximum is not affected.
000 rpm for separation. We also observed that a beginning agglomeration of the nanoparticles only resulted in a broadened plasmon resonance, whereas the position of the maximum is not affected.
3. Results and discussion
3.1 Strategy of synthesis
Hollow spheres and massive silver nanoparticles are here gained via very similar experimental conditions, however, with an essential difference regarding the strategy to precisely establish the one or other morphology. Typically, the underlying microemulsion synthesis is performed by mixing of two separate w/o-(water-in-oil)-micellar systems, each of them containing an appropriate starting material inside the respective micelles. When admixing both microemulsions coalescence of the micelles occurs and initiates the reaction of the starting materials inside the nanosized aqueous droplets. This strategy is well-known and reported in more than 300 papers per year.24–27 We also use this approach to gain massive silver nanoparticles with a first w/o-microemulsion that contained AgNO3 and a second w/o-microemulsion that contained NaBH4 as a starting material (Fig. 1b).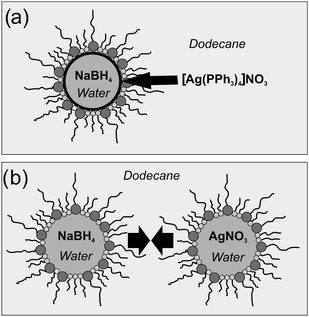 | ||
| Fig. 1 Schematic mechanism of the formation of (a) nanoscale silver hollow spheres at the liquid-to-liquid phase-boundary of a w/o-micelle and (b) massive silver nanoparticles by coalescence of two separate micellar systems. | ||
To realise nanoscale hollow spheres, again, microemulsion techniques were performed, however, with the starting materials now located in different phases—one reactant inside the aqueous micelles while the second was added to the non-polar dispersant phase (Fig. 1a).28,29 As a consequence, the reaction yet proceeds at the liquid-to-liquid phase boundary. To initiate this diffusion-controlled reaction and to strictly limit the formation of the solid at the phase boundary, appropriate experimental conditions are prerequisite. This includes a suited type and concentration of the starting materials, a sufficient solubility/non-solubility of the relevant starting material in the water-/oil-phase as well as a sufficient reaction rate. In detail, the non-polar compound [Ag(PPh3)4]NO3 was added to the oil-phase; NaBH4 as a water-soluble reducing agent was added to the polar phase (Fig. 1a). To control diffusion and reaction rate, reduction of silver was started—subsequent to the addition of the silver precursor—at decreased temperature (0 °C) and over a long period of time (20 h). Subsequent to this initial formation of a first, very thin solid shell, the reaction rate was sped up by slowly increasing the temperature to 60 °C. Finally, the blackish grey product was separated by centrifugation and carefully purified to remove the ingredients of the microemulsion (i.e. surfactants, residual precursors and salts and oil-phase).
3.2 Particle morphology and material crystallinity
Subsequent to synthesis and purification, as-prepared silver hollow spheres and massive silver nanoparticles were resuspended in ethanol. Accordingly, colloidally stable suspensions exhibiting a yellowish colour were gained. Since a direct comparison of silver hollow spheres and massive silver nanoparticles is aimed in this study, the experimental conditions were optimised to guarantee for similar sizes. The result of the synthesis was first investigated by dynamic light scattering. To this concern, a mean outer diameter of 18(3) nm was deduced for the hollow spheres as well as for massive nanoparticles (Fig. 2). These identical values as well as a similar narrow size distribution prove that nanoparticles of similar size were indeed realised via the microemulsion approach. As-prepared suspensions in ethanol show certain sedimentation after some days due to slow formation of agglomerates. This agglomeration can be completely precluded by suspending in ethanol with 0.04 wt% polyvinylpyrrolidone (PVP) as a surface stabiliser.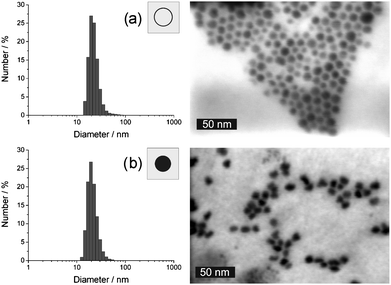 | ||
| Fig. 2 Size and size distribution according to DLS analysis and STEM images: (a) as-prepared silver hollow spheres and (b) massive silver nanoparticles (DLS subsequent to redispersion in ethanol). | ||
Size and morphology of as-prepared silver nanoparticles were further elucidated by electron microscopy. To overview the particle shape and size, STEM images were recorded (Fig. 2). Here, spherical and nearly monodisperse particles with 15–20 nm in size are observed for both, as-prepared hollow spheres and massive silver nanoparticles. To reliably prove the presence of hollow spheres, HRTEM was involved (Fig. 3a). Here, ring-type structures are visible as a two-dimensional projection of the three-dimensional hollow spheres. Based on a statistical evaluation of 56 particles, the outer diameter is again confirmed to about 15–20 nm, while the wall thickness can be deduced to 3–5 nm.
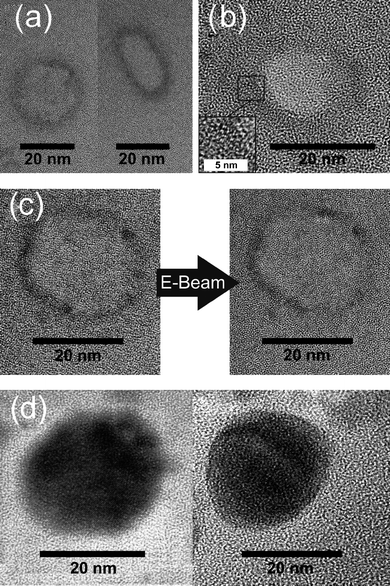 | ||
| Fig. 3 HRTEM images of silver nanoparticles: (a) images of different as-prepared silver hollow spheres with (b) lattice fringes indicating the crystallinity of the sphere wall; (c) images of a selected hollow sphere taken consecutively within a few seconds, showing the fragility of the hollow spheres when exposed to the electron beam; (d) high-resolution images of massive silver nanoparticles with lattice fringes. | ||
According to HRTEM images massive silver nanoparticles are crystalline and exhibit lattice fringes with a d-value of 2.4 Å (Fig. 3d). This matches well with the (111) lattice plane of elemental Ag (2.36 Å).30 Similar lattice fringes and d-values are also observed for the hollow spheres and indicate the crystallinity of the sphere wall (inset of Fig. 3b). In contrast to massive silver particles, however, the hollow spheres turned out to be extremely sensitive to the electron beam. Already after few seconds of illumination with high-energy electrons the hollow spheres show a significant loss of contrast and a complete collapse of the sphere structure. This is accompanied by a rapidly proceeding removal of the wall material (Fig. 3c). Moreover, a certain amount of massive silver particles, exhibiting diameters that are smaller than those of the hollow spheres, is observed in TEM analysis. In sum, these findings can be explained by the phenomenon of “quasi-melting”,31–34 which has been observed for hollow spheres already.27 Considering the rapid destruction of the hollow spheres under TEM conditions, the observation of residual massive particles is certainly not a surprise.35
Low-energy scanning transmission electron microscopy (STEM) images of as-prepared silver hollow spheres recorded at 30 keV in the bright-field (BF) and high-angle annular dark-field (HAADF) mode are shown in Fig. 4a and b. Electron-beam induced degradation of the particles is significantly reduced at 30 keV compared to TEM studies at 200 keV which allows a detailed analysis of the particle structure. The inner cavity can be clearly resolved in Fig. 4a where the BF-STEM intensity is higher compared to the darker wall regions. The contrast behaviour is reversed in the HAADF-STEM image Fig. 4b which shows another particle. BF-STEM images do not only show the projected particle size but in addition allow for quantification of the thickness of the sample along the electron beam direction if the chemical composition of the sample is known. This quantification is based on Monte-Carlo simulations which yield the transmitted electron intensity taking into account the specific detector data.36 The calculated BF intensity (transmission) of silver is shown in Fig. 4d as a function of the sample thickness (vacuum corresponds to a transmission of 1). Using the calculated transmission intensity profile in Fig. 4c—across the particle shown in Fig. 4a—the sample thickness can be quantified. Note that the background intensity of the carbon support film was subtracted from the BF intensity measured in the region of the hollow sphere which yields a transmission of 1 outside of the particle (region “1” in Fig. 4a and c). The transmitted intensity decreases to a value ∼0.4 in the wall of the hollow sphere (regions “2” in Fig. 4a and c) which corresponds to an Ag thickness of ∼17 nm. The transmission at the central cavity (region “3”) reaches 0.65 which corresponds to an Ag thickness of ∼9 nm. The measured thickness of the particle in Fig. 4a suggests an ellipsoid-type shape which is consistent with the data obtained by DLS and XRD (see below).
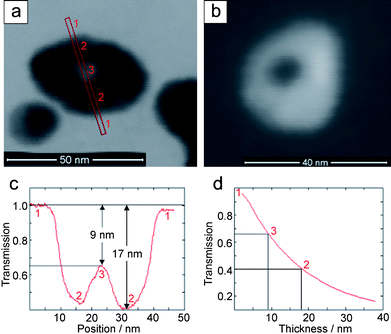 | ||
| Fig. 4 Low-energy STEM images of silver hollow spheres recorded at 30 keV in the (a) BF-mode at 30 kV and (b) HAADF-mode. (c) Intensity profile through the hollow sphere in (a). (d) Transmission in the BF-mode calculated by Monte-Carlo simulations as a function of the Ag thickness. The cross-section of the hollow sphere along the direction of transmission is indicated by vacuum: 1, maximum wall thickness: 2 and center of the inner cavity: 3. | ||
X-Ray powder diffraction (XRD) pattern of both as-prepared nanomaterials are shown in Fig. 5. Both—the hollow spheres as well as massive nanoparticles—turn out to be highly crystalline. From the XRD peak positions lattice parameters of a = 407.7 ± 1 pm (massive particles) and a = 409.0 ± 3 pm (hollow spheres) were determined, which are in good agreement with a = 408.5 pm of face-centred cubic bulk-silver.30 The reflections of the hollow spheres (Fig. 5a) are significantly broadened in comparison to those of massive particles (Fig. 5b). This finding points to a smaller crystallite size and is well in agreement with the shell-like structure. Line shapes of all Bragg peaks were derived via Voigt-functions and used to determine the microcrystalline properties.37 Thus, an average crystallite size of 24 nm along the (111)- and (110)-direction, and of 17 nm along (001) was calculated for massive silver particles from the single-line integral width. In the case of the hollow spheres, values of 9 nm along (111) and (110) as well as 6 nm along (001) were gained. These data suggest a slightly elliptical shape of both types of nanoparticles, which is indeed frequently observed in STEM and TEM images (Fig. 2, 3 and 4a). Finally, microstrain of the nanoparticles as indicated by the 〈ε2〉1/2 value was verified. This results to 3.3–4.9 × 10⁻⁴ for massive nanoparticles and to 8.6–19.1 × 10⁻⁴ for the hollow spheres.37 Altogether, these data are consistent with data stemming from DLS, SEM, STEM and TEM. However, it should also be mentioned that the significance is certainly reduced based on only three Bragg peaks available at comparably low θ angles. Moreover, the scattering behaviour and form factor of hollow spheres will be slightly different from massive particles.
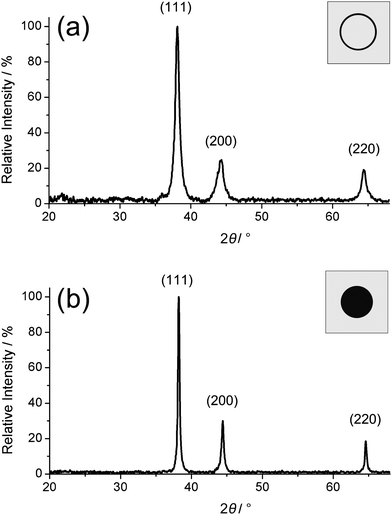 | ||
| Fig. 5 X-Ray powder diffraction patterns of as-prepared silver hollow spheres (a) and massive silver nanoparticles (b). | ||
3.3 Optical properties and quantum-size effects
Optical properties related to resonant excitation of surface plasmons have been intensively studied in literature.1–5,38,39 To date, lots of different particle sizes and shapes, especially in the case of silver and gold have been investigated. A direct comparison of hollow and massive nanoparticles in order to extract the initial effect of the different morphology is hardly available since the materials typically do not only differ in shape, but also in size and size distribution. To this concern, hollow spheres and massive nanoparticles as gained here via the microemulsion approach should be well suited to compare both morphologies. In addition to size and shape, however, the surface functionalisation can influence the surface-plasmon resonance, too. Here, the similar experimental conditions will neglect this effect. Thus, FT-IR spectra of both samples indeed confirm the surface functionalisation to be identical. To this concern, characteristic vibrations of water (ν(OH): 3450–3250 cm−1, δ(H2O): 1650–1600 cm−1) as well as minor amounts of surfactant (ν(CH): 2950–2850 cm−1, fingerprint area: 1300–800 cm−1) are visible (Fig. 6). Thus, any shift of the plasmon resonance due to different surface conditioning can be excluded in the following.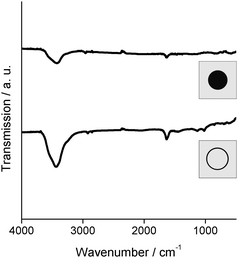 | ||
| Fig. 6 FT-IR spectra of as-prepared silver hollow spheres and massive silver nanoparticles indicating a similar surface conditioning. | ||
Based on identical size, size distribution and surface conditioning, finally, the optical properties of as-prepared hollow spheres and massive silver nanoparticles were studied. To this respect, suspensions of both nanomaterials in ethanol were used to record UV-Vis spectra (Fig. 7). Thus, the absorption maximum of silver hollow spheres was determined at a wavelength of 432 nm. In the case of massive silver nanoparticles the absorption maximum appeared at 399 nm. The line-width of the plasmon resonance for the hollow spheres with about 130 nm (FWHM: full-width-at-half maximum) is somewhat broader than for similar-sized massive Ag or Au nanoparticles (70–120 nm),22,23 but well in accordance with data observed for gold hollow spheres (110–160 nm).40,41 The red-shift of 33 nm—as observed here for the hollow spheres—can be also compared to differently sized massive nanoparticles. To this concern, theoretical considerations and experimental data have validated a blue-shift of about 30 nm when decreasing the diameter of massive nanoparticles by about 50 nm.42 This finding and correlation are schematically illustrated in Fig. 8.
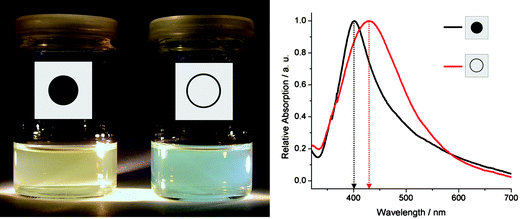 | ||
| Fig. 7 Optical properties of as-prepared silver hollow spheres and massive silver nanoparticles in ethanol: Photo of suspensions as well as UV-Vis spectra with shifted surface-plasmon resonance absorption of as-prepared hollow spheres (red) and massive silver nanoparticles (black). | ||
 | ||
| Fig. 8 Scheme illustrating the energy of the plasmon resonance absorption when decreasing the outer diameter of massive nanoparticles and upon “hollowing” the particles to become hollow spheres (with d1/d2: diameter; note that the visible colour as adumbrated above is complementary to the plasmon absorption).45 | ||
Obviously, “hollowing” of massive silver nanoparticles leads to an opposite effect as compared to decreasing the outer diameter of massive silver nanoparticles. A similar behaviour and red-shift of the plasmon resonance has been already discussed in the case of gold hollow spheres.27,43,44 The different behaviour of hollow and massive metal nanoparticles is also well in agreement with the theoretical background of the plasmon resonance that suggests a higher polarizability of the symmetric plasmon in the case of hollow spheres (Fig. 8).45 Furthermore, the obtained results may serve as an example to confirm the so-called plasmon hybridization model as suggested by Halas et al.46
Altogether, the morphological shift of the surface-plasmon resonance between as-prepared hollow spheres and massive silver nanoparticles is reliably validated. The observed red-shift clearly indicates that “hollowing” of massive particles leads to a quantum-size effect that differs from decreasing the outer diameter of massive particles. The latter finding also evidences the smaller massive particles observed in TEM analysis indeed to stem from sphere destruction under TEM conditions. If these massive particles were originating from the microemulsion synthesis they would have caused a blue-shifted surface-plasmon resonance, which is not observed experimentally. Based on the successful preparation of nanoscale hollow spheres and massive silver nanoparticles via microemulsion techniques, additional adaptability might arise in future from the fact that fine-tuning of outer diameter and cavity size of the hollow spheres is in principle possible via this approach, too. This has been recently demonstrated in the case of La(OH)3 hollow spheres as a first example.47
Conclusions
Based on a microemulsion approach silver hollow spheres and massive silver nanoparticles of similar size are prepared. Both materials exhibit outer diameters of 15–20 nm. Size and size distribution were validated based on different and independent analytical tools (i.e. DLS, STEM, TEM, XRD and FT-IR). According to HR-TEM, BF-STEM and HAADF-STEM studies the hollow spheres exhibit a wall thickness of 3–5 nm and an inner cavity of 10–15 nm. Such silver hollow spheres with diameters <50 nm have been firstly realized. The sphere structure turned out to be extremely sensitive to the electron beam and collapses on a timescale of a few seconds. This behaviour can be reliably ascribed to the phenomenon of “quasi-melting”.Based on similar size, size distribution and surface conditioning, as-prepared hollow spheres and massive nanoparticels are well suited to study for morphological quantum-size effects. Accordingly, UV-Vis spectra exhibit a red-shift of 33 nm of the surface-plasmon resonance in the case of the hollow spheres as compared to similar-sized massive particles. “Hollowing” of silver nanoparticles obviously influences the plasmon resonance in opposite to reducing the size of massive nanoparticles. The latter show a blue-shift upon decreasing the outer diameter. In sum, a morphological quantum-size effect of the surface-plasmon resonance can be reliably validated by comparision of microemulsion-made silver hollow spheres and massive nanoparticles.
Acknowledgements
The authors are grateful to the Center for Functional Nanostructures (CFN) of the Deutsche Forschungsgemeinschaft (DFG) at the Karlsruhe Institute of Technology (KIT) for financial support.References
- M. Liong, B. France, K. A. Bradley and J. I. Zink, Adv. Mater., 2009, 21, 1684 CrossRef CAS.
- B. Y. Ahn, e. B. Duoss, M. J. Motala, X. Guo, S. I. Park, Y. Xiong, J. Yoon, R. G. Nuzzo, J. A. Rogers and J. A. Lewis, Science, 2009, 323, 1590 CrossRef CAS.
- L. N. Lewis, Chem. Rev., 1993, 93, 2693 CrossRef CAS.
- P. P. Edwards and J. M. Thomas, Angew. Chem., 2007, 119, 5576 CrossRef; Angew. Chem., Int. Ed., 2007, 46, 5480 Search PubMed.
- G. Schmid, Metals, in Nanoscale Materials in Chemistry, ed. K. J. Klabunde, Wiley, Chichester, 2001, p. 15 Search PubMed.
- Q. Zhang, J. Ge, T. Pham, J. Goebl, Y. Hu, Z. Lu and Y. Yin, Angew. Chem., 2009, 121, 3568 CrossRef; (Angew. Chem., Int. Ed., 2009, 48, 3516) Search PubMed.
- P. K. Jain, X. Huang, I. H. El-Sayed and M. A. El-Sayed, Acc. Chem. Res., 2008, 41, 1578 CrossRef CAS.
- N. L. Rosi, D. A. Giljohann, C. S. Thaxton, A. K. R. Lytton-Jean, M. S. Han and C. A. Mirkin, Science, 2006, 312, 1027 CrossRef CAS.
- L. W. Yin, Y. Bando, M. S. Li and D. Golberg, Small, 2005, 1, 1094 CrossRef CAS.
- D. Zhang, L. Qi, J. Ma and H. Cheng, Adv. Mater., 2002, 14, 1499 CrossRef CAS.
- Z. Chen, P. Zhan, Z. Wang, J. Zhang, W. Zhang, N. Ming, C. T. Chan and P. Sheng, Adv. Mater., 2004, 16, 417 CrossRef CAS.
- J. H. Park, Y. G. Kim, C. Oh, S.-I. Shin, Y. C. Kim, S. G. Oh and S. H. Kong, Mater. Res. Bull., 2005, 40, 271 CrossRef CAS.
- J. Zhang, P. Zhan, H. Liu, Z. Wang and N. Ming, Mater. Lett., 2006, 60, 280 CrossRef CAS.
- L. Wang and D. Chen, Mater. Lett., 2007, 61, 2113 CrossRef CAS.
- J. Zhang, H. Liu, Z. Wang and N. Ming, Mater. Lett., 2007, 61, 4579 CrossRef CAS.
- Z. Wang, M. Chen and L. Wu, Chem. Mater., 2008, 20, 3251 CrossRef CAS.
- Z. Yang, L. Yang, Z. Zhang, N. Wu, J. Xie and W. Cao, Colloids Surf., A, 2008, 312, 113 CrossRef CAS.
- Y. Sun, Y. Liu, G. Zhao and Q. Zhang, Nanoscale Res. Lett., 2008, 3, 82 Search PubMed.
- H. Gröger, F. Gyger, P. Leidinger, C. Zurmühl and C. Feldmann, Adv. Mater., 2009, 21, 1586 CrossRef.
- F. A. Cotton and D. M. L. Goodgame, J. Chem. Soc., 1960, 9, 5267 Search PubMed.
- N. W. M. Ritchie, Surf. Interface Anal., 2005, 37, 1006 CrossRef CAS.
- D. D. Evanoff and G. Chumanov, J. Phys. Chem. B, 2004, 108, 13957 CrossRef CAS.
- P. Mulvaney, Langmuir, 1996, 12, 788 CrossRef CAS.
- M. P. Pileni, J. Phys. Chem., 1993, 97, 6961 CrossRef CAS.
- I. Capek, Adv. Colloid Interface Sci., 2004, 110, 49 CrossRef CAS.
- M. Gradzielski, Curr. Opin. Colloid Interface Sci., 2008, 13, 263 CrossRef CAS.
- D. H. M. Buchold and C. Feldmann, Adv. Funct. Mater., 2008, 18, 1002 CrossRef CAS.
- C. Zimmermann, C. Feldmann, M. Wanner and D. Gerthsen, Small, 2007, 3, 1347 CrossRef CAS.
- D. H. M. Buchold and C. Feldmann, Nano Lett., 2007, 7, 3489 CrossRef CAS.
- E. A. Owen and E. L. Yates, J. Chem. Phys., 1935, 3, 605 CrossRef CAS.
- S. H. Huh and A. Nakajima, Appl. Phys. Lett., 2004, 85, 6149 CrossRef CAS.
- P. M. Ajayan and L. D. Marks, Phys. Rev. Lett., 1989, 63, 279 CrossRef.
- D. J. Smith, A. K. Petford-Long, L. R. Wallenberg and J. O. Bovin, Science, 1986, 233, 872 CAS.
- L. D. Marks, P. M. Ajayan and J. Dundurs, Ultramicroscopy, 1986, 20, 77 CrossRef CAS.
- V. H. Crespi, N. G. Chopra, M. L. Cohen, A. Zettl and S. G. Louie, Phys. Rev. B: Condens. Matter Mater. Phys., 1996, 54, 5927 CrossRef CAS.
- T. Volkenandt, E. Müller, D. Hu, D. Schaadt and D. Gerthsen, Microsc. Microanal., 2010 DOI:10.1017/S1431927610000292.
- J. I. Langford, R. Delhez, T. H. de Keijser and E. J. Mittemeijer, Aust. J. Phys., 1998, 41, 173 Search PubMed.
- D. Vollath, Nanomaterials, Wiley-VCH, Weinheim, 2008, p. 171 Search PubMed.
- M. P. Pileni, Cryst. Res. Technol., 1998, 33, 1155 CrossRef CAS.
- H. P. Liang, L. J. Wan, C. L. Bai and L. Jiang, J. Phys. Chem. B, 2005, 109, 7795 CrossRef CAS.
- Y. Sun and Y. Xia, Anal. Chem., 2002, 74, 5297 CrossRef CAS.
- A. Slistan-Grijalva, R. Herrera-Urbina, J. F. Rivas-Silva, M. Ávalos-Borja, F. F. Castillón-Barraza and A. Posada-Amarillas, Physica E (Amsterdam), 2005, 27, 104 CrossRef CAS.
- Y. G. Sun and Y. N. Xia, Analyst, 2003, 128, 686 RSC.
- S. Link and M. A. El-Sayed, J. Phys. Chem. B, 1999, 103, 4212 CrossRef CAS.
- P. P. Edwards and J. M. Thomas, Angew. Chem., 2007, 119, 5576 CrossRef; (Angew. Chem., Int. Ed., 2007, 46, 5480) Search PubMed.
- S. Lai, N. K. Grady, J. Kundu, C. S. Levin, J. B. Lassiter and N. J. Halas, Chem. Soc. Rev., 2008, 37, 898 RSC.
- P. Leidinger, R. Popescu, D. Gerthsen and C. Feldmann, Small, 2010 DOI:10.1002/smll.201000575.
| This journal is © The Royal Society of Chemistry 2010 |
