Sr0.4H1.2Nb2O6·H2O nanopolyhedra: An efficient photocatalyst†
Shijing
Liang
,
Xiaowei
Wang
,
Yan
Chen
,
Jia
Zhu
,
Yongfan
Zhang
,
Xuxu
Wang
,
Zhaohui
Li
* and
Ling
Wu
*
State Key Laboratory Breeding Base of Photocatalysis, Research Institute of Photocatalysis, Fuzhou University, Fuzhou, 350002, P. R. China. E-mail: wuling@fzu.edu.cn; zhaohuili@fzu.edu.cn; Fax: +86-591-8377-9105; Tel: +86-591-8377-9362
First published on 6th September 2010
Abstract
A photocatalyst Sr0.4H1.2Nb2O6·H2O (HSN) nanopolyhedra with high surface area has been successfully prepared by a simple hydrothermal method. The as-prepared samples were characterized by XRD, BET, SEM, TEM and XPS. The electronic structure of HSN determined by DFT calculations and electrochemical measurement revealed that HSN is an indirect-bandgap and n-type semiconductor, respectively. HSN samples showed high photocatalytic activities for both pure water splitting and the decomposition of benzene. The rate of H2 evolution over HSN was 15 times higher than that of P25 and the conversion ratio of benzene exceeded twice that of P25. The photocatalytic activities for water splitting can be greatly improved by loading various co-catalysts on HSN, such as Au, Pt, and Pd. The photocatalytic mechanisms were proposed based on the band structure and characterization results of the photocatalyst.
1. Introduction
Photocatalytic water splitting is one of the ideal routes to produce hydrogen and has been intensively studied as one of the possible solutions to the energy and environmental issues.1 Because pure water splitting is a tough reaction,2 most of the photocatalytic water splitting reactions have been carried out with sacrificial reagents.3 However, the capability of producing H2 in these reactions does not mean that the photocatalyst is active for water splitting into H2 in the absence of the sacrificial reagents. The search for suitable semiconductor photocatalysts with high activity for pure water splitting into H2 represents a central challenge of this field so far. To date, a series of metal oxide photocatalysts, which can be generally classified into two categories, have been reported to be active for water splitting. One is the conventional TiO2-based materials modified by metal/nonmetal, metal oxide, or dye.4 However, the dopants usually act as recombination centers which lead to accelerated charge recombination and lower activity of the doped materials. The other is non-TiO2-based semiconductors, including metal oxides consisting of metal cations with d0 electron configurations, such as NbV, TaV, and WVI,5 and d10 electron configurations, such as InIII, GaIII, and SbV.1c,6 Among these photocatalysts, extensive studies have been focused on the niobate and tantalate photocatalysts due to their unique structure and excellent performance for water splitting.Nanostructured materials have received great interest primarily owing to their unique properties and morphologies. Their performances in a variety of applications can be significantly improved by controlling their surface area, size, shape, and composition.7 For example, nanostructured photocatalysts with large surface area, small particle size, and various morphologies exhibited much higher photocatalytic activity compared with their bulk counterparts, because of more active sites and lower recombination rate of photogenerated electron-hole pairs.8 Unfortunately, due to the limitation of the suitable precursors, the reported niobate photocatalysts have mainly been synthesized by a traditional high-temperature solid state reaction. Most recently, our group has developed a simple and versatile method for preparing various niobates, employing Nb2O5·nH2O as the precursor.8a Not only the stable phase niobates, but also the metastable phase niobates, like Sr0.4H1.2Nb2O6·H2O, can be prepared under mild reaction conditions using this strategy. It should be pointed out that the studies on the structure and the performances of the metastable phase photocatalyst can not only enrich our understanding of photocatalysis, but can also give us guidance in searching for a highly efficient photocatalyst. Our subsequent study has also demonstrated that Sr0.4H1.2Nb2O6·H2O nanopolyhedra showed photocatalytic activity on the decomposition of organic dyes like methyl orange (MO). However, to the best of our knowledge, the other properties of this newly developed photocatalyst Sr0.4H1.2Nb2O6·H2O, such as the electronic band structure and the photocatalytic activity for water splitting, etc., have not been investigated.
Herein, we present a hydrothermal method for the fabrication of Sr0.4H1.2Nb2O6·H2O nanopolydedra with high surface area. Its photocatalytic activities for both pure water splitting and the decomposition of benzene in the gas phase have been investigated. The effect of various co-catalysts on the photocatalytic water splitting over Sr0.4H1.2Nb2O6·H2O has also been studied. The mechanisms for both the water splitting and the degradation of benzene over HSN have been proposed in terms of its electronic band structure as determined by the DFT calculations.
2. Experimental
2.1 Preparation of samples
The Sr0.4H1.2Nb2O6·H2O (HSN) samples were prepared following a similar procedure we reported previously using Nb2O5·nH2O as the precursor.8a Briefly, a mixture of the as-obtained Nb2O5·nH2O and Sr(NO3)2 in a molar ratio of Nb5+![[thin space (1/6-em)]](https://www.rsc.org/images/entities/char_2009.gif) :
:![[thin space (1/6-em)]](https://www.rsc.org/images/entities/char_2009.gif) Sr2+ = 2
Sr2+ = 2![[thin space (1/6-em)]](https://www.rsc.org/images/entities/char_2009.gif) :
:![[thin space (1/6-em)]](https://www.rsc.org/images/entities/char_2009.gif) 1 was dispersed into 70 mL deionized water. After that, 1 mL NH3 (aq., 25%) was added into the suspensions under vigorous stirring. The resultant mixture was transferred to a Teflon-lined stainless steel autoclave. The Teflon-lined stainless steel autoclave was sealed and heated in an oven at different temperatures for 48 h under autogenous pressure. After cooling, the products were centrifuged, washed with deionized water and dried at 60 °C in an oven. Noble metal loaded products were prepared via impregnation followed by a reduction process. The sample HSN powders were impregnated with an appropriate volume of noble-metal salt solutions (0.01 gmetal mL−1 of H2PtCl6, HAuCl4, and Pd(NO3)2) and calcined at 350 °C for 3 h. The resulting powders were reduced with NaBH4 solution (0.1 mol L−1), centrifuged and washed thoroughly with distilled water, and dried at 120 °C for 5 h. RuO2 and NiO2 loaded samples were also prepared by a similar process using an aqueous solution of RuCl3 and Ni(NO3)3 without the reduction reaction.
1 was dispersed into 70 mL deionized water. After that, 1 mL NH3 (aq., 25%) was added into the suspensions under vigorous stirring. The resultant mixture was transferred to a Teflon-lined stainless steel autoclave. The Teflon-lined stainless steel autoclave was sealed and heated in an oven at different temperatures for 48 h under autogenous pressure. After cooling, the products were centrifuged, washed with deionized water and dried at 60 °C in an oven. Noble metal loaded products were prepared via impregnation followed by a reduction process. The sample HSN powders were impregnated with an appropriate volume of noble-metal salt solutions (0.01 gmetal mL−1 of H2PtCl6, HAuCl4, and Pd(NO3)2) and calcined at 350 °C for 3 h. The resulting powders were reduced with NaBH4 solution (0.1 mol L−1), centrifuged and washed thoroughly with distilled water, and dried at 120 °C for 5 h. RuO2 and NiO2 loaded samples were also prepared by a similar process using an aqueous solution of RuCl3 and Ni(NO3)3 without the reduction reaction.
2.2 Characterizations
The as-prepared samples were characterized by powder X-ray diffraction (XRD) on a Bruker D8 Advance X-ray diffractometer operated at 40 kV and 40 mA with Ni-filtered Cu Kα irradiation (λ = 1.5406 Å). Le Bail profile analysis in the Rietica program was used to refine XRD data calibrated against an internal standard (NaCl). The Brunauer–Emmett–Teller (BET) surface area was measured with an ASAP2020M apparatus (Micromeritics Instrument Corp.). X-Ray photoelectron spectroscopy (XPS) measurements were performed on a PHI Quantum 2000 XPS system with a monochromatic Al KR source and a charge neutralizer. UV–vis diffuse reflectance spectra (UV–vis DRS) were obtained by a UV–vis spectrophotometer (Varian Cary 500) and the data were converted to Kubelka-Munk (KM) functions. Barium sulfate was used as a reference. Scanning electron microscopy (SEM) images were obtained with a Nova NanoSEM 230 microscopy (FEI Corp.). Transmission electron microscopy (TEM) and high-resolution transmission electron microscopy (HRTEM) images were recorded using a JEOL model JEM 2010 EX microscope at an accelerating voltage of 200 kV. Electron spin resonance (ESR) signals of spin-trapped paramagnetic species with 5,5-dimethyl-1-pyrroline-N-oxide (DMPO) were recorded with a Brucker A300 spectrometer. A 200 W mercury Xe lamp (Hamamatsu Corp., L9566-02) with a set of cutoff filters and an emission at 254 nm was used as a light source.2.3 Theoretical calculations
The electronic structures of HSN were calculated using the linear combination of atomic orbital (LCAO) method with Becke's three-parameter hybrid functional (B3LYP). In the calculations, the standard 6-31G basis sets were adopted for oxygen atoms. For Sr and Nb atoms, Hay and Wadt's relativistic effective core potentials (RECPs) were used. 28 electrons were incorporated into pseudopotentials, and a (5s5p/3s3p) and a (4s4p4d/2s2p2d) basis set were employed for Sr and Nb atoms, respectively.9 The experimental lattice parameters and atomic coordinates were used, and a supercell with a size of ( ) was employed, in which the numbers of Sr, Nb and O atoms were 4, 20, and 60, respectively. In addition, the hydrogen atoms were not considered in the calculations because the positions of hydrogen atoms were unresolved experimentally, and accordingly a neutralizing background-charge was introduced into the system.
2.4 Evaluation of photocatalytic activity
The procedures for the photocatalytic splitting of water were performed in a closed gas-recirculation system and an inner irradiation quartz reaction cell with a 125 W high pressure Hg lamp, similar to that in the literature.10 The light intensity of the high-pressure Hg lamp at 365 and 254 nm is 3.5 and 2.0 mw cm−2, respectively. (The distance between the lamp and the sensor is 1 cm). Briefly, the reaction was carried out in pure water (50 mg catalyst, 170 mL H2O). The amount of H2 evolved was analyzed with an on-line gas chromatograph (GC112A, Shanghai Precision Scientific Instrument Co, Ltd, TCD, N2 carrier).The photocatalytic oxidation of benzene into carbon dioxide was measured with a fixed bed tubular quartz reactor operated in a single-pass mode. The catalyst (0.3 g, 50–70 mesh) was loaded in the reactor surrounded by four 4W UV-lamps with a wavelength centered at 254 nm (Philips, TUV 4W/G4 T5). Benzene diluted in a pure oxygen stream was used as the test reactant stream. The flow rate of the reactant stream was kept at 20 mL min−1. The concentrations of benzene and carbon dioxide were simultaneously determined by the flame ionization detector (FID) and thermal conductivity detector (TCD), respectively, with an online gas chromatograph (Agilent 6890N).
3. Results and discussion
Fig. 1 shows the XRD patterns of the samples prepared at different temperatures. The product prepared at 140 °C was amorphous. As the temperature increased, the crystalloid phases appeared and the crystallinity increased. When the temperature was no less than 160 °C, the patterns of the obtained samples matched well with the cubic phase of Sr0.4H1.2Nb2O6·H2O (JCPDS: 77-1165, space group Fd![[3 with combining macron]](https://www.rsc.org/images/entities/char_0033_0304.gif) m). No other crystalline by-products were found in the patterns, indicating that the products were pure Sr0.4H1.2Nb2O6·H2O. After refining the XRD data (Fig. S1†), the value of the cell edge for the investigated Sr0.4H1.2Nb2O6·H2O nanoparticle was estimated to be 10.5348(2) Å, which was quite similar to the calculated value (10.56 Å).11 The crystallographic structure of HSN is a three-dimensional network constructed by corner-shared octahedral NbO6 units (Fig. S2 in ESI†). The average crystallite sizes calculated by the Scherrer equation and the BET surface areas of all samples are shown in Table 1. The average crystallite sizes for samples prepared at different temperatures were around 50 nm. However, the BET surface area for products prepared at different temperatures are quite different and the one prepared at 160 °C shows the highest surface area of 51.4 m2 g−1. The adsorption–desorption isotherms of samples belongs to type IV isotherm (Fig. S3†) with a hysteresis loop, which implied the presence of the accumulated porous structure.
m). No other crystalline by-products were found in the patterns, indicating that the products were pure Sr0.4H1.2Nb2O6·H2O. After refining the XRD data (Fig. S1†), the value of the cell edge for the investigated Sr0.4H1.2Nb2O6·H2O nanoparticle was estimated to be 10.5348(2) Å, which was quite similar to the calculated value (10.56 Å).11 The crystallographic structure of HSN is a three-dimensional network constructed by corner-shared octahedral NbO6 units (Fig. S2 in ESI†). The average crystallite sizes calculated by the Scherrer equation and the BET surface areas of all samples are shown in Table 1. The average crystallite sizes for samples prepared at different temperatures were around 50 nm. However, the BET surface area for products prepared at different temperatures are quite different and the one prepared at 160 °C shows the highest surface area of 51.4 m2 g−1. The adsorption–desorption isotherms of samples belongs to type IV isotherm (Fig. S3†) with a hysteresis loop, which implied the presence of the accumulated porous structure.
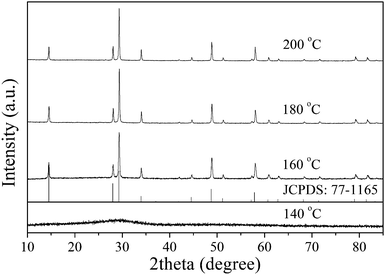 | ||
| Fig. 1 XRD patterns of the samples prepared at different temperatures for 48 h. | ||
| T/°C | Crystallite size/nm | BET surface area/m2 g−1 | Pore structure |
|---|---|---|---|
| 160 | 41.2 | 51.4 | Accumulated porous structure |
| 180 | 49.8 | 22.9 | |
| 200 | 56.8 | 18.4 |
XPS measurements were carried out to further investigate the surface compositions and chemical states of the as-prepared HSN and the results are showed in Fig. 2. No obvious peaks for impurities have been observed for any of the samples. As shown in Fig. 2b–c, the core lines were fixed at 134.9 eV (Sr 3d5/2) and 208.4 eV (Nb 3d5/2). For the Sr 3d and Nb 3d, the spin orbit separations (Δ) were 1.8 and 2.8 eV, respectively, and the ratios of two peak areas were 3![[thin space (1/6-em)]](https://www.rsc.org/images/entities/char_2009.gif) :
:![[thin space (1/6-em)]](https://www.rsc.org/images/entities/char_2009.gif) 2. These results demonstrated that the chemical states of the sample were Sr2+ and Nb5+. Fig. 2d showed the peak corresponding to O may be fitted to two kinds of chemical environments: crystal lattice oxygen and adsorbed oxygen. The peak at 531.6 eV is assigned to the crystal lattice oxygen, while the peak at 533.2 eV is related to the adsorbed oxygen. The ratio of two peak areas was about 5
2. These results demonstrated that the chemical states of the sample were Sr2+ and Nb5+. Fig. 2d showed the peak corresponding to O may be fitted to two kinds of chemical environments: crystal lattice oxygen and adsorbed oxygen. The peak at 531.6 eV is assigned to the crystal lattice oxygen, while the peak at 533.2 eV is related to the adsorbed oxygen. The ratio of two peak areas was about 5![[thin space (1/6-em)]](https://www.rsc.org/images/entities/char_2009.gif) :
:![[thin space (1/6-em)]](https://www.rsc.org/images/entities/char_2009.gif) 2. The results indicated that the catalyst has an abundance of surface-adsorbed oxygen (surface OH groups). As we know, the surface OH groups play an important role in the photocatalytic oxidation process since they can react with photogenerated holes to form hydroxyl radicals when excited by UV light.12 No signal for F 1s was observed in Fig. 2e, indicating that the F− anion can be thoroughly removed during the preparation process.
2. The results indicated that the catalyst has an abundance of surface-adsorbed oxygen (surface OH groups). As we know, the surface OH groups play an important role in the photocatalytic oxidation process since they can react with photogenerated holes to form hydroxyl radicals when excited by UV light.12 No signal for F 1s was observed in Fig. 2e, indicating that the F− anion can be thoroughly removed during the preparation process.
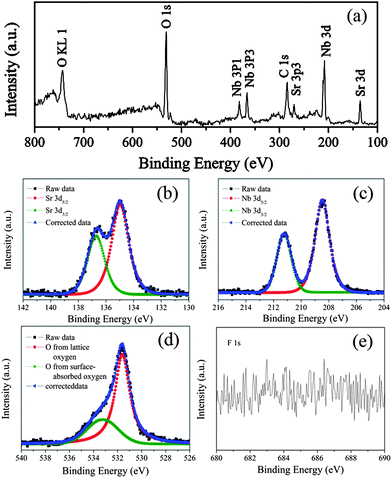 | ||
| Fig. 2 XPS spectra of sample HSN: (a) survey XPS spectrum and (b–e) high-resolution spectra of Sr 3d, Nb 3d, O 1s, and F 1s. | ||
Fig. 3 shows the UV–vis DRS for HSN samples prepared at different temperatures. It could be seen that the samples had a steep absorption edge in the UV region, indicating that they were due to a band gap transition from valence band to conduction band.13 The wavelength at the absorption edge, λ, is determined as the intercept on the wavelength axis for a tangent line drawn on the absorption spectra. The absorption edges of the samples prepared at different temperatures were all located at about 300 nm, corresponding to a band gap of ∼4.1 eV. The wide gap of HSN might be a drawback; however, it is not a serious problem for treatment devices using bactericidal lamps (emission wavelength 254 nm). In addition, our initial experiments have shown that HSN can be easily modified by doping nitrogen into the crystal lattice under an NH3 gas flow at high temperature, making the materials responsive to the visible spectrum.
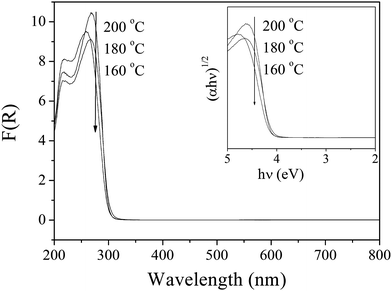 | ||
| Fig. 3 UV–vis DRS of Sr0.4H1.2Nb2O6·H2O synthesized at different temperatures. | ||
To analyse the electronic structure, we have carried out density functional theory (DFT) calculations for the cubic phase Sr0.4H1.2Nb2O6·H2O. The band structure and density of states (DOS) are displayed in Fig. 4. It can be seen clearly that the HSN sample is a wide band gap semiconductor. An indirect transition from the valence band at L point to the conduction band at Γ point as the minimum band gap, for which a value of 3.5 eV is determined. Due to the inherent deficiency of the DFT method,14 the calculated band gap is smaller than the experimental value although a portion of Hartree–Fock exchange (20%) is introduced in the hybrid B3LYP framework. According to the DOS shown in Fig. 4b, the top of the valence band of HSN is mainly derived from the O 2p orbitals, while obvious components of the Nb atom can also be found for the bands in the energy region between −6 and −1 eV, indicating the covalent interaction between Nb and O atoms. On the other hand, the bottom of the conduction band is dominated by the Nb 4d orbitals. The relatively delocalized Nb 4d states might give a high mobility to the photoinduced electrons.15
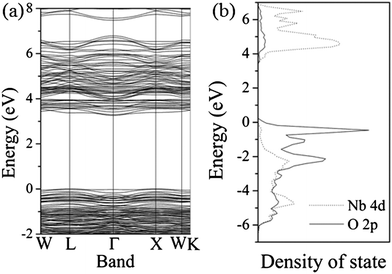 | ||
| Fig. 4 Band structure (a) and density of state (b) of the HSN sample (the top of the valence band was set to zero in the figures). | ||
In order to better understand the intrinsic electronic properties of HSN, a Mott–Schottky measurement was also performed in darkness using impedance techniques. Reversed sigmoidal plots were observed with an overall shape that is consistent with that of typical n-type semiconductors. The flatband potential of HSN estimated by typical Mott–Schottky plots at various frequencies (Fig. 5a) was −0.28 eV vs. SHE and close to that of TiO2 (−0.29 eV),16 whereas the edge energy of the valence band (EVB) of the HSN sample was estimated to be 3.82 eV, much lower than that of TiO2 (2.91 eV) (Fig. 5b). This indicates that the HSN thermodynamically enables photocatalytic water splitting into H2 (0 eV) and O2 (1.23 eV). Moreover, the higher energy levels of valence band edges allow the photogenerated holes to be kinetically more favorable to produce active OH˙ radicals. In addition, the HSN might show higher photocatalytic activities for environmental photocatalysis as compared with TiO2.
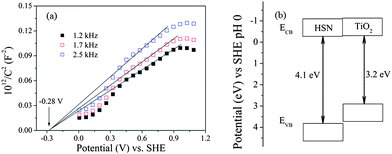 | ||
| Fig. 5 Typical Mott–Schottky plots (a) and band structure (b) of the HSN sample prepared at 160 °C. | ||
The morphology of HSN synthesized at 160 °C was characterized by SEM and TEM. SEM examination (Fig. 6a) showed that the sample consisted of nanopolyhedra ranging from 30 to 70 nm and was well-dispersed. The morphology was also confirmed by the TEM image (Fig. 6b). As shown in Fig. 6c, clear lattice fringes can be observed. The interplanar spacing was consistent with the d-spacing of the corresponding lattice plane. The fringes of d = 0.61 nm matched that of the (111) crystallographic plane of cubic Sr0.4H1.2Nb2O6·H2O. A typical selected area electron diffraction (SAED) pattern (Fig. 6d) revealed that the sample had single-crystalline character.
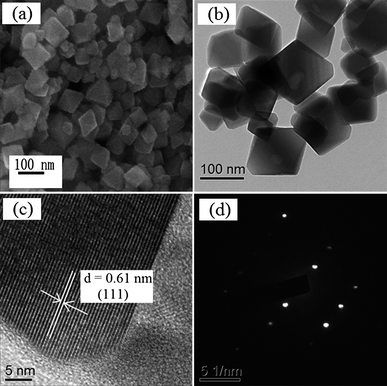 | ||
| Fig. 6 SEM (a), TEM (b), HRTEM images (c), and typical SAED pattern (d) of the HSN sample prepared at 160 °C. | ||
The above-mentioned discussions indicate that the HSN sample might be used as a good candidate for photocatalytic reduced reactions. Therefore, the photocatalytic activities of the samples without co-catalyst were evaluated by the pure water splitting into H2 under high-pressure Hg lamp irradiations, the results have been compared with that obtained over TiO2 (Degussa P25) (Fig. 7). At the beginning, the exhibited activity is low, probably due to a catalyst activation process. After the induction period, HSN showed higher activity and no noticeable loss of activity was observed during the whole reaction process. The crystal structure and the chemical surface state of HSN nanopolyhedra after photocatalytic splitting of water were also checked by XRD and XPS, which showed no observable change after the reaction (Fig. S4†).
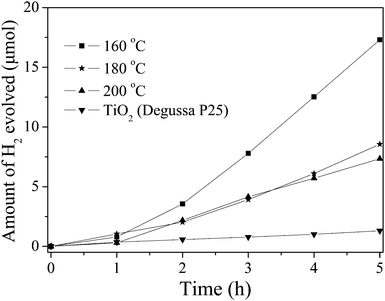 | ||
| Fig. 7 Photocatalytic activities of the HSN sample and TiO2 without any co-catalyst (50 mg catalyst, 125 W high-pressure Hg lamp, 170 mL H2O). | ||
The photocatalytic efficiency of HSN samples showed strong dependency on the synthetic temperature and the surface area. A reduction in the efficiency was observed with the increase of the hydrothermal preparation temperature and the decrease of the surface area. The highest activity was obtained on the sample prepared at 160 °C, which shows a H2 evolution rate of 91.9 μmol h−1 gcatalyst−1. This value was 15 times higher than that of TiO2 (5.9 μmol h−1 gcatalyst−1). Since HSN and TiO2 have similar positions for the conduction band bottom, and the number of absorbed photons for HSN should be smaller than that of TiO2 under the same experimental conditions, the higher photocatalytic activity for water splitting observed over HSN should be due to its electronic structure, i.e. the composition of the conduction band.
In addition, to further obtain higher activity, a series of co-catalysts have been introduced into HSN as electron acceptors. The effect of different co-catalysts on the rate of hydrogen production from pure water is shown in Fig. 8. Compared with pure HSN, HSN loaded with 1.0 wt.% of various noble metals, such as Au, Pt, and Pd, exhibited a great improvement of the H2 evolution rate. This enhancement may be well explained by the work functions of different noble metals. Since the work functions of Au (5.1 eV), Pt (5.65), and Pd (5.55)10 are much higher than that of HSN, a Schottky barrier can be formed at the metal-HSN interface. Benefiting from the Schottky barrier, the photogenerated electrons can transfer from HSN to the noble metal, and the recombination of photogenerated charge carriers can be suppressed. The H2 evolution rate follows the order: Au/HSN (434.1 μmol h−1 gcatalyst−1) > Pt/HSN (385.6) > Pd/HSN (249.3) > HSN (91.9). Moreover, the amount of Au loaded was also an important factor for improving the activity (Fig. 8b). When the amount of Au increased from 0.2 to 1.0 wt.%, the rate was enhanced from 142.1 to 434.1 μmol h−1 gcatalyst−1. However, when the amount of loaded Au exceeded 1.0 wt.%, the rate was reduced. The decreased activity may be caused by the reduction in the light adsorption by excessive Au loading.
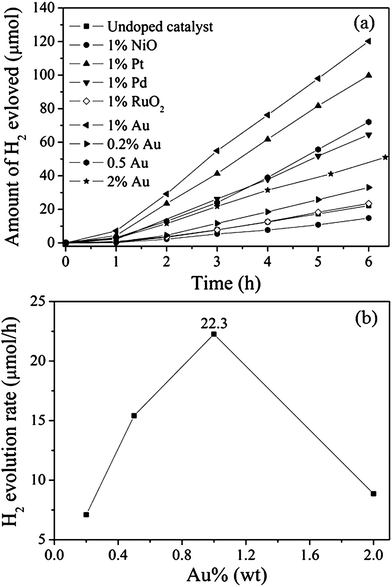 | ||
| Fig. 8 Photocatalytic activities of sample HSN prepared at 160 °C with various co-catalysts: (a) different co-catalysts; (b) different amounts of Au (50 mg catalyst, 125 W high-pressure Hg lamp, 170 mL H2O). | ||
The turnover number, usually introduced to determine if the reaction was one photocatalytic reaction, is defined by the number of reacted molecules to that of an active site.1c However, it is difficult to determine the number of active sites for heterogeneous photocatalysts. Here, the total amount of the catalyst was adopted as the number of active sites to ensure the reliability of the evaluation.8b,17 For H2 evolution with 1% Au as co-catalyst, the turnover number was estimated to be 3 after 10 h of reaction time. The result proved that the reaction was photocatalysis instead of a photocorrosion.
Interestingly, common co-catalysts like NiO and RuO2 that is usually used to enhance H2 evolution were not effective for HSN photocatalyst. Instead they showed a negative effect. This phenomenon can be well explained by their relative band positions (Fig. 9). The conduction band level of HSN was roughly estimated to be −0.28 eV while that of NiO is −0.96 eV.18 Therefore, the photogenerated electrons in the conduction band of HSN were not able to transfer to the conduction band of NiO co-catalyst which may cover the active site of hydrogen evolution and decrease the activity.
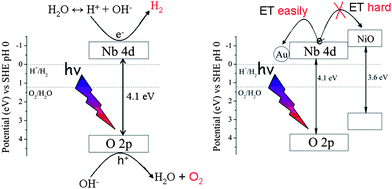 | ||
| Fig. 9 Mechanism of water splitting over the HSN samples. | ||
Our previous work8a demonstrated that HSN can decompose methyl orange effectively in aqueous solution since the valence band (VB) of HSN (3.8 eV vs. SHE, pH 0) is more positive than the ˙OH/H2O potential (2.8 eV). This implies that HSN can also be used to decompose other organic contaminants not only in the aqueous but also in the gas phase. To further confirm the photocatalytic activity of HSN nanopolyhedron, the photocatalytic degradation of benzene in the gas phase under UV light irradiation was chosen and the result is shown in Fig. 10. Under UV illuminations, about 17.8% benzene was converted and 65 ppm CO2 was produced over HSN. Considering the negligible conversion of excited-state benzene on dielectric oxides,19 these results suggested that the degradation of benzene proceeded photocatalytically on HSN. Although both samples were capable of oxidizing benzene with molecular oxygen, HSN showed much higher efficiency compared with TiO2. The CO2 production rate and benzene reaction rate of sample HSN was 2 times higher than that of TiO2. Since these two samples have similar BET surface areas, their different activities may be explained by the different oxidizing capability of the hole (h+) (Fig. 5b). It is well known that ˙OH, ˙O2− and h+ were commonly suggested as the primary oxidizing species in the gas-phase photocatalytic oxidation processes. The generation of ˙OH and ˙O2− radicals have been examined by ESR. Four characteristic peaks of DMPO–˙OH were obviously observed under the UV light irradiation as shown in Fig. 11a. However, the characteristic peaks of DMPO–˙O2− were very weak (Fig. 11b) and suggested that the photocatalytic degradation of benzene may proceed mainly via ˙OH or/and h+ instead of ˙O2− oxidation.
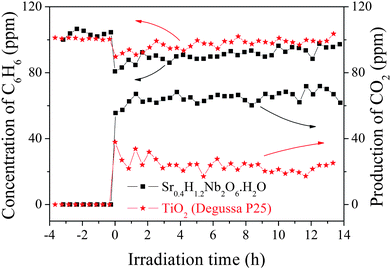 | ||
| Fig. 10 Photocatalytic decomposition of benzene on sample HSN prepared at 160 °C (0.3 g catalyst, 20 mL min−1 O2 flow, initial benzene concentration). | ||
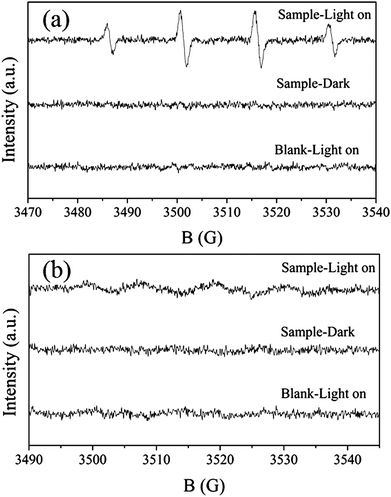 | ||
| Fig. 11 ESR spectra observed for sample HSN prepared at 160 °C. The active species are (a) ˙OH irradiated for 80 s and (b) ˙O2− irradiated for 360 s. | ||
4. Conclusion
In this work, nanopolyhedra of an indirect-bandgap semiconductor Sr0.4H1.2Nb2O6·H2O with high surface area were prepared by the hydrothermal reaction. The photocatalyst showed superior photocatalytic activity for water splitting to generate H2 and for degrading benzene under UV light irradiation as compared with TiO2 (Degussa P25). The photocatalytic activity for water splitting over HSN can be further improved by loading noble metals with a larger work function. The Au-loaded sample showed the highest activity for water splitting and the optimum amount of Au is 1.0 wt.%. The experimental results and the proposed mechanisms for water splitting and the degradation of benzene were in good agreement with the energy band structure.Acknowledgements
The work was supported by the NSFC (20777011, 90922022), the 973 Program (2007CB613306) and Program for Changjiang Scholars and Innovative Research Team in University (PCSIRT0818). The NSF of Fujian province for Distinguished Young Investigator Grant (2009J06004) for Z. Li is also acknowledged.Notes and references
- (a) M. Kitano and M. Hara, J. Mater. Chem., 2010, 20, 627 RSC; (b) R. M. Navarro, M. C. Sanchez-Sanchez, M. C. Alvarez-Galvan, F. del Valle and J. L. G. Fierro, Energy Environ. Sci., 2009, 2, 35 RSC; (c) A. Kudo and Y. Miseki, Chem. Soc. Rev., 2009, 38, 253 RSC.
- (a) K. Maeda and K. Domen, Chem. Mater., 2010, 22, 612 CrossRef CAS; (b) A. Iwase, H. Kato and A. Kudo, ChemSusChem, 2009, 2, 873 CrossRef CAS.
- (a) J. Zhang, X. Chen, K. Takanabe, K. Maeda, K. Domen, J. D. Epping, X. Fu, M. Antonietti and X. Wang, Angew. Chem., Int. Ed., 2010, 49, 441 CAS; (b) X. Wang, K. Maeda, A. Thomas, K. Takanabe, G. Xin, J. M. Carlsson, K. Domen and M. Antonietti, Nat. Mater., 2009, 8, 76 CrossRef CAS; (c) X. Wang, K. Maeda, X. Chen, K. Takanabe, K. Domen, Y. Hou, X. Fu and M. Antonietti, J. Am. Chem. Soc., 2009, 131, 1680 CrossRef CAS; (d) W. Yao, C. Huang and J. Ye, Chem. Mater., 2010, 22, 1107 CrossRef CAS; (e) H. Kaga, K. Saito and A. Kudo, Chem. Commun., 2010, 46, 3779 RSC.
- (a) O. Rosseler, M. V. Shankar, M. K.-L. Du, L. Schmidlin, N. Keller and V. Keller, J. Catal., 2010, 269, 179 CrossRef CAS; (b) H. Zhou, X. Li, T. Fan, F. E. Osterloh, J. Ding, E. M. Sabio, D. Zhang and Q. Guo, Adv. Mater., 2010, 22, 951 CAS; (c) D. Chatterjee, Catal. Commun., 2010, 11, 336 CrossRef CAS; (d) D. Y. C. Leung, X. Fu, C. Wang, M. Ni, M. K. H. Leung, X. Wang and X. Fu, ChemSusChem, 2010, 3, 681 CrossRef CAS.
- (a) Y. Miseki, H. Kato and A. Kudo, Energy Environ. Sci., 2009, 2, 306 RSC; (b) H. Kato, K. Asakura and A. Kudo, J. Am. Chem. Soc., 2003, 125, 3082 CrossRef CAS; (c) N. Sakamoto, H. Ohtsuka, T. Ikeda, K. Maeda, D. Lu, M. Kanehara, K. Teramura, T. Teranishi and K. Domen, Nanoscale, 2009, 1, 106 RSC; (d) H. Kadowaki, N. Saito, H. Nishiyama, H. Kobayashi, Y. Shimodaira and Y. Inoue, J. Phys. Chem. C, 2007, 111, 439 CrossRef CAS.
- Y. Inoue, Energy Environ. Sci., 2009, 2, 364 RSC.
- (a) T. Zhai, X. Fang, L. Li, Y. Bando and D. Golberg, Nanoscale, 2010, 2, 168 RSC; (b) K. Ariga, X. Hu, S. Mandal and J. P. Hill, Nanoscale, 2010, 2, 198 RSC; (c) A. I. Hochbaum and P. Yang, Chem. Rev., 2010, 110, 527 CrossRef CAS.
- (a) S. Liang, L. Wu, J. Bi, W. Wang, J. Gao, Z. Li and X. Fu, Chem. Commun., 2010, 46, 1446 RSC; (b) S. Song, Y. Zhang, Y. Xing, C. Wang, J. Feng, W. Shi, G. Zheng and H. Zhang, Adv. Funct. Mater., 2008, 18, 2328 CrossRef CAS.
- (a) S. Dall'Olio, R. Dovesi and R. Resta, Phys. Rev. B: Condens. Matter, 1997, 56, 10105 CrossRef CAS; (b) S. Piskunov, E. Heifets, R. I. Eglitis and G. Borstel, Comput. Mater. Sci., 2004, 29, 165 CrossRef CAS.
- X. Fu, J. Long, X. Wang, D. Y. C. Leung, Z. Ding, L. Wu, Z. Zhang, Z. Li and X. Fu, Int. J. Hydrogen Energy, 2008, 33, 6484 CrossRef CAS.
- D. Groult, C. Michel and B. Raveau, J. Inorg. Nucl. Chem., 1975, 37, 2203 CrossRef CAS.
- (a) T. Yan, J. Long, X. Shi, D. Wang, Z. Li and X. Wang, Environ. Sci. Technol., 2010, 44, 1380 CrossRef CAS; (b) X. Fu, X. Wang, Z. Ding, D. Y. C. Leung, Z. Zhang, J. Long, W. Zhang, Z. Li and X. Fu, Appl. Catal., B, 2009, 91, 67 CrossRef CAS; (c) Z. Li, Z. Xie, Y. Zhang, L. Wu, X. Wang and X. Fu, J. Phys. Chem. C, 2007, 111, 18348 CrossRef CAS.
- Y. Hosogi, Y. Shimodaira, H. Kato, H. Kobayashi and A. Kudo, Chem. Mater., 2008, 20, 1299 CrossRef CAS.
- Z. Li, H. Dong, Y. Zhang, T. Dong, X. Wang, J. Li and X. Fu, J. Phys. Chem. C, 2008, 112, 16046 CrossRef CAS.
- J. Wu, J. Li, X. Lu, L. Zhang, J. Yao, F. Zhang, F. Huang and F. Xu, J. Mater. Chem., 2010, 20, 1942 RSC.
- Y. Xu and M. A. A. Schoonen, Am. Mineral., 2000, 85, 543 CAS.
- J. Tang, Z. Zou and J. Ye, J. Phys. Chem. B, 2003, 107, 14265 CrossRef CAS.
- H. Kato and A. Kudo, J. Phys. Chem. B, 2001, 105, 4285 CrossRef CAS.
- Y. Hou, L. Wu, X. Wang, Z. Ding, Z. Li and X. Fu, J. Catal., 2007, 250, 12 CrossRef CAS.
Footnote |
| † Electronic supplementary information (ESI) available: Schematic structure of HSN; Nitrogen adsorption-desorption isotherm of HSN samples; Comparison of XRD and XPS spectra of HSN sample before and after reaction of water splitting. See DOI: 10.1039/c0nr00327a |
| This journal is © The Royal Society of Chemistry 2010 |
