Visible-light-driven reversible and switchable hydrophobic to hydrophilic nitrogen-doped titania surfaces: correlation with photocatalysis
Junwei
Wang
a,
Baodong
Mao
a,
James L.
Gole
*b and
Clemens
Burda
*a
aDepartment of Chemistry, Case Western Reserve University, Cleveland, OH 44106, USA. E-mail: burda@case.edu
bSchools of Physics and Mechanical Engineering, Georgia Institute of Technology, 837 State Street, NW, Atlanta, GA 30332-0430, USA. E-mail: jim.gole@physics.gatech.edu
First published on 27th August 2010
Abstract
Visible-light-responsive nitrogen-doped titanium dioxide nanorods have been synthesized by a hydrothermal method at low temperature. X-Ray diffraction, scanning electron microscopy, UV-vis spectroscopy, and contact angle measurements were used to obtain the crystal structures, morphologies, visible-light absorbance, and hydrophobicity, respectively, of the prepared nanorods. The surface wettability of the samples could be reversibly tuned from hydrophobic to hydrophilic upon visible-light illumination. This switchable surface wettability is crucial since the photocatalytic activity of this nanoscaled catalyst for the decomposition of organic molecules exhibits a strong dependence on the surface wettability.
Introduction
Surface wettability is an important property of solid state materials relevant in practical applications including self-cleaning,1 anti-fogging,2 anti-biofouling,3 drug delivery,4 and the separation of water and oil.5 The interest in surface wetting as monitored by evaluating contact angles has recently greatly expanded.2,3,6–10 The evaluation of the contact angle at which a liquid–vapor interface comes in contact with a solid–liquid interface provides an inverse measure of the surface wettability. Surfaces with contact angles larger than 90° are categorized as hydrophobic whereas surfaces with contact angles smaller than 90° are categorized as hydrophilic. These surfaces are of special interest to the wetting community because they are responsible for many industrial and biological applications. Furthermore, “smart” surfaces that are able to switch between superhydrophobic and superhydrophilic have attracted even more attention because of their potential use to enhance rapid water motion,11 improve micro-fluidic devices,12 and create smart membranes13 and sensors.14Titanium dioxide, with its stable, nontoxic, inexpensive, and highly reactive characteristics, is one of the most popular semiconductor metal oxides currently under extensive investigation.15–20 Its intrinsic disadvantage, a large band gap, has been addressed using a number of approaches, among which nitrogen doping was found to be one of the most promising.21–30 There have been a few reports detailing the synthesis of superhydrophobic TiO2,19,31–34 and a few studies of smart surfaces.32,35 However, to the best of our knowledge, no reports regarding the fabrication of visible-light-driven switchable hydrophobic to hydrophilic surfaces have been published. We report a hydrothermal synthesis of visible-light responsive anatase phase N-doped TiO2 whose surface wettability is switchable between hydrophobic and hydrophilic at relatively low temperature (180 °C, compared to 350 °C, for the normal crystallization temperature of anatase TiO2 formed by the sol–gel method).
Experimental procedures
Synthesis
Nitrogen doped TiO2 nanoparticles were synthesized using a hydrothermal method adapted from a previous report.36 For a typical synthesis, 30.0 mL of 5.33 mM titanium tetrafluoride, 0.40 mL of 10% hydrofluoric acid and 1.50 mL of ethylenediamine (99%, Aldrich) were added to a Teflon-lined autoclave, which was then placed in an oven at 180 °C for 6, 12, 18 and 24 hours. The product was rinsed with deionized water and centrifuged at 6000 revolutions per minute for 15 minutes, twice. It was then dispersed in ∼30 mL of DI H2O and ultrasonicated for 30 min, after which the suspension was added to a wafer, drop by drop, in an 80 °C oven to form a film.Characterization
Structures of the prepared samples were examined by a Scintag X-1 Advanced X-ray powder diffractometer (XRD, 2° per min, Cu Kα radiation). The morphologies of these samples were characterized by a Hitachi S4500 field-emission gun scanning electron microscope (SEM). Optical properties were determined by a Varian Cary Bio50 UV-vis spectrometer with a Barrelino remote diffuse reflection probe (reference material: MgO). The water contact angles were measured by analyzing high definition photographs of the water droplets on sample surfaces. Visible-light illumination was provided using a 150 W xenon arc light with the use of two 400 nm cut-off filters. To induce hydrophilicity, the samples were placed in the filtered light path for 6 hours. Samples with various surface contact angles ranging from hydrophilic to hydrophobic were obtained during the 6 hour illumination. The hydrophobicity was recovered by either keeping the samples in the dark for 2 weeks or sintering the samples in a 120 °C oven overnight.Photocatalysis
The photocatalytic activity of the N-doped TiO2 nanoparticles was evaluated by measuring the decomposition of methylene blue (MB) under visible-light irradiation. The light source used was a 150 W high-pressure xenon arc lamp with the use of two 400 nm cut-off filters. The change in relative concentration of methylene blue (MB) was determined by measuring the absorbance of the MB solution with a Varian Cary Bio50 UV-vis spectrometer. For reference, the change in the relative concentration of a comparable MB solution with no catalyst under dark and light conditions was also tested.Results and discussion
Fig. 1 shows the XRD patterns of the N-doped TiO2 samples for various growing times. The prepared samples are found to be primarily of the anatase phase (body centered tetragonal structure, space group I41/amd), while a small fraction of the brookite phase (primitive orthorhombic structure, space group Pbca) is also present. There is no significant change in the intensities of the peaks among the variously treated samples, indicating that the sizes and crystallinities of the samples are similar. The peaks are relatively broad compared to those of the bulk material, indicating the smaller crystal sizes of the prepared nanomaterials. Compared to the standard XRD pattern of anatase TiO2 (JCPDS file no. 21-1272), the peaks at 2θ = 25.2° (corresponding to the (101) reflection) are clearly weakened whereas the peaks at 2θ = 53.8° and 55.0° (corresponding to the (105) and (211) reflection, respectively) are comparatively stronger (see Table 1 for the relative intensities of the peaks). The difference in the intensities of the peaks compared to those of a standard sample indicates the existence of a preferred orientation for the growth of these samples, which should be the longitudinal axis of the nanorods depicted in Fig. 2.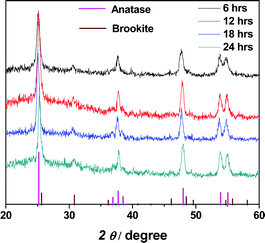 | ||
| Fig. 1 XRD patterns of N-doped TiO2 prepared by a hydrothermal method. Shown in the figure are samples with growing times ranging from 6 to 24 hours. In the bottom of the figure are the standard XRD peaks for anatase TiO2 (pink, JCPDS file no. 21-1272) and brookite TiO2 (wine, JCPDS file no. 03-0380). | ||
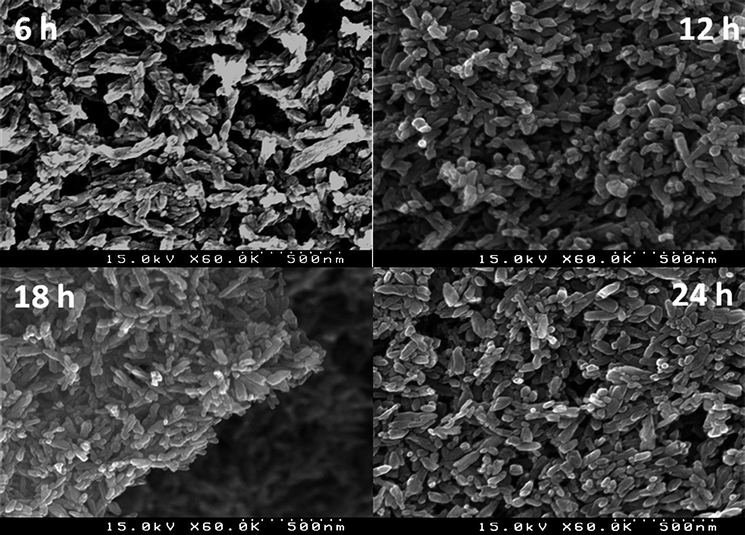 | ||
| Fig. 2 SEM images of prepared N-doped TiO2 samples after the indicated growth time of 6, 12, 18 and 24 hours. | ||
Fig. 2 depicts the SEM images of the N-doped TiO2 samples. There is no significant difference between the morphologies of the nanorods produced over different time scales, which concurs with the similar XRD patterns of Fig. 1. However, upon careful examination of these images, we can see that the 18 hour sample has the narrowest size distribution of the four samples. The average length of the nanorods is approximately 130 nm while their diameter is approximately 35 nm.
According to Lifshitz and Slyozov,37 diffusion controlled growth for a supersaturated solution can be divided into three distinct stages, nucleation, normal growth and competitive growth. The last stage, Ostwald ripening, may correspond to the dissolution of the nanocrystallites that are smaller than a certain critical size and then transfer their mass to nanocrystallites that are larger than a critical size.
Fig. 3 depicts the UV-vis diffuse reflection spectra of the N-doped TiO2 prepared by the hydrothermal method for various time scales. The absorption in the visible region increases from growing times of 6 hours to 12 hours, and continues to increase to 18 hours where it reaches a plateau. Based on these spectra, it can be concluded that the hydrothermal reaction takes about 18 hours to reach its equilibrium. This is consistent with the SEM results (Fig. 2). Two mechanisms have been suggested for the origin of the visible light absorption. In the first, band gap narrowing is thought to result from N 2p–O 2p orbital mixing decreasing the energy increment to the conduction band of TiO2.21,26,38 The visible light absorption has also been suggested to result from oxygen defects formed in the reduction of TiO2.39 It has been argued that TiO2 has been reduced during the N-doping process, as F-type color centers are formed. The F-type color centers together with Ti3+ centers are suggested to play the dominant role in the visible-light-activity of TiO2 photocatalysts. More recently, researchers started to realize that both of the two mechanisms play a role.40,41
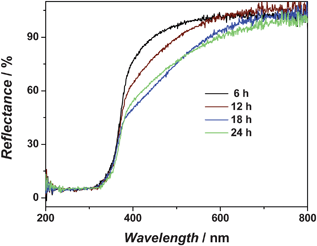 | ||
| Fig. 3 UV-vis diffuse reflection spectra of N-doped TiO2 prepared by hydrothermal method. Shown in the figure are the curves for 4 different growing times, namely, 6, 12, 18 and 24 hours. | ||
The wettability of the N-doped TiO2 films was evaluated by contact angle measurement. All of the samples exhibit surface hydrophobicities. Shown in Fig. 4 is a series of photographs of water droplets sitting on an N-doped TiO2 film. According to the Cassie and Baxter relationships,32,42 the apparent contact angle θf can be given using the following equation:
| cos θf = fs cos θw − fv | (1) |
 | ||
| Fig. 4 Photographs of the water droplets on an N-doped TiO2 film with various surface wettabilities. | ||
With the large apparent contact angle as high as 141°, fv can be calculated (assuming θw is the same as that of anatase TiO2) to be as high as 83%. Air trapped in the films would appear to play the role of a cushion at the film–water interface and prevent the water droplet from penetrating into the porous regions of the film.
The hydrophobic nature of the N-doped TiO2 films transforms into a hydrophilic character when these samples are illuminated with visible-light. Shown in Table 2 are the contact angles for the samples before and after light illumination. The change from hydrophobic to hydrophilic character might be ascribed to a kinetically favored absorption of water molecules onto surface oxygen vacancies formed by the reaction of photogenerated holes and lattice oxygen.10,32 Adsorbed water can fill the porous regions along the nanorods, replacing trapped air. This can result in a hydrophilic surface. This change in the wettability can be reversed when the samples are kept in the dark for two weeks. This behavior suggests that surface oxygen vacancies decay as the oxygen regeneration process is thermodynamically more favored.32
The process of regenerating hydrophobicity can be shortened to 12 hours if the samples are kept in an oven at 120 °C. To test the role of adsorbed water in the wettability changing process, we illuminated the hydrophobic surface in a vacuum system (10−3 Torr), and did not find any change in the surface hydrophobicity under the same light illumination as in the air-exposed case. Neither did we find any change when the hydrophobic surface was kept in an argon environment when being illuminated. This again indicates that water is indispensable in the wettability transition process.
Fig. 5 shows the water contact angle measurement for the 24 hour N–TiO2 sample in 3 cycles of hydrophobic–hydrophilic transformation (in an air-exposed system).
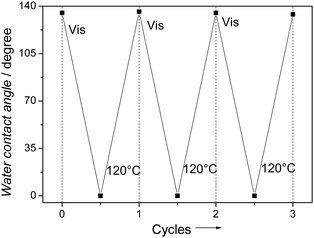 | ||
| Fig. 5 Contact angle measurements of the 24 hour N–TiO2 sample in 3 hydrophobic–hydrophilic cycles (in air-exposed system). Values shown are averages from three different measurements. It is noteworthy to point out that the same illumination on the surfaces that were kept in vacuum or argon environment did not result in the wettability change at all, indicating the important role of water in the wettability transition process. | ||
The photocatalytic performance of the nitrogen doped TiO2 (24 hour sample) with various surface wettabilities is shown in Fig. 6. As the surface becomes more and more hydrophilic, the photocatalytic activity is significantly enhanced. It is noteworthy that the decomposition processes of methylene blue for the 135° and 90° samples do not follow the same kinetics as those for the 60° and 0° samples. The reason is that with light illumination, the surfaces of the 135° and 90° samples continue to transform towards hydrophilicity, hence increasing the photocatalytic activity of the sample during the photocatalysis process.
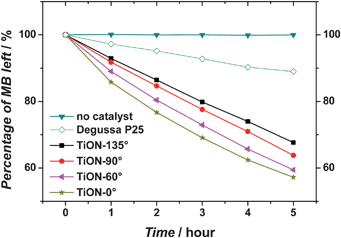 | ||
| Fig. 6 Visible-light induced photocatalysis of methylene blue by nitrogen-doped TiO2 with various surface wettabilities. The numeric values of these surface contact angles are included in the figure legend. For comparison, the photocatalytic performance of Degussa P25 (a commercial available TiO2 product) under the same condition is also shown. | ||
Conclusion
In conclusion, strongly hydrophobic N-doped TiO2 nanorods have been prepared using a hydrothermal method. These anatase TiO2 nanorods have a length of approximately 130 nm and diameter of approximately 35 nm. The optimum time for the nanorod growth was determined to be 18 hours in correspondence with both SEM and UV-vis diffuse reflective observations. The surfaces of the N-doped TiO2 samples are strongly hydrophobic with contact angles as high as 141°. These surfaces transform towards hydrophilic character under visible-light illumination and reversibly to strongly hydrophobic character after being kept in the dark for 2 weeks or after moderate sintering at 120 °C. The photocatalytic activity of these nanoscaled catalysts is found to depend strongly on their surface wettability.Acknowledgements
We acknowledge partial support from the National Science Foundation (CTS-0608896) through the NIRT program.Notes and references
- D. Quere, Rep. Prog. Phys., 2005, 68, 2495–2532 CrossRef.
- P. Roach, N. J. Shirtcliffe and M. I. Newton, Soft Matter, 2008, 4, 224–240 RSC.
- X. M. Li, D. Reinhoudt and M. Crego-Calama, Chem. Soc. Rev., 2007, 36, 1350–1368 RSC.
- M. L. Gou, X. Y. Li, M. Dai, C. Y. Gong, X. H. Wang, Y. Xie, H. X. Deng, L. J. Chen, X. Zhao, Z. Y. Qian and Y. Q. Wei, Int. J. Pharm., 2008, 359, 228–233 CrossRef CAS.
- L. Feng, Z. Y. Zhang, Z. H. Mai, Y. M. Ma, B. Q. Liu, L. Jiang and D. B. Zhu, Angew. Chem., Int. Ed., 2004, 43, 2012–2014 CrossRef CAS.
- T. Onda, S. Shibuichi, N. Satoh and K. Tsujii, Langmuir, 1996, 12, 2125–2127 CrossRef CAS.
- R. Wang, K. Hashimoto, A. Fujishima, M. Chikuni, E. Kojima, A. Kitamura, M. Shimohigoshi and T. Watanabe, Nature, 1997, 388, 431–432 CrossRef CAS.
- H. Y. Erbil, A. L. Demirel, Y. Avci and O. Mert, Science, 2003, 299, 1377–1380 CrossRef CAS.
- M. W. Denny, Science, 2008, 320, 886 CrossRef CAS.
- F. Xia, Y. Zhu, L. Feng and L. Jiang, Soft Matter, 2009, 5, 275–281 RSC.
- S. Daniel, M. K. Chaudhury and J. C. Chen, Science, 2001, 291, 633–636 CrossRef CAS.
- D. J. Beebe, J. S. Moore, Q. Yu, R. H. Liu, M. L. Kraft, B. H. Jo and C. Devadoss, Proc. Natl. Acad. Sci. U. S. A., 2000, 97, 13488–13493 CrossRef CAS.
- G. Q. Zhai, Y. Lei, E. T. Kang and K. G. Neoh, Surf. Interface Anal., 2004, 36, 1048–1051 CrossRef CAS.
- J. D. Jeyaprakash, S. Samuel, P. Ruther, H. P. Frerichs, M. Lehmann, O. Paul and J. Ruhe, Sens. Actuators, B, 2005, 110, 218–224 CrossRef.
- A. Fujishima and K. Honda, Nature, 1972, 238, 37–38 CAS.
- M. R. Hoffmann, S. T. Martin, W. Y. Choi and D. W. Bahnemann, Chem. Rev., 1995, 95, 69–96 CrossRef CAS.
- C. Burda, X. B. Chen, R. Narayanan and M. A. El-Sayed, Chem. Rev., 2005, 105, 1025–1102 CrossRef CAS.
- I. Nakamura, N. Negishi, S. Kutsuna, T. Ihara, S. Sugihara and K. Takeuchi, J. Mol. Catal. A: Chem., 2000, 161, 205–212 CrossRef CAS.
- X. T. Zhang, M. Jin, Z. Y. Liu, D. A. Tryk, S. Nishimoto, T. Murakami and A. Fujishima, J. Phys. Chem. C, 2007, 111, 14521–14529 CrossRef CAS.
- Y. X. Zhao, X. F. Qiu and C. Burda, Chem. Mater., 2008, 20, 2629–2636 CrossRef CAS.
- R. Asahi, T. Morikawa, T. Ohwaki, K. Aoki and Y. Taga, Science, 2001, 293, 269–271 CrossRef CAS.
- S. U. M. Khan, M. Al-Shahry and W. B. Ingler, Science, 2002, 297, 2243–2245 CrossRef CAS.
- X. Chen and S. S. Mao, Chem. Rev., 2007, 107, 2891–2959 CrossRef CAS.
- J. W. Wang, W. Zhu, Y. Q. Zhang and S. X. Liu, J. Phys. Chem. C, 2007, 111, 1010–1014 CrossRef CAS.
- F. Dong, W. R. Zhao and Z. B. Wu, Nanotechnology, 2008, 19, 365607 CrossRef.
- D. N. Tafen, J. Wang, N. Q. Wu and J. P. Lewis, Appl. Phys. Lett., 2009, 94, 093101 CrossRef.
- (a) C. Burda, Y. B. Lou, X. B. Chen, A. C. S. Samia, J. Stout and J. L. Gole, Nano Lett., 2003, 3, 1049–1051 CrossRef CAS; (b) J. L. Gole, J. Stout, C. Burda, Y. Lou and X. Chen, J. Phys. Chem. B, 2004, 108, 1230–1242 CrossRef CAS.
- X. B. Chen, Y. B. Lou, A. C. S. Samia, C. Burda and J. L. Gole, Adv. Funct. Mater., 2005, 15, 41–49 CrossRef CAS.
- X. F. Qiu, Y. X. Zhao and C. Burda, Adv. Mater., 2007, 19, 3995–3999 CrossRef CAS.
- P. Romero-Gomez, V. Rico, A. Borras, A. Barranco, J. P. Espinos, J. Cotrino and A. R. Gonzalez-Elipe, J. Phys. Chem. C, 2009, 113, 13341–13351 CrossRef CAS.
- W. T. Sun, S. Y. Zhou, P. Chen and L. M. Peng, Chem. Commun., 2008, 603–605 RSC.
- X. J. Feng, J. Zhai and L. Jiang, Angew. Chem., Int. Ed., 2005, 44, 5115–5118 CrossRef CAS.
- X. H. Xu, Z. Z. Zhang and W. M. Liu, Colloids Surf., A, 2009, 341, 21–26 CrossRef CAS.
- X. T. Zhang, M. Jin, Z. Y. Liu, S. Nishimoto, H. Saito, T. Murakami and A. Fujishima, Langmuir, 2006, 22, 9477–9479 CrossRef CAS.
- H. S. Lim, D. Kwak, D. Y. Lee, S. G. Lee and K. Cho, J. Am. Chem. Soc., 2007, 129, 4128–4129 CrossRef CAS.
- H. G. Yang, C. H. Sun, S. Z. Qiao, J. Zou, G. Liu, S. C. Smith, H. M. Cheng and G. Q. Lu, Nature, 2008, 453, 638–642 CrossRef CAS.
- I. M. Lifshitz and V. V. Slyozov, J. Phys. Chem. Solids, 1961, 19, 35–50 CrossRef.
- S. Sakthivel, M. Janczarek and H. Kisch, J. Phys. Chem. B, 2004, 108, 19384–19387 CrossRef CAS.
- V. N. Kuznetsov and N. Serpone, J. Phys. Chem. C, 2009, 113, 15110–15123 CrossRef CAS.
- P. Romero-Gomez, V. Rico, A. Borras, A. Barranco, J. P. Espinos, J. Cotrino and A. R. Gonzalez-Elipe, J. Phys. Chem. C, 2009, 113, 13341–13351 CrossRef CAS.
- J. Wang, D. N. Tafen, J. P. Lewis, Z. L. Hong, A. Manivannan, M. J. Zhi, M. Li and N. Q. Wu, J. Am. Chem. Soc., 2009, 131, 12290–12297 CrossRef CAS.
- A. B. D. Cassie and S. Baxter, Trans. Faraday Soc., 1944, 40, 546–551 RSC.
- A. Fujishima, T. N. Rao and D. A. Tryk, J. Photochem. Photobiol. C, 2000, 1, 1–21 CrossRef CAS.
| This journal is © The Royal Society of Chemistry 2010 |
