Nucleation sequence on the cation exchange process between Y0.95Eu0.05PO4 and CePO4 nanorods†
Abdul Karim
Gulnar
*a,
Vasanthakumaran
Sudarsan
*b,
Rajesh Kumar
Vatsa
b,
Tyagarajan
Sakuntala
c,
Awesh Kumar
Tyagi
b,
Ujjal Kumar
Gautam
d and
Ajayan
Vinu
d
aMaterial Processing Division, Bhabha Atomic Research Centre, Trombay, Mumbai, 400085, India. E-mail: gulnarak@barc.gov.in; vsudar@barc.gov.in; Fax: +91-22-25505151; Tel: +91-22-25590495
bChemistry Division, Bhabha Atomic Research Centre, Trombay, Mumbai, 400085, India
cHigh Pressure Physics Division, Bhabha Atomic Research Centre, Trombay, Mumbai, 400085, India
dNational Institute for Materials Science, 1-1, Namiki, Tsukuba, Ibaraki, 3050044, Japan
First published on 11th October 2010
Abstract
Nanorods of Y0.95Eu0.05PO4@CePO4 (Y0.95Eu0.05PO4 phase was nucleated first and then a CePO4 phase was nucleated) and CePO4@Y0.95Eu0.05PO4 (CePO4 phase was nucleated first and then Y0.95Eu0.05PO4 phase was nucleated) were prepared at a relatively low temperature of 140 °C in ethylene glycol medium. Based on XRD, TEM and Raman studies it has been inferred that Y0.95Eu0.05PO4@CePO4 sample consists of a mixture of bigger (length around 800–1000 nm and width around of 80–100 nm) and smaller (length around 70–100 nm and width around 10–20 nm) nanorods, having monoclinic CePO4 and tetragonal YPO4 structure, whereas CePO4@Y0.95Eu0.05PO4 sample consists of mainly small nanorods having a single phase CePO4 structure. From the detailed luminescence studies it has been established that there exists significant incorporation of Y3+/Eu3+ ions in the CePO4 phase in CePO4@Y0.95Eu0.5PO4 sample. This has been attributed to the cation exchange taking place between Ce3+ ions in CePO4 host and Eu3+ and Y3+ ions in solution during the synthesis stage. Unlike this, such an exchange is not possible for Y0.95Eu0.05PO4@CePO4 sample synthesized under identical conditions due to the higher solubility product (Ksp) value of YPO4 compared to CePO4. Incorporation of Eu3+ in the CePO4 lattice of CePO4@Y0.95Eu0.5PO4 sample is confirmed by the significant reduction in the lifetime of 5D0 level of Eu3+ and the luminescence intensity from Eu3+, arising due to the electron transfer between the Ce3+/Ce4+ and Eu3+/Eu2+ species. These results are further supported by the non-radiative decay rates and quantum yields calculated from the emission spectrum.
1. Introduction
Lanthanide phosphates (LnPO4) are robust materials for various technological applications involving lasers due to their high thermal and chemical stability, extremely low solubility in water and improved solubility for rare earth ions like Nd3+.1–6 They exist mainly in two crystalline modifications, known as monazite and xenotime forms. Monazite structure is formed by lanthanide phosphates with relatively larger ionic radii lanthanide ions (i.e. La3+ - Gd3+) and xenotime structure is formed by smaller ionic radii lanthanide ions (i.e. Tb3+-Lu3+). YPO4 crystallizes in the xenotime structure and belongs to the tetragonal crystal system whereas CePO4 crystallizes in monazite structure and belongs to the monoclinic crystal system.7 An essential difference in both structures is that in the xenotime structure, Y3+ ions exist as regular YO8 polyhedra whereas in the monazite structure, Ce3+ ions exist as CeO9 polyhedra. Lanthanide phosphates have got an important application as inter layers in high temperature oxide-oxide ceramic matrix composites (CMCs).8–10 They are known to improve the toughness in ceramic composites by providing crack deflection at the fiber–matrix interface. This property mainly depends on the thermal expansion coefficient of the material. Generally xenotime structures have a lower thermal expansion coefficient as compared to monazite structures.11–13 Thus the solid solution of lanthanide phosphates with xenotime and monazite structure can give rise to a material with a tunable thermal expansion coefficient. Another approach to make materials with a tunable thermal expansion coefficient is to form materials with core-shell geometry. The core or the shell can be the materials with either monozite or xenotime structures. If the core-shell materials have nano size dimensions, it will be an advantage as it can be used to distribute uniformly in a matrix.A number of studies are available on the low temperature synthesis and characterization of lanthanide phosphate nano-materials with core-shell geometry.14–18 For example, Kompe et al.17 employing co-precipitation in presence of coordinating ligands like tributyl phosphate (TBP) and trihexyl amine, prepared CePO4![[thin space (1/6-em)]](https://www.rsc.org/images/entities/char_2009.gif) :Tb3+ core- and CePO4:Tb3+-LaPO4 core-shell nanoparticles in water free environments at 200 °C. The authors have used the luminescence technique to confirm the core-shell formation. They observed that the luminescence properties of CePO4:Tb3+ nanorods/nanoparticles get significantly improved when covered by a shell of LaPO4. Buissette et al.18 prepared highly luminescent core/shell particles with rhabdophane structures and it was observed that such particles have an improved stability against chemical and thermal oxidation.
:Tb3+ core- and CePO4:Tb3+-LaPO4 core-shell nanoparticles in water free environments at 200 °C. The authors have used the luminescence technique to confirm the core-shell formation. They observed that the luminescence properties of CePO4:Tb3+ nanorods/nanoparticles get significantly improved when covered by a shell of LaPO4. Buissette et al.18 prepared highly luminescent core/shell particles with rhabdophane structures and it was observed that such particles have an improved stability against chemical and thermal oxidation.
Although, the core-shell formation has been reported in various lanthanide based systems, the existence of core and shell materials with well defined demarcation is questionable, particularly in lanthanide based inorganic nano-materials. In a recent study, Dong et al.19 have demonstrated that when GdF3 nanoparticles dispersed in water are exposed to excess of La3+ ions, there exists a rapid exchange of Gd3+ ions from a GdF3 lattice by La3+ ions in aqueous solution, resulting in the formation of LaF3 nanoparticles and aqueous solution of Gd3+ ions. The extent of exchange has been found to depend on the time duration involved in the reaction. It is observed that lanthanide ions from the left of the periodic table (for example La3+) can replace the ones from the right (for example Gd3+) present in a lattice. Such rapid ion exchange process will be a hindrance to form materials with core-shell structures; at the same time it will be helpful for forming solid solutions with a range of compositions.
In our previous studies20,21 we have shown that lanthanide phosphate nano-materials with high dispersability in water can be easily prepared at low temperatures by using ethylene glycol as a solvent as well as a stabilizing ligand. In the present study we investigate the ion exchange process taking place between Ce3+ and Y3+&Eu3+ ions from CePO4 and Y0.95Eu0.05PO4 phases, respectively, by changing the sequence/order in which nucleation of CePO4 and Y0.95Eu0.05PO4 phases is taking place in ethylene glycol medium. The Eu3+ ion has been used as a probe to understand this, as its luminescence is very sensitive to the nature of the environment around the ion. Raman and X-ray diffraction (XRD) techniques have been used to further substantiate the luminescence results. To the best of the authors’ knowledge this is the first time that such studies are being carried out for two different LnPO4 nanorods by using luminescence and Raman spectroscopic techniques.
2. Experimental details
2.1 Materials
Chemicals used for the synthesis were AR grade Y2O3, Eu2O3, Ce2(CO3)3·5H2O and NH4H2PO4 (all 99.9% pure). All chemicals were used as obtained, without further purification.2.2 Synthesis of YPO4, Y0.95Eu0.05PO4 and CePO4 nano-materials
Around 0.5 g of Y2O3 and a stoichiometric amount of Eu2O3 (0 and 5 at% of Y3+) or 0.5 g of Ce2(CO3)3·5H2O were dissolved in dilute HCl and the excess of acid was removed by repeated evaporation by adding water. This was then mixed with 25 ml of ethylene glycol and heated first to 100 °C. At this temperature ∼0.14 g of NH4H2PO4 dissolved in 10 ml of ethylene glycol was added dropwise and the temperature was raised to 140 °C and maintained at this value for a period of two hours until the reaction was complete. The precipitate thus obtained was washed many times with acetone and ethanol and dried under ambient conditions. The powder samples are readily dispersible in solvents like methanol and water.2.3 Preparation of Y0.95Eu0.05PO4@CePO4 and CePO4@Y0.95Eu0.05PO4 samples
For preparing Y0.95Eu0.05PO4@CePO4 samples, initially Y0.95Eu0.05PO4 phase was nucleated in ethylene glycol medium as described above. The nucleation of the Y0.95Eu0.05PO4 phase is marked by the appearance of turbidity in the reaction medium. Five minutes after the nucleation of the Y0.95Eu0.05PO4 phase, Ce3+ solution in a minimum amount of dilute HCl and a required amount of NH4H2PO4 dissolved in 5 ml ethylene glycol were added and the temperature was maintained at this value for 1 more hour. After the reaction, the precipitate was washed several times with acetone and ethanol and dried under ambient conditions. The powder samples are readily dispersible in solvents like methanol and water. A similar procedure was employed for the CePO4@Y0.95Eu0.05PO4 sample.2.4 Synthesis of bulk cerium phosphate and yttrium phosphate
Bulk YPO4 and CePO4 were prepared using the precipitation method in water followed by heating in air at 800 °C. Initially two separate solutions, containing 0.5 g of Y2O3/Ce2(CO3)3·5H2O dissolved in 20 ml of dilute HNO3 and stoichiometric amount of NH4H2PO4 dissolved in distilled water, were made. Yttrium nitrate/cerium nitrate solution was added dropwise into a solution of NH4H2PO4 with vigorous stirring and the pH of the medium was raised to a value of 10 by adding NH4OH. The precipitate obtained was then filtered, washed, dried and calcined at 800 °C for 5 h.2.5 Characterization
X-Ray powder diffraction patterns were recorded using Ni filtered Cu Kα radiation (λ = 1.54178 Å) from a Diano Worburn, X-ray diffractometer attached with a graphite monochromator, operating at 35 kV and 20 mA. The lattice parameters were calculated from the diffraction peaks using the least squares fit method. TEM investigations were carried out using a JEOL JEM 3000F Microscope. Samples for TEM investigations were prepared by dispersing the samples in methanol and a drop of the above solution was put on a carbon coated holey TEM grids and allowed to dry. Raman spectra were recorded using a 532 nm line from a diode-pumped Nd-YAG laser (power 15 mW) focused to a spot size of about 20 μ. The scattered light was analysed using a home-built 0.9 m single monochromator coupled with a super notch filter and detected by a cooled charge couple device (CCD, Andor technology). The entrance slit was kept at 50 mm, which gave a resolution limited linewidth of 3 cm−1.All steady-state luminescence and lifetime measurements were carried out at room temperature by using an Edinburgh Instruments' FLSP 920 system, having a 450W Xe lamp, 60 W microsecond flash lamp and nanosecond Hydrogen flash lamp as the excitation sources. Around 20 mg sample was dispersed in 5 ml methanol prior to luminescence measurements. Emission spectra were corrected for the detector response and the excitation spectra for the lamp profile. All emission measurements were carried out with a resolution of 3 nm.
3. Results and discussion
Fig. 1 shows the X-ray diffraction patterns for Y0.95Eu0.05PO4@CePO4 and CePO4@Y0.95Eu0.05PO4 samples. The XRD pattern of Y0.95Eu0.05PO4@CePO4 sample shows peaks characteristic of both tetragonal yttrium phosphate and monoclinic CePO4 phases.22–24 Unlike that, the CePO4@Y0.95Eu0.05PO4 sample shows only the monoclinic cerium phosphate phase. Table 1 gives the unit cell parameters obtained from the least square fitting of the corresponding X-ray diffraction patterns. For the purpose of comparison, the lattice parameters are calculated for undoped CePO4 and YPO4 samples prepared by the identical methods and are also given in the table. There is a slight reduction in the unit cell volume for CePO4 phase and a slight increase in the unit cell volume of Y0.95Eu0.05PO4 phase for Y0.95Eu0.05PO4@CePO4 sample. A similar extent of decrease in the unit cell volume of CePO4 phase is also observed for CePO4@Y0.95Eu0.05PO4 sample compared to undoped CePO4. The increase in the unit cell volume of Y0.95Eu0.05PO4 phase compared to YPO4 has been attributed to the higher ionic radii of Eu3+ (1.07 Å) compared to Y3+ (1.02 Å).25 Similarly, a decrease in the unit cell volume of CePO4 phase in both samples indicates a partial replacement of Ce3+ ions (ionic radius = 1.14 Å) by Y3+/Eu3+ ions. The absence of peaks corresponding to Y0.95Eu0.5PO4 phase in the diffraction pattern of CePO4@Y0.95Eu0.05PO4 sample has been attributed to the significant extent of ion exchange between Ce3+ ions in the CePO4 lattice by Eu3+ and Y3+ ions present in the reaction medium. The reason for the observed ion exchange process is the lower solubility product for CePO4 phase (4.2 × 10⁻¹²) compared to YPO4 phase (1.4 × 10⁻¹¹)26 (assuming the free energy for the formation of Ce3+/Y3+ ions and CePO4/YPO4 phases in aqueous solution is the same as that in ethylene glycol medium). On the other hand, when the nucleation sequence is reversed, the conditions under which the Y0.95Eu0.05PO4 phase precipitates, the CePO4 phase also precipitates and ion exchange will be difficult between two different solid matrices. In order to confirm the above and to understand the observed variation in the lattice parameters, detailed studies have been carried out on these samples using transmission electron microscopy, Raman and luminescence spectroscopic techniques and the results are described below.| Sample | Lattice | Lattice parameters/Å | Volume/Å3 | |||
|---|---|---|---|---|---|---|
| a | b | c | β | |||
| CePO4@ Y0.95Eu0.05PO4 | Monoclinic | 6.766(7) | 6.997(4) | 6.453(4) | 103.56(6) | 296.892 |
| Y0.95Eu0.05PO4@ CePO4 | Tetragonal | 6.890(4) | 6.019(8) | 285.75 | ||
| Monoclinic | 6.760(6) | 6.983(3) | 6.462(5) | 103.59(6) | 296.544 | |
| 22undoped CePO4 | Monoclinic | 6.779(1) | 7.006(3) | 6.470(2) | 103.60(1) | 298.68 |
| 23undoped YPO4 | Tetragonal | 6.867(1) | 6.014(2) | 283.59 | ||
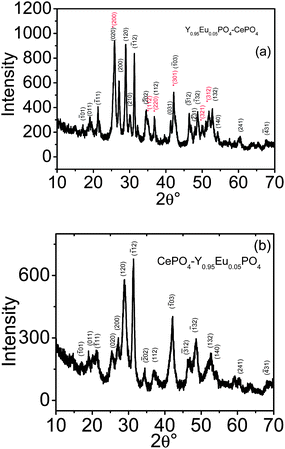 | ||
| Fig. 1 XRD patterns for (a) Y0.95Eu0.05PO4@CePO4 and (b) CePO4@Y0.95Eu0.05PO4 samples. The peaks marked with * correspond to Y0.95Eu0.05PO4 phase. Also the Miller indices of the planes corresponding to Y0.95Eu0.05PO4 phase are marked red in colour. | ||
Fig. 2 (a and b) shows the TEM images of Y0.95Eu0.05PO4@CePO4 and CePO4@Y0.95Eu0.05PO4 samples. The corresponding images from single phase Y0.95Eu0.05PO4 and CePO4 samples are shown in Fig. 1 of the ESI.† The Y0.95Eu0.05PO4@CePO4 sample consists of a mixture of bigger and smaller nanorods. The bigger nanorods have a length in the range 0.8–1 μm and width in the range of 80–100 nm, whereas for the smaller nanorods the lengths are in the range of 70–100 nm and width around 10–15 nm. A closer look of the image revealed that some of the bigger nanorods also exist in the form of aggregates (bundles). However in CePO4@Y0.95Eu0.05PO4 sample, only small nanorods having length in the range of 80–130 nm and width in the range of 10–15 nm are seen. The above results along with the TEM image of CePO4 nanorods shown in Fig. 1 of the ESI† suggest that Y0.95Eu0.05PO4@CePO4 sample consists of both CePO4 and YEuPO4 phases whereas CePO4@Y0.95Eu0.05PO4 sample mainly consists of single phase nanorods having CePO4 structure. These results agree well with that obtained from XRD studies discussed above. Fig. 2 (c and d) shows HRTEM images and a selected area electron diffraction (SAED) pattern acquired from a collection of Y0.95Eu0.05PO4@CePO4 and CePO4@Y0.95Eu0.05PO4 nano-crystals, respectively. The lattice spacing of 3.2 and 3.5 Å matches well with the (100) and (111) planes of Y0.95Eu0.05PO4 and CePO4 lattices. The ring pattern observed in the SAED images of CePO4@Y0.95Eu0.05PO4 nano-crystals (Fig. 2d) suggests a polycrystalline nature of the sample. Thus, the TEM observations, in addition to XRD results show that reversing the order of nucleation changes the dimensions and crystallinity of the nano-rods.
 | ||
| Fig. 2 TEM images of (a) Y0.95Eu0.05PO4@CePO4 (b) CePO4@Y0.95Eu0.05PO4 samples. Corresponding HRTEM images and SAED pattern for Y0.95Eu0.05PO4@CePO4 and CePO4@Y0.95Eu0.05PO4 samples, respectively, are shown in Fig. 2 (c and d). | ||
As the PO4 stretching vibrations are Raman active, the Raman spectrum of the sample can give a valuable information on the interaction of tetragonal Y0.95Eu0.05PO4 and monoclinic CePO4 phases. Hence the Raman spectrum of both Y0.95Eu0.05PO4@CePO4 and CePO4@Y0.95Eu0.05PO4 samples was recorded and is shown in Fig. 3. For the purpose of comparison Raman spectra were also recorded for bulk and nano forms of CePO4 and YPO4 phases. Fig. 3 (a) shows the Raman spectrum CePO4 nanorods and YPO4 nanoparticles along with that of bulk CePO4 and YPO4. The internal modes corresponding to PO4 vibration in the bulk samples appear at 1001 cm−1 in YPO4 and 971 cm−1 in CePO4 (Fig. 3(a)). In YPO4 nanoparticles the frequency of the PO4 stretching mode was found to be less by about 5 cm−1 as compared to that in bulk, besides, there is an asymmetric broadening of the peak. For CePO4 nanorods the peak maximum with respect to bulk CePO4 did not show any detectable variation. However the line widths are found to be more in nanorods compared to bulk sample. The broadening of the peak of YPO4 nanoparticles and CePO4 nanorods can be attributed to the combined effect of strain and phonon confinement as the dimensions get smaller. A similar effect has been observed in the Raman spectroscopic studies on the nanoparticles of CeO2.27 The Raman spectra of Y0.95Eu0.05PO4@CePO4 and CePO4@Y0.95Eu0.05PO4 samples are shown in Fig. 3(b). For Y0.95Eu0.05PO4@CePO4 sample, the peaks corresponding to the PO4 stretching vibrations from both CePO4 (973 cm−1) and Y0.95Eu0.05PO4 (992 cm−1) phases can be clearly seen. Deconvolution of the patterns revealed that their intensity ratio is 1:1; suggesting that in Y0.95Eu0.05PO4@CePO4 sample CePO4 and Y0.95Eu0.05PO4 exist as separate phases without having any interaction. Unlike this, for CePO4@Y0.95Eu0.05PO4 sample, mainly a broad asymmetric peak at around 973 cm−1 along with a weak shoulder around 993 cm−1 is observed. The peak at 973 cm−1 is characteristic of the symmetric stretching vibrations of the PO4 unit of monoclinic CePO4 and that around 993 cm−1 is due to tetragonal YEuPO4. The deconvolution of the spectrum revealed that their intensity is in a ratio of 9 : 1. A comparison of the band at 973 cm−1 with that of pure CePO4 nanorods revealed that both the peak maximum and line shape have changed in the CePO4@Y0.95Eu0.05PO4 nanorods as compared to pure CePO4 nanorods. This has been attributed to the incorporation of Y3+ and Eu3+ in the lattice of CePO4. The very weak intensity of the peak corresponding to PO4 stretching of YEuPO4 phase indicate that most of the Y3+ and Eu3+ions are getting incorporated in the CePO4 lattice.
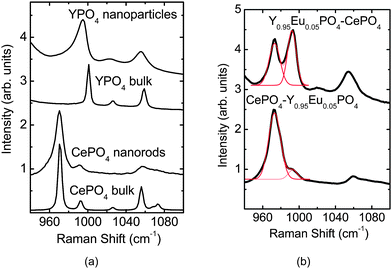 | ||
| Fig. 3 Raman spectrum for (a) bulk and nano phases of CePO4 and YPO4 samples. The corresponding patterns for Y0.95Eu0.05PO4@CePO4 and CePO4@Y0.95Eu0.05PO4 samples are shown in Fig. 3(b). | ||
Fig. 4(a) shows the emission spectrum for as prepared Y0.95Eu0.05PO4 nanoparticles dispersed in methanol, obtained after exciting the samples at 230 nm. The peaks around 591 and 615 nm are characteristic of 5D0 → 7F1 (magnetic dipole allowed) and 5D0 → 7F2 (electric dipole allowed) transitions respectively of Eu3+ ions. The ratio of the relative intensity of 5D0 → 7F2 to 5D0 → 7F1 transition known as the asymmetric ratio of luminescence, is measure of the extent of distortion around the Eu3+ ion. The value is found to be 1.4 for Y0.95Eu0.05PO4 nanoparticles. In crystalline YPO4, Y3+ ions have D2h symmetry and hence in Y0.95Eu0.05PO4 nanoparticles, Eu3+ ions will also have D2h symmetry22 which favors both electric and magnetic dipole transitions. The excitation spectrum corresponding to 591 nm emission is shown as an inset in Fig. 4(a). The broad peak centered around 230 nm is characteristic of the Eu–O charge transfer process in YPO4 host. In addition to this, sharp peaks due to intra 4f transitions of Eu3+ ions can also be clearly seen in the figure. As expected, strong Eu3+ emission has been observed from the sample on exciting at the charge transfer peak maximum (230 nm). The decay curve corresponding to 590 nm emission from the nanoparticles is shown in Fig. 4(b). The decay is found to be bi-exponential with a faster decay component of 0.7 ms (14%) and a slower decay component of 2.7 ms (86%). The faster decay component has been attributed to the Eu3+ ions at the surface of the nanoparticles and the slower to the ones at the bulk of nanoparticles.
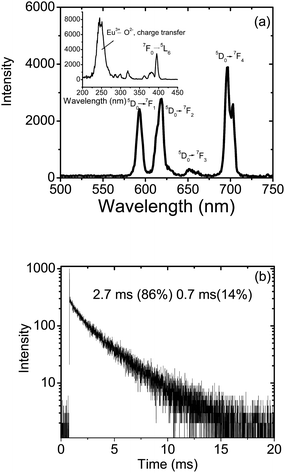 | ||
| Fig. 4 Emission spectrum (a) and decay curve corresponding to 5D0 level of Eu3+ ions (b) for as prepared Y0.95Eu0.05PO4 nanoparticles dispersed in methanol (excitation wavelength used was 230 nm for recording the emission spectrum and 394 nm for recording the decay curve). The inset in Fig. 4(a) shows an excitation spectrum corresponding to 591 nm emission. | ||
Fig. 5 (a and b) shows the emission spectrum and decay curves corresponding to the 5D0 level of Eu3+ from Y0.95Eu0.05PO4@CePO4 sample. The emission spectra of Y0.95Eu0.05PO4 nanoparticles and Y0.95Eu0.05PO4@CePO4 sample are similar and for the latter the asymmetric ratio of luminescence is also calculated to be 1.4. The same asymmetric ratio of luminescence for both Y0.95Eu0.05PO4 nanoparticles and Y0.95Eu0.05PO4@CePO4 sample very clearly demonstrates that Eu3+ environment is the same in both samples. This is further supported by the comparable lifetime values, namely 0.46 ms (12%) and 2.3 ms (88%), corresponding to the 5D0 level of Eu3+ ions in Y0.95Eu0.05PO4@CePO4 sample. This result is also in agreement with the XRD and Raman results, as it reveals the coexistence of both CePO4 and Y0.95Eu0.05PO4 phases. The above lifetime values also confirm that a core-shell structure with Y0.95Eu0.05PO4 core and CePO4 shell does not exist in the sample, as it would have resulted in a significant change in the 5D0 lifetime values of Eu3+ ions, which is not observed in the present study. Even though the asymmetric ratio of luminescence and lifetime of 5D0 level of Eu3+ are comparable for both Y0.95Eu0.05PO4 nanoparticles and Y0.95Eu0.05PO4@CePO4 sample, the relative intensity of 7F0 → 5L6 and Eu3+-O2− charge transfer transitions are quite different in both samples. This has been attributed to the fact that in the case of Y0.95Eu0.05PO4 sample only one type of Eu3+ ion is present with the lattice and all the Eu3+ ions can undergo Eu3+-O2− charge transfer processes. Unlike this, in the case of Y0.95Eu0.05PO4@CePO4 sample some of the Eu3+ ions present on the surface of the Y0.95Eu0.05PO4 phase can interact with the Ce3+ ions of CePO4 phase. This interaction can have a competing effect with the Eu3+ and O2− charge transfer process and thereby reduce the intensity of the charge transfer band in the excitation spectrum corresponding to Eu3+ emission from the Y0.95Eu0.05PO4@CePO4 sample. Detailed Ce3+ luminescence studies to further substantiate this aspect have been carried out on this sample as well as on CePO4@Y0.95Eu0.05PO4 sample and are discussed below.
 | ||
| Fig. 5 Emission spectrum (a) and decay curve (b) corresponding to the 5D0 level of Eu3+ from Y0.95Eu0.05PO4@CePO4 sample. (The excitation wavelength used was 230 nm for recording the emission spectrum and 394 nm for recording the decay curve.) The inset in Fig. 5(a) shows an excitation spectrum corresponding to 591 nm emission. | ||
Fig. 6 (a and b) shows the emission spectrum and decay curve corresponding to Ce3+ emission from the Y0.95Eu0.05PO4@CePO4 sample obtained after 296 nm excitation. The corresponding excitation spectrum is shown as an inset. The peak around 350 nm is characteristic of transition forming the lowest excited state of 5d1 electronic configuration (2T2 and 2E levels) of Ce3+ to the 2F5/2 and 2F7/2 levels of its ground state 4f1 configuration. The excited state corresponding to the Ce3+ emission has been found to decay bi-exponentially with decay time of 10.5 ns (54%) and 2.8 ns (46%). In bulk CePO4, Ce3+ ions are having a distorted environment with a local point group symmetry of Cs.28 Hence a single exponential decay is not expected from the sample. However at this stage it is difficult to pinpoint the origin of the bi-exponential nature of the decay curves.
 | ||
| Fig. 6 The emission spectrum (a) and decay curve (b) corresponding to Ce3+ emission from the Y0.95Eu0.05PO4@CePO4 sample obtained after 296 nm excitation. The corresponding excitation spectrum monitored at 350 nm emission is shown as an inset in Fig. 6(a). | ||
Fig. 7(a) shows the emission spectrum from CePO4@Y0.95Eu0.05PO4 sample obtained after 230 nm excitation. The emission spectrum is too noisy with a very poor signal to noise ratio indicating that Eu3+ emission is significantly quenched in this sample. This is further supported by the lifetime values of the 5D0 level of Eu3+ ions in the sample, shown in Fig. 7(b). This is because in this sample Eu3+ ions must be occupying both Ce3+ and Y3+ sites due to the formation of solid solution between CePO4 and Y0.95Eu0.05PO4 phases brought about by the ion exchange of Ce3+ ions from CePO4 host by Y3+/Eu3+ ions in solution at the synthesis stage. Eu3+ ions, which are near to Ce3+ sites, have got a tendency to get converted to Eu2+ ions.29 This is associated by the oxidation of Ce3+ to Ce4+.29 The electron transfer process is schematically represented in Fig. 8. The excited electron at the 5d level of Ce3+ ions can jump to Eu3+ level resulting in the formation of Eu2+ and Ce4+. However as the occupied Eu2+ ground state level is higher than the unoccupied Ce3+ ground state level, the electron can get transferred back to Ce4+. No photon is emitted in this process30 and all the absorbed energy gets non-radiatively decayed. This results in the formation of ground state Ce3+ and Eu3+ ions in the sample, a situation before the absorption of energy. The absence of EPR signals characteristic of Eu2+ species from the sample even at liquid nitrogen temperatures also confirmed that the above mechanism is taking place in the sample. It is to be noted that this process can take place only for Ce3+ and Eu3+ ions which are in the near proximity. One of the reasons for the faster decay time of 5D0 level of Eu3+ ions has been attributed to the non-radiative decay of the excited state of Eu3+ ion brought about by the above mentioned electron transfer processes between Ce3+/Ce4+ and Eu3+/Eu2+ species taking place in the lattice. Such electron transfer process and non radiative decay of Eu3+ excited state are also expected to have a competing effect on the Eu3+-O2− charge transfer process. This has been attributed to the reason for the change in the relative intensities of Eu3+-O2− charge transfer peak and 7F0 → 5L6 transition peak of Eu3+ ions in Y0.95Eu0.05PO4@CePO4 sample compared to Y0.95Eu0.05PO4 nanoparticles.
 | ||
| Fig. 7 Emission spectrum (a) and decay curve for 590 nm emission (b) corresponding to CePO4@Y0.95Eu0.05PO4 sample obtained after 230 nm excitation. The corresponding excitation spectrum for 615 nm emission is shown as an inset in Fig. 7(a). | ||
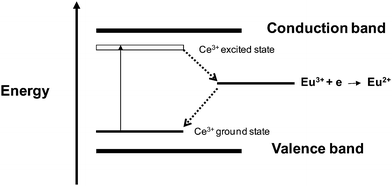 | ||
| Fig. 8 Energy level scheme showing the electron jumps (represented as dotted lines) taking place between Eu3+ and Ce3+ ions in CePO4 host. | ||
Ce3+ emission from CePO4@Y0.95Eu0.05PO4 sample is shown in Fig. 9 along with its decay curve. The emission and excitation peak characteristic of transition between 4f and 5d states can be very clearly seen. However the lifetime values are shorter compared to the ones corresponding to Y0.95Eu0.05PO4@CePO4 sample. The reason for the quenching effect is the non-radiative process associated with the Ce3+ ions mentioned above taking place in the sample. Thus the luminescence studies confirm the fact that, in the case of CePO4@Y0.95Eu0.05PO4 sample Eu3+/Y3+ get incorporated into the CePO4 lattice. This is associated with a significant reduction in the luminescence intensity from Ce3+ and Eu3+ ions. Unlike this, for Y0.95Eu0.05PO4@CePO4 sample, there exist separate phases of CePO4 and Y0.95Eu0.05PO4 with interaction between Ce3+ and Y3+ ions existing only at the surface of Y0.95Eu0.05PO4 phase. The reduction in the Eu3+ luminescence intensity can also be attributed to the reduction in the Eu3+ concentration in CePO4@Y0.95Eu0.05PO4 sample compared to Y0.95Eu0.05PO4@CePO4 sample. The above inferences are further confirmed by Raman and XRD results. In order to further substantiate the Eu3+ incorporation in CePO4 phase of CePO4@ Y0.95Eu0.05PO4 samples, the intensity parameters (Ωλ) where λ = 2 and 4 along with the radiative (Arad) and non-radiative (Anrad) rates for Eu3+ ions in all three samples were calculated from the emission spectrum and are described in the following section.
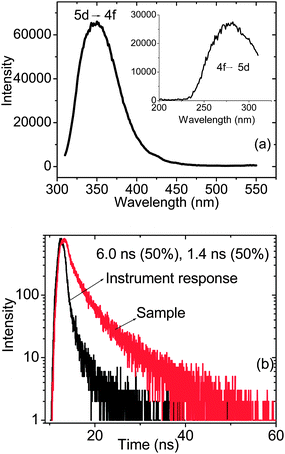 | ||
| Fig. 9 Emission spectrum (a) and decay curve (b) corresponding to Ce3+ emission from the CePO4@Y0.95Eu0.05PO4 sample obtained after 296 nm excitation. The corresponding excitation spectrum monitored at 350 nm emission is shown as an inset in Fig. 9(a). | ||
The intensity parameters (Ωλ) where λ = 2 and 4 can be calculated either theoretically from the structural information or experimentally from the emission/absorption spectrum. The Ωλ value is a measure of the extent of co-valency around Eu3+ ions. Further the value also depends on the nature of the forced electric dipole transitions as well as the dynamic coupling mechanisms operating in the sample. In the present study we have calculated the Ωλ values (where λ = 2 and 4) by considering the 5D0 → 7F1 transition as the reference. Emission intensity can be expressed as I = NħωA, where N is the population of the emitting level (5D0), ħω is the transition energy, and A is Einstein's coefficient of spontaneous emission.31A is related to Ωλ values through the following expression (eqn (1))
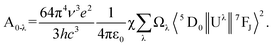 | (1) |
| Compounds | A rad/s−1 | A nrad/s−1 | A total/s−1 | Ω 2/10−20 cm2 | Ω 4/10−20 cm2 | Quantum yields (%) |
|---|---|---|---|---|---|---|
| Y0.95Eu0.05PO4 | 257 | 156 | 413 | 1.7 | 4.9 | 62 |
| Y0.95Eu0.05 PO4@CePO4 | 280 | 202 | 482 | 1.7 | 5.7 | 58 |
| CePO4@Y0.95 Eu0.05PO4 | 242 | 3612 | 3854 | 1.5 | 4.0 | 6 |
4. Conclusions
Based on XRD, Raman and TEM studies it has been concluded that in CePO4@Y0.95Eu0.05PO4 sample, Y3+/Eu3+ ions get incorporated in the CePO4 lattice due to ion exchange process taking place during the synthesis stage. Unlike this, such ion exchange is not taking place with Y0.95Eu0.05PO4@CePO4 sample and the lower solubility product values of CePO4 compared to YPO4 is the reason responsible for this. The asymmetric ratio of luminescence, 5D0 lifetime values of Eu3+ ions, along with the excited state lifetime values of Ce3+ in these samples further support the incorporation of Y3+/Eu3+ in the CePO4 host of CePO4@Y0.95Eu0.05PO4 sample and the existence of separate CePO4 and Y0.95Eu.05 PO4 phases in Y0.95Eu0.05PO4@CePO4 sample. The calculated values of non-radiative decay rates and quantum yields from the emission spectrum of these samples also confirm the significant incorporation of Eu3+ in the CePO4 phase of CePO4@Y0.95Eu0.05PO4 sample. The poor Eu3+ luminescence from CePO4@Y0.95Eu0.05PO4 sample is due to the electron exchange taking place between the Ce3+/Ce4+ and Eu3+/Eu2+ species present in the sample.Acknowledgements
The authors thank Dr A. K. Suri, Director, Materials Group, BARC, Dr T. Mukherjee, Director, Chemistry Group, BARC, Dr D. Das, Head, Chemistry Division, BARC, Dr I. G. Sharma, Head, Materials Processing Division, BARC and Dr N. Krishnamurthy, Head, Advanced Ceramics Section, BARC, for their encouragement during this work.References
- G. Y. Adachi and N. Imanaka, Chem. Rev., 1998, 98, 1479–514 CrossRef CAS.
- A. H. Peruski, L. H. Johnson and L. F. Peruski, J. Immunol. Methods, 2002, 263, 35–41 CrossRef CAS.
- J. A. Capobianco, J. C. Boyer, F. Vetrone, M. A. Speghini and M. Bettinelli, Chem. Mater., 2002, 14, 2915–21 CrossRef CAS.
- Y. Guo, P. Woznicki, A. Barkatt, E. E. Saad and I. G. Talmy, J. Mater. Res., 1996, 11, 639–649 CrossRef CAS.
- F. H. Firsching and S. N. Brune, J. Chem. Eng. Data, 1991, 36, 93–95 CrossRef.
- A. Rouanel, J. J. Serra, K. Allaf and V. P. Orlovskii, Inorg. Mater., 1981, 17, 76–81.
- R. Gratz and W. Heinrich, Am. Mineral., 1997, 82, 772–780 CAS.
- J. B. Davis, J. P. A. Lofvander, A. G. Evans, E. Bischoff and M. L. Emiliani, J. Am. Ceram. Soc., 1993, 76, 1249–1257 CrossRef CAS.
- D. B. Marshall, P. E. D. Morgan, R. M. Houley and J. T. Cheung, J. Am. Ceram. Soc., 2005, 81, 951–956 CrossRef.
- R. J. Kerans, R. S. Hay, T. A. Parthasarathy and M. K. Cinibulk, J. Am. Ceram. Soc., 2004, 85, 2599–2632 CrossRef.
- Y. Hikichi, T. Ota, K. Daimon, H. Keiji, T. Hattori and M. Mizuno, J. Am. Ceram. Soc., 2005, 81, 2216–2218 CrossRef.
- Y. Hikichi and T. Nomura, J. Am. Ceram. Soc., 1987, 70, C252–C253.
- E. C. Subbarao, D. K. Agrawal, H. A. McKinstry, C. W. Sallese and R. Roy, J. Am. Ceram. Soc., 1990, 73, 1246–1252 CrossRef CAS.
- M. Cao, C. Hu, Q. Wu, C. Guo, Y. Qi and E. Wang, Nanotechnology, 2005, 16, 282–286 CrossRef CAS.
- L. Zhu, X. Liu, Q. Li, J. Li, S. Zhang, J. Meng and X. Cao, Nanotechnology, 2006, 17, 4217–4222 CrossRef.
- M. Guan, J. Sun, M. Han, Z. Xu, F. Tao, G. Yin, X. Wei, J. Zhu and X. Jiang, Nanotechnology, 2007, 18, 415602–7 CrossRef.
- K. Kompe, H. Borchert, J. Storz, A. Lobo, S. Adam, T. Möller and M. Hasse, Angew. Chem., Int. Ed., 2003, 42, 5513–5516 CrossRef.
- V. Buissette, M. Moreau, T. Gacoin and J. P. Boilot, Adv. Funct. Mater., 2006, 16, 351–355 CrossRef CAS.
- C. Dong and F. C. J. M. van Veggel, ACS Nano, 2009, 3, 123–130 CrossRef CAS.
- K. Srinivasu, R. S. Ningthoujam, V. Sudarsan, R. K. Vatsa, A. K. Tyagi, P. Srinivasu and A. Vinu, J. Nanosci. Nanotechnol., 2009, 9, 3034–3039 CrossRef CAS.
- A. K. Gulnar, V. Sudarsan, R. K. Vatsa, A. K. Tyagi, R. C. Hubli, U. K. Gautam and A. Vinu, Cryst. Growth Des., 2009, 9, 2451–2456 CrossRef CAS.
- Y. Ni, J. M. Hughes and A. N. Mariano, Am. Miner., 1995, 80, 21–26 CAS.
- PC-PDF Card No. 84–0335.
- PC-PDF Card No. 84–0247.
- R. D. Shanon, Acta Crystallogr., Sect. A: Cryst. Phys., Diffr., Theor. Gen. Crystallogr., 1976, 32, 751–767 CrossRef.
- Z. S. Cetiner, S. A. Wood and C. H. Gammons, Chem. Geol., 2005, 217, 147–169 CrossRef CAS.
- E. Jonathan, S. Richard, D. Robinson, F. Zhang, S. W. Chan and I. P. Herman, Phys. Rev. B: Condens. Matter Mater. Phys., 2001, 64, 245407–8 CrossRef.
- D. F. Mullica, D. A. Grossie and L. A. Boatner, J. Solid State Chem., 1985, 58, 71–77 CrossRef CAS.
- G. Blasse and B. C. Grabmaier, Luminescent Materials, Springer-Verlag, Berlin, 1994, p. 87–88 Search PubMed.
- P. Dorenbos, in Phosphor hand book, ed. W. M. Yen, S. Shionoya and H. Yamamoto, CRC press, Boca Raton, 2007, pp. 142–143 Search PubMed.
- D. Hreniak, W. Strek, J. Amami, Y. Guyot, G. Boulon, C. Goutaudier and R. Pazik, J. Alloys Compd., 2004, 380, 348–351 CrossRef CAS.
- W. T. Carnall, H. Crosswhite and H. M. Crosswhite, Energy Structure and Transition Probabilities of the Trivalent Lanthanides in LaF3, Argonne National Laboratory Report, USA, unnumbered, 1977 Search PubMed.
- C. A. Kodaira, H. F. Brito, O. L. Malta and O. A. Serra, J. Lumin., 2003, 101, 11–21 CrossRef CAS.
Footnote |
| † Electronic supplementary information (ESI) available: TEM images and SAED patterns from (a) CePO4 nanorods and (b) Y0.95Eu0.05PO4 nanoparticles. See DOI: 10.1039/c0nr00334d |
| This journal is © The Royal Society of Chemistry 2010 |