Cell surface-based differentiation of cell types and cancer states using a gold nanoparticle-GFP based sensing array†
Avinash
Bajaj
a,
Subinoy
Rana
a,
Oscar R.
Miranda
a,
Joseph C.
Yawe
a,
D. Joseph
Jerry
b,
Uwe H. F.
Bunz
c and
Vincent M.
Rotello
*a
aDepartment of Chemistry, University of Massachusetts Amherst, 710 North Pleasant Street, Amherst, MA 01003, USA. E-mail: rotello@chem.umass.edu; Fax: (+1)413-5452058
bDepartment of Veterinary and Animal Science, University of Massachusetts Amherst, 710 North Pleasant Street, Amherst, MA 01003, USA
cSchool of Chemistry and Biochemistry, Georgia Institute of Technology, 901 Atlantic Drive, Atlanta, GA 30332, USA
First published on 24th May 2010
Abstract
Gold nanoparticle-green fluorescent protein (NP-GFP) based arrays have been created for rapid identification of mammalian cells on the basis of cell surface properties. Highly reproducible characteristic patterns were obtained from different cell types enabling the identification of cell types and cancer states. Using these arrays we could differentiate between isogenic normal, cancer and metastatic cell types using only ∼5000 cells.
Introduction
Early detection of cancer enhances the likelihood of effective therapy.1 Cancerous cells present cell surface features that can be distinguished from normal cells,2,3 but the identification of different cell types based on subtle differences in cellular signatures remains challenging in cancer therapy.4Existing cancer detection methods that exploit cell surface recognition5 use antibody arrays,6 and focus on biomarkers present on the cell surface.7 In spite of the success of antibody-based approaches for cancer detection,8 many tumor cells lack apparent biomarkers that can be used either individually or in combination for diagnosis.9 “Chemical-nose” based approaches on the other hand involve the differential binding interactions of analytes with a sensor array featuring selective receptors.10 The potential of this method has been demonstrated in the detection of metal ions,11 volatile agents,12 aromatic amines,13 amino acids,14 carbohydrates,15 and proteins.16 In our recent group studies, the “chemical nose” approach has successfully been exploited to identify proteins,17,18 bacteria19 and mammalian cells.20 Reported strategies of cancer detection based on fluorescent polymers possess the challenges of polymer aggregation, low fluorescence intensity and low quantum yield.
Recently, we were able to detect and differentiate isogenic normal and cancerogenic cell lines stemming from BALB/c mice using conjugated polymer/gold nanoparticle constructs.20 While these constructs were quite selective in their differentiation of cancerous from non-cancerous cells, their limit of detection was higher than 20![[thin space (1/6-em)]](https://www.rsc.org/images/entities/char_2009.gif) 000 cells, making it a challenge for real world applications based on cytometry or biopsy. We herein describe a method that uses green fluorescent protein (GFP) as a negatively charged fluorophore that possesses high quantum yield, low aggregation and high sensitivity. Employing NP-GFP21 based arrays we have developed an efficient cancer cell detection strategy based on the cell surface to probe physicochemical (i.e. charge and hydrophobicity) differences between cell types.22,23 We demonstrate that this synthetic-biomolecular sensor can discern different cell types at levels as low as 5000 cells, a four-fold enhancement in sensing efficiency.
000 cells, making it a challenge for real world applications based on cytometry or biopsy. We herein describe a method that uses green fluorescent protein (GFP) as a negatively charged fluorophore that possesses high quantum yield, low aggregation and high sensitivity. Employing NP-GFP21 based arrays we have developed an efficient cancer cell detection strategy based on the cell surface to probe physicochemical (i.e. charge and hydrophobicity) differences between cell types.22,23 We demonstrate that this synthetic-biomolecular sensor can discern different cell types at levels as low as 5000 cells, a four-fold enhancement in sensing efficiency.
Results and discussion
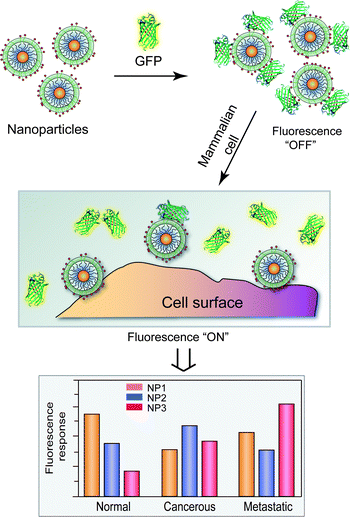
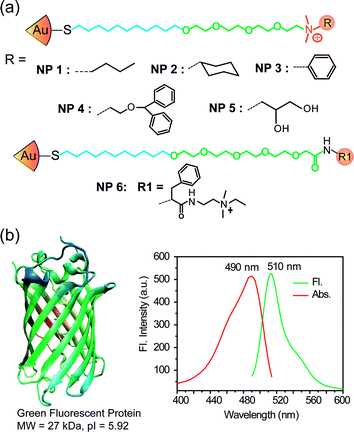
The present sensor design involves non-covalent conjugates between structurally related gold nanoparticles (NPs) 1–6 and green fluorescent protein (GFP) (Fig. 2) bearing complementary charges. GFP acts as a fluorescence indicator and possesses excitation and emission maxima at 490 nm and 510 nm respectively.24GFP, being negatively charged (pH 7.4), binds efficiently to positively charged gold NPs 1–6 quenching its fluorescence. In the presence of mammalian cells, the binding equilibrium between GFP and NPs would be altered due to competitive binding between NP-GFP complexes and cells. The cell surfaces bind electrostatically to NPs, resulting in displacement of the GFP from NP-GFP complexes. Selective displacement of GFP by these analytes restores fluorescence, transducing the binding event in a “turn on” fashion (Fig. 1). The differential interactions between NPs and cell surfaces generates fluorescence patterns characteristic of each cell type (Fig. 1), enabling us to discern normal and cancerous cells based on the physicochemical properties of the cell surfaces.
 | ||
| Fig. 1 Schematic illustration of competitive binding between the quenched NP-GFP complexes and a cell surface. | ||
We employed six cationic gold nanoparticles (NP1–NP6, Fig. 2) to create the sensor array. The particle functionality tunes the NP–GFP and NP–cell surface interactions resulting in differential physical responses. The particles vary in hydrophobicity, hydrogen bonding ability and aromatic recognition unit. The array of NP-GFP complexes was generated by mixing appropriate stoichiometries (obtained from Table S1†) of NPs and GFP (100 nM) in 5 mM sodium phosphate buffer (pH 7.4).
 | ||
| Fig. 2 (a) Molecular structures of the nanoparticles (NPs); (b) structure of green fluorescent protein (GFP), excitation and fluorescence spectra of GFP. | ||
Fluorescence titration assesses the complexation between GFP and the cationic NPs. The fluorescence of GFP was quenched (Fig. S1†) upon the addition of NPs. The absorption effect of the gold cores was small and assessed through control experiments using neutral particles.25 The complex stability constants (Ks) and association stoichiometries (n) were computed through nonlinear least-squares curve-fitting analysis26 (Table S1†), demonstrating that subtle structural changes of NP head groups affected their affinities for GFP.
The initial fluorescence intensities of the quenched complexes were measured at 510 nm (200 μL of NP-GFP in 96-well plate). The complexes were incubated with different cell types in six replicates. The changes in fluorescence were recorded and analyzed by LDA.27 The increased fluorescence intensities are due to displacement of GFP from the complexes whereas residual quenching of fluorescence by cell surfaces results in a decrease in fluorescence intensity. Stepwise analysis with different NP set(s) gives separability of each combination, allowing determination of the optimal particle set (Fig. S2†). We observed the maximum differentiation grouping using 3 nanoparticles (NP2, NP3, NP6) in the present study.
Detection of different cancer cell types
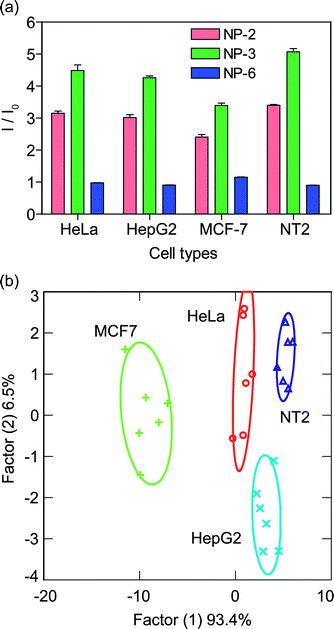
As a preliminary test of our method, we discriminated four types of human cancer cells: HeLa (cervical), HepG2 (liver), MCF-7 (breast) and NT2 (testis) (Table 1). These cancer cell lines (5000 cells per sample) possessing different cell surface properties generated distinct fluorescence patterns as shown in Fig. 3a when incubated with the NP-GFP complexes. After LDA analysis, three canonical factors were generated (93.4%, 6.5% and 0.1%). The two larger canonical factors are plotted as shown in Fig. 3b. In canonical plots, the cell types against the NP-GFP sensor array are clustered into four distinct groups according to cell type with no overlap between the 95% confidence ellipses (Fig. 3b). The 24 training cases (4 cell lines × 6 replicates) can be separated with 100% accuracy according to a jackknifed classification matrix. | ||
| Fig. 3 Differentiation of cell types based on cell surfaces: (a) change in fluorescence intensities (mean of six replicates) for four different cancer cell lines using NP-GFP supramolecular complexes; (b) canonical plots of discriminant scores with 95% confidence ellipses for all obtained data points against different mammalian cell types. | ||
Detection of isogenic cell types
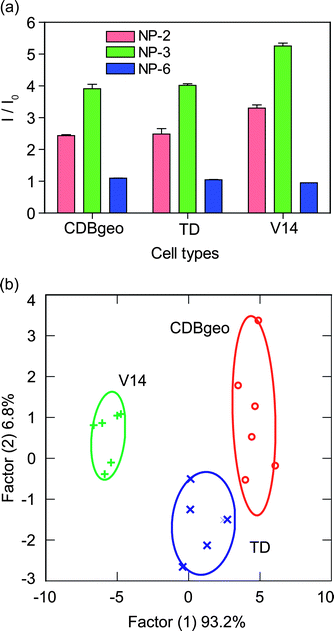
The discrimination of isogenic cells is a particularly challenging task for sensory systems as isogenic cells lack the differences that are imparted onto their surfaces by genetic diversity. Therefore, isogenic cells are important testbeds for sensor validation. After successful discrimination of different cancer cells obtained from different organs, we applied GFP-NP constructs to isogenic cell lines: CDBgeo, TD, and V14, which are normal, cancerous and metastatic cells respectively (Table 1). The cells were obtained from the same mammary organs of BALB/c mice, and therefore possess the same genotypic background. CDBgeo cells are normal breast epithelial cell lines.28 The cancerous TD cells were prepared by treating CDBgeo cells with 10 ng mL−1 of TGF-β for 14 days leading to epithelial to mesenchymal transformation causing tumorigenic nature. The V14 cell lines lack p53 protein and form aggressive tumors that are locally invasive and metastatic in mice.29Fig. 4a presents the change in fluorescence intensities of three isogenic cell types towards the NP-GFP complexes. LDA classifies the response pattern into distinct clusters with two canonical factors containing 93.2 and 6.8% of the variance, with a 94% identification accuracy among these isogenic cell types (Fig. 4b).
 | ||
| Fig. 4 Detection of isogenic cell types using cell surfaces: (a) change in fluorescence intensities (mean of six replicates) for three cell lines of the same genotypic background using NP-GFP complexes; (b) canonical plots of discriminant scores for all obtained data points against the isogenic cell types. | ||
These results indicate the efficacy of the present sensing strategy to differentiate between different cancer cell types and cancer states based on their surface properties. The detection limit of this method using cell surface properties was found to be ∼5000 cells.
It is to be noted that the LDA analysis using NP3 alone results in the differentiation of only 75 and 72% for different cancer cells and isogenic cells respectively (see Fig. S2†). Similarly, LDA analysis using NP2 and NP3 together gives the differentiation of only 83 and 67% for different cancer cells and isogenic cells respectively (see Fig. S2†). Although, visually a modest change in fluorescence for NP6 was observed as shown in Fig. 3 and 4, this minor and statistically significant difference in fluorescence for NP6 is responsible for 100% differentiation among different cell types, and possessed significant differentiation power (83–89%) on its own.
To validate the detection efficiency of our system, we performed tests to identify unknown samples from random cells chosen from the training set. The cells were added to NP-GFP solutions and fluorescence change was subjected to LDA analysis. The new cases are classified into groups that are generated through the training matrix according to their shortest Mahalanobis distances from respective groups. We observed 96% accuracy (23 of 24) of 24 unknown samples of the cell types.
Conclusions
We have fabricated a “chemical nose” based NP-GFP array biosensor that can effectively identify and differentiate several types of mammalian cancer cells. The sensor array efficiently discriminates normal, cancerous and metastatic isogenic cells. The use of GFP as the reporter fluorophore provides a four-fold enhancement of sensitivity relative to prior NP-polymer sensors.20 This sensor was highly successful at differentiating single cell states. Clearly differentiation of cells in heterogeneous mixtures remains a challenge. Further improvement in the design of sensor arrays and data analysis techniques, however, provides the potential for clinical applications of this methodology.Experimental section
Materials and methods
Nanoparticle syntheses have been reported previously.21Expression of GFP and spectral characterization
Green fluorescence protein (GFP) was expressed according to the reported procedure.30 Briefly, starter cultures from a glycerol stock of GFP [enhanced GFP (EGFP) was cloned into the pET21d vector (Novagen) where 6 × His tag is located at N-terminus] in BL21(DE3) were grown overnight in 50 mL of 2xYT media (16 g tryptone, 10 g yeast extract, 5 g NaCl in 1 L water) with 50 μL of 100 mg mL−1 ampicillin sodium salt at a final concentration of 100 μg mL−1. The cultures were shaken overnight at 250 rpm at 37 °C. On the following day, 5 mL of the cultures was added to a Fernbach flask containing 1 L of 2xYT and 1 mL 1000× ampicillin and the flask was shaken until the OD600 reached ∼0.7. The culture was then induced by adding IPTG (1 mM final concentration) and shaking at 28 °C. After three hours, the cells were harvested by centrifugation (5000 rpm for 15 min at 4 °C). The pellet was then resuspended in lysis buffer (2 mM imidazole, 50 mM NaH2PO4, 300 mM NaCl). The cells were lyzed using a microfluidizer and once lyzed, the solution was spun down at 15![[thin space (1/6-em)]](https://www.rsc.org/images/entities/char_2009.gif) 000 rpm for 45 min at 4 °C. The supernatant was further purified using HisPur Cobalt columns from Pierce (cat. Number 89969).
000 rpm for 45 min at 4 °C. The supernatant was further purified using HisPur Cobalt columns from Pierce (cat. Number 89969).
Cell culture
All the cells except MCF10A, CDBgeo, TD and V14 were grown in DMEM media supplemented with 10% FBS and 1% antibiotics in T75 flasks. The NT2 cell line was obtained from Prof. R. Thomas Zoeller. CDBgeo, TD and V14 cells were grown in DMEM-F12 media supplemented with 2% ABS, 25mM HEPES, 10μg mL−1 insulin, 5 ng mL−1 EGF and 15 μg mL−1 gentamicin. Cells were washed with DPBS buffer, trypsinized with 1X trypsin and collected in the DMEM media.Cell sensing studies
NP-GFP conjugates were generated by mixing appropriate stoichiometries (Table S1†) of nanoparticles and GFP (100 nM) in 5 mM sodium phosphate buffer (pH 7.4). Then, 200 μL of each solution was loaded into 96-well plates and initial fluorescence intensities of quenched complexes were measured at 510 nm. These complexes were then incubated with different 5000 cells (Table 1) to determine the changes in fluorescence of NP-GFP. The unique fluorescence response patterns were plotted as the ratio of final and initial fluorescence of the NP-GFP mixture.LDA analysis
The raw data matrix was processed using classical linear discriminant analysis (LDA) in SYSTAT (version 11.0).31,32 In LDA, all variables were used in the model (complete mode) and the tolerance was set as 0.001. The raw fluorescence response patterns were transformed to canonical patterns where the ratio of between-class variance to the within-class variance was maximized according to the pre-assigned grouping. In a blind experiment, the rates of fluorescence patterns of a new case were first converted to canonical scores using discriminate functions established on training samples. The Mahalanobis distance33,34 is the distance of a case to the centroid of a group in a multidimensional space and was calculated for the new case to the centroid of respective groups (normal or cancerous or metastatic cells) of training samples. The new case was assigned to the group with the shortest Mahalanobis distance. This processing protocol was performed on the SYSTAT 11 program, allowing the assignment of cells to specific groups.Acknowledgements
This work was supported by the NSF Center for Hierarchical Manufacturing at the University of Massachusetts Nanoscale Science and Engineering Center (NSEC, DMI-0531171), the NSF (V.M.R., CHE-0808945), and the NIH (GM077173).Notes and references
- K. Pantel, R. H. Brakenhoff and B. Brandt, Nat. Rev. Cancer, 2008, 8, 329 CrossRef CAS.
- M. Stroh, J. P. Zimmer, D. G. Duda, T. S. Levchenko, K. S. Cohen, E. B. Brown, D. T. Scadden, V. P. Torchilin, M. G. Bawendi, D. Fukumura and R. K. Jain, Nat. Med., 2005, 11, 678 CrossRef CAS.
- P. R. Srinivas, B. S. Kramer and S. Srivastava, Lancet Oncol., 2001, 2, 698 CrossRef CAS.
- X. Gao, Y. Cui, R. M. Levenson, L. W. K. Chung and S. Nie, Nat. Biotechnol., 2004, 22, 969–976 CrossRef CAS.
- (a) G. Zheng, F. Patolsky, Y. Cui, W. U. Wang and C. M. Lieber, Nat. Biotechnol., 2005, 23, 1294 CrossRef CAS; (b) M. Ogawa, N. Kosaka, M. R. Longmire, Y. Urano, P. L. Choyke and H. Kobayashi, Mol. Pharmaceutics, 2009, 6, 386 CrossRef CAS; (c) X. Qian, C.-H. Peng, D. O. Ansari, Q. Yin-Goen, G. Z. Chen, D. M. Shin, L. Yang, A. N. Young, M. D. Wang and S. Nie, Nat. Biotechnol., 2008, 26, 83 CrossRef CAS; (d) S. Mallidi, T. Larson, J. Tam, P. P. Joshi, A. Karpiouk, K. Sokolov and S. Emelianov, Nano Lett., 2009, 9, 2825 CrossRef CAS; (e) R. L. Orndorff and S. J. Rosenthal, Nano Lett., 2009, 9, 2589 CrossRef CAS.
- R. D. Petty, M. C. Nicolson, K. M. Ker, E. Collie-Duguid and G. I. Murray, Clin. Cancer Res., 2004, 10, 3237 CrossRef CAS.
- J. Jen, L. Wu and D. Sidransky, Ann. N. Y. Acad. Sci., 2000, 906, 8 CAS.
- C. Wingren and C. A. Borrebaeck, Curr. Opin. Biotechnol., 2008, 19, 55 CrossRef CAS.
- M. Sanchez-Carbayo, Clin. Chem., 2006, 52, 1651 CrossRef.
- C. Borrebaeck, Expert Opin. Biol. Ther., 2006, 6, 833 Search PubMed.
- J. W. Lee, J. S. Lee, M. Kang, A. I. Su and Y. T. Chang, Chem.–Eur. J., 2006, 12, 5691 CrossRef CAS.
- N. A. Rakow and K. S. Suslick, Nature, 2000, 406, 710 CrossRef CAS.
- N. T. Greene and K. D. Shimizu, J. Am. Chem. Soc., 2005, 127, 5695 CrossRef CAS.
- (a) J. F. Folmer-Andersen, M. Kitamura and E. V. Anslyn, J. Am. Chem. Soc., 2006, 128, 5652 CrossRef CAS; (b) A. Buryak and K. Severin, J. Am. Chem. Soc., 2005, 127, 3700 CrossRef CAS.
- J. W. Lee, J. S. Lee and Y. T. Chang, Angew. Chem., Int. Ed., 2006, 45, 6485 CrossRef CAS.
- A. T. Wright, Z. Zhong and E. V. Anslyn, Angew. Chem., Int. Ed., 2005, 44, 5679 CrossRef CAS.
- C. C. You, O. R. Miranda, B. Gider, P. S. Ghosh, I. B. Kim, B. Erdogan, S. A. Krovi, U. H. Bunz and V. M. Rotello, Nat. Nanotechnol., 2007, 2, 318 CrossRef CAS.
- O. R. Miranda, C.-C. You, R. Phillips, I.-K. Kim, P. S. Ghosh, U. H. F. Bunz and V. M. Rotello, J. Am. Chem. Soc., 2007, 129, 9856 CrossRef CAS.
- R. L. Phillips, O. R. Miranda, C. C. You, V. M. Rotello and U. H. F. Bunz, Angew. Chem., Int. Ed., 2008, 47, 2590 CrossRef.
- A. Bajaj, O. R. Miranda, I.-B. Kim, R. L. Phillips, D. J. Jerry, U. H. F. Bunz and V. M. Rotello, Proc. Natl. Acad. Sci. U. S. A., 2009, 106, 10912 CrossRef CAS.
- M. De, S. Rana, H. Akpinar, O. R. Miranda, R. Arvizo, U. H. F. Bunz and V. M. Rotello, Nat. Chem., 2009, 1, 461 Search PubMed.
- S. J. Singer and G. L. Nicolson, Science, 1972, 175, 720 CrossRef CAS.
- B. Alberts, A. Johnson, J. Lewis, M. Raff, K. Roberts and P. Walker, Molecular Biology of the Cell, Taylor & Francis, New York, 4th edn, 2002 Search PubMed.
- R. Y. Tsien, Annu. Rev. Biochem., 1998, 67, 509 CrossRef CAS.
- A. Aguila and R. W. Murray, Langmuir, 2000, 16, 5949–5954 CrossRef CAS.
- C.-C. You, M. De, G. Han and V. M. Rotello, J. Am. Chem. Soc., 2005, 127, 12873 CrossRef CAS.
- Linear discriminant analysis (LDA) using SYSTAT software (version 11) was used to classify the data set. LDA maximizes the ratio of between-class variance to the within-class variance in any particular data set, thereby enabling maximal separability. In the further experiments, canonical factors were generated that are a linear combination of response matrices obtained from fluorescence response patterns (3 NP-GFP conjugates × 4 cell lines × 6 replicates).
- M. A. Deugnier, M. M. Faraldo, J. Teuliere, J. P. Thiery, D. Medina and M. A. Glukhova, Dev. Biol., 2006, 293, 414 CrossRef CAS.
- A. C. Blackburn, S. C. McLary, R. Naeem, J. Luszcz, D. W. Stockton, L. A. Donehower, M. Mohammed, J. B. Mailhes, T. Soferr, S. P. Naber, C. N. Otis and D. J. Jerry, Cancer Res., 2004, 64, 5140 CrossRef CAS.
- M. De, S. Rana and V. M. Rotello, Macromol. Biosci., 2009, 9, 174 CrossRef CAS.
- SYSTAT11.0, SystatSoftware, Richmond, CA 94804, USA, 2004 Search PubMed.
- P. C. Jurs, G. A. Bakken and H. E. McClelland, Chem. Rev., 2000, 100, 2649 CrossRef CAS.
- P. C. Mahalanobis, Proc. Natl. Inst. Sci. India, 1936, 2, 49 Search PubMed.
- R. Gnanadesikan and J. R. Kettenring, Biometrics, 1972, 28, 81 CrossRef.
Footnote |
| † Electronic supplementary information (ESI) available: NP-GFP binding studies and jackknifed classification matrix. See DOI: 10.1039/c0sc00165a/ |
| This journal is © The Royal Society of Chemistry 2010 |
