On-line preconcentration and in situ photochemical vapor generation in coiled reactor for speciation analysis of mercury and methylmercury by atomic fluorescence spectrometry†
Ying
Gao
a,
Wulin
Yang
b,
Chengbin
Zheng
a,
Xiandeng
Hou
*ab and
Li
Wu
*b
aCollege of Chemistry, Sichuan University, Chengdu, Sichuan 610064, China. E-mail: houxd@scu.edu.cn
bAnalytical & Testing Center, Sichuan University, Chengdu, Sichuan 610064, China. E-mail: scuwl@163.com
First published on 11th November 2010
Abstract
On-line preconcentration and in situ photochemical vapor generation in a coiled reactor was proposed for speciation analysis of ultratrace mercury and methylmercury (Hg2+ and MeHg+) by using atomic fluorescence spectrometric detection. Diethyldithiocarbamate (DDTC) served here not only as a chelating reagent to form hydrophobic compound of mercury for on-line preconcentration but also as a reductant for in situ photochemical vapor generation and desorption of mercury from the coiled reactor. Optimum conditions for on-line preconcentration and in situ photochemical vapor generation, as well as potential speciation analysis of Hg2+ and MeHg+, were carefully investigated. Limit of detection (LOD, 3σ) of 0.004 μg L−1 or 0.0008 μg L−1 for Hg2+ was obtained based on 40 s or 200 s of sample loading time, respectively, and it can be further improved by prolonging the sample loading time when necessary. The linear working range was in the range of 0.02–8 μg L−1 with 40 s sample loading time. A precision of 4.5% RSD was achieved with mercury concentration of 2 μg L−1. The proposed method can be applied for rapid speciation analysis of Hg2+ and MeHg+ by controlling the desorption and photochemical vapor generation conditions. The accuracy of the proposed method was evaluated by analysis of certified reference materials including water samples (GBW 080392 and GBW 080393), fish muscle (GBW 10029), and human hair (GBW 09101b), as well as National Research Council Canada DORM-2 fish muscle tissue. This is a simple, ultrasensitive and relatively green method for the determination of mercury and methylmercury.
1. Introduction
Accurate determination of mercury and methylmercury (Hg2+ and MeHg+) in many cases can be challenging because of extremely low content and potentially complicated matrix. Therefore, preconcentration and/or separation of the analytes prior to measurement are frequently required even when using highly sensitive detection systems.1–3 Although off-line preconcentration methods are powerful and effective, they commonly bring in several shortcomings including time/reagent-consuming, tedious sample workup, and potential contamination or analyte loss from batch operations. On-line preconcentration approaches are desired, since they provide many advantages over off-line techniques such as rapid analysis and ease of operation,4–6 among which on-line knotted reactor (KR) preconcentration technique has intrigued much attention for the determination of trace elements7–9 because of low cost, easy automation and high sample throughput.It is well known that the sensitivity of analytical atomic spectrometry can be increased by improving sample introduction efficiency. Chemical vapor generation (CVG) as a sample introduction method has been widely used in analytical atomic spectrometry mainly owning to its high efficiency of sample introduction and efficient matrix separation. Among CVG techniques, hydride generation (HG) using tetrahydroborate (THB)–acid system enjoys the greatest popularity because of its fast reaction and high yield, as well as easy implementation.10 Therefore, combination of on-line KR technique with HG provides remarkable improvement of detection sensitivity.7,11 On the other hand, HG using THB-acid system would bring some inevitable problems, for instance, relatively expensive and unstable reagents, serious interferences from transition elements and potential contamination from large consumption of reagents. Photochemical vapor generation (PVG) is a promising technique to solve these problems.12,13 In addition to the advantages of HG,14,15PVG has several unique features including possible speciation analysis, cost-effectiveness, relatively green nature and potentially interference-free analytical methods, as well as wide range of detectable elements (nonmetals, transition and noble metals).16–18
The purpose of this work is to combine the on-line preconcentration with in situPVG to improve detection sensitivity and implement automation for the speciation analysis of ultratrace elements. The combined technique was expected to integrate the elution and the subsequent PVG procedure into one single step for faster analysis and less consumption of reagents. Mercury was used as a model analyte to react with diethyldithiocarbamate (DDTC) for formation of hydrophobic compound that can be on-line pre-concentrated and subsequently in situ converted into cold vapor on the inner surface of the coiled PTFE tubing with UV irradiation. Finally, the cold vapor was transported into an atomic fluorescence spectrometer (AFS) for detection. It is worthwhile to note that DDTC served not only as a chelating reagent for generation of the hydrophobic compound, but also as a reductant for PVG and to desorb mercury from the inner surface of the reactor. The application of this method in speciation analysis of Hg2+ and MeHg+ was also explored.
2. Experimental section
2.1 Reagents
All reagents used were of analytical grade or better. A 1000 mg L−1 stock solution of Hg2+ was purchased from the National Research Center for Standard Materials (NRCSM) of China. A 1000 mg Hg L−1MeHg+ stock solution was prepared by dissolving chloride methylmercury (Dr Ehrenstorfer, Augsburg, Germany) in methanol. Working standard solutions were prepared daily by stepwise dilution of the stock solution with 0.005 mol L−1HCl. The solution of chelating reagent was prepared by dissolving dethyldithiocarbamate (DDTC) (Sinopharm Chemicals Reagent Co., Shanghai, China) in doubly distilled water (DDW). The pH of solutions was adjusted by using 0.1 mol L−1HCl or 0.1 mol L−1NaOH solutions.Several certified reference materials from National Research Center for Standard Materials (NRCSM, Beijing, China), including GBW 10029 (tuna fish), GBW 09101b (human hair), GBW (E) 08392 (natural water) and GBW (E) 08393 (natural water), DORM-2 (dogfish) from the National Research Council Canada (NRCC, Ottawa, Canada), a commercial bottle water and a tap water sample, were analyzed by the proposed method.
2.2 Instrumentation
A system of on-line preconcentration and in situPVG was constructed by integrating a coiled reactor (CR) and flow-through photo-reactor (Fig. 1). A low-pressure Hg vapor UV lamp (15 W, Philips Co., Holland) wrapped with a poly(tetrafluoroethylene) (PTFE) tube (400 cm length, 1.8 mm i.d. × 2.8 mm o.d.) was employed as both the CR and the photo-reactor. The photo-reactor was placed in a black box, which served to protect skin and eyes of operators from UV radiation. A model 2202E non-dispersive AFS instrument (Beijing Haiguang Instrument Co., Beijing, P. R. China) fitted with an intermittent flow system was used throughout the experiment for the detection of mercury atomic fluorescence. The AFS instrument can work in peak area mode or peak height mode. For peak area mode, the signal response is not only related to the concentration of analytes but also to the sample loading volume. The sensitivity for elements determination can be obviously improved with increasing sample loading volume. For peak height mode, however, the signal intensity is totally dependent on the concentration of analyte in sample solution; and it is usually used in continuous flow system. In order to enhance the detection sensitivity, peak area mode was used with maximal signal recording time of 20 s. To achieve the aim of continuous analysis mode for fast visual speciation analysis, a SK-2003A continuous flow mode AFS instrument (Bejing Jinsuokun Technology Developing Limited Co., Beijing, P. R. China) with the maximal recording time of 1200 s was used for the speciation analysis of Hg2+ and MeHg+. Operating parameters for the two types of AFS instruments include: high voltage for photomultiplier tube, −250 V; observation height, 8 mm; carrier gas flow rate, 500 mL min−1; shield gas flow rate, 1000 mL min−1; sample flow rate, 8 mL min−1 and current of Hg hollow cathode lamp, 30 mA for 2202-E and 25 mA for SK-2003A, respectively.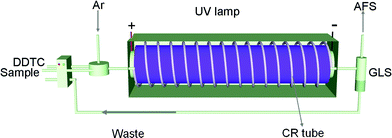 | ||
| Fig. 1 Schematic diagram of the experimental set-up, gas/liquid separator (GLS). | ||
2.3 Sample preparation
The sonication-assisted acid leaching procedure was used to liberate Hg2+ and MeHg+ from biological certified reference materials.19 Briefly, 0.2 g sample was accurately weighed into a 50 mL plastic centrifuge tube and 5 mL 5.0 mol L−1HCl solution was added. The centrifuge tube was put in a water bath for 30 min sonication at room temperature. After centrifugation at 4000 rpm for 10 min, the supernatant was transferred to a precleaned 100 mL volumetric flask and pH adjusted using NaOH solution before analysis. Water samples were diluted and pH adjusted directly prior to determination. A sample blank was processed accordingly.2.4 Analytical procedure
The programmable operation procedures are given in Table 1. For on-line preconcentration, the Hg-DDTC complex was on-line formed by mixing sample solution with 0.1% (m/v) DDTC. The complex was then propelled through the tubing and thus absorbed on its inner wall due to the hydrophobic interaction between the Hg-DDTC complex and the hydrophobic surface of the PTFE tubing, by using a peristaltic pump along with the assistance of the argon flow. Subsequently, DDW was passed through the tubing to remove soluble components. For in situPVG and desorption, 2% (m/v) DDTC solution as reductant, together with Ar flow, was pumped into the tubing and irradiated by UV light for the generation of Hg0 and consequent desorption from the inner wall. The solution was flushed to the gas/liquid separator and then mercury vapor was rapidly separated and swept into the AFS instrument by Ar flow for measurement. The tubing was washed by 40% (v/v) ethanol together with UV radiation to eliminate any residue in the tube. Finally, DDW was introduced to remove the remaining ethanol and get ready for the next measurement.| Step | Procedure | Time/s | Function |
|---|---|---|---|
| 1 | Preconcentration | 40 | The reactor tube is flushed with the mixture of Hg2+ and 0.1% (m/v) DDTC. |
| 2 | Rinse | 10 | The tube is rinsed with DDW to clean out soluble co-existed components. |
| 3 | Desorption | 35 | The tube is rinsed with 2% (m/v) DDTC and irradiated with UV for PVG. |
| 4 | Clean | 80 | The tube is washed with 40% (v/v) ethanol and irradiated with UV. |
| 5 | Clean | 10 | The tube is rinsed with DDW for next measurement. |
2.5 Safety precaution
Mercury cold vapor, Hg2+ or MeHg+ is very toxic. Essential safety precautions must be taken during all manipulations and a well-ventilated hood used.3. Results and discussion
3.1 On-line preconcentration and in situPVG for determination of Hg2+ by AFS
Although PVG has many advantages, the sensitivity may not be satisfactory for accurate determination of ultratrace level elements in some cases because of low PVG efficiencies and complex matrix. A preconcentration step for enrichment of analyte prior to PVG is therefore frequently needed to overcome this problem. However, conventional preconcentration techniques involve two independent steps (adsorption and desorption steps) prior to CVG, and this makes the whole analytical method too tedious and complicated. We herein aimed to integrate the advantages of on-line preconcentration and in situPVG in order to minimize consumption of reagents and reduce analysis time. To achieve this purpose, it is significant to select a suitable reagent that acts not only as a chelating reagent to form hydrophobic compound with analyte for on-line preconcentration but also as a reductant to reduce analytes to their volatile species for simultaneous desorption and in situPVG. Low molecular weight organic compounds (most often low molecular weight organic acids and HOCH2CH2SH)20,21 used as reductants in previous PVG systems cannot be adopted to realize this aim, because they cannot react with analyte to form hydrophobic compound for preconcentration. DDTC and APDC are frequently used as chelating reagents for preconcentration of metal ions, so they are selected to evaluate their capability for PVG of mercury in this work. Initial quick experimental results showed that DDTC could significantly improve the PVG efficiency of mercury, while no significant signal was detected in the case of ADPC. Therefore, DDTC was selected as both a chelating reagent and a reductant for further experiments.The coiled reactor used in this work is a simplified knotted reactor as depicted in Fig. 1. Due to changes of the flow direction caused by the knots, the traditional KR could be used for efficient adsorption of metal complex based on the hydrophobic interaction. In spite of efficient adsorption, the poor light transmission limits the application of the traditional complicated knotted reactor in this in situPVG system. Apparently, the reactor used in this work should be of both good light transmission and high retention efficiency of analytes. Therefore, the traditional KR was simplified by coiling PTFE tubing tightly around the UV lamp without more complicated knotting, and it can also be called a coiled reactor. It was reported that less than 5% of the deep UV portion of irradiation energy is transmitted through the wall of the PTFE tubing, however, which was still sufficient for the photoreduction of mercury and selenium.21,22 Consequently, the decreased adsorption efficiency of this reactor was found due to the reduced contact between the analytes and the hydrophobic inner wall of the reactor.
To improve the retention efficiency of analyte by conventional single continuous sample injection preconcentration, Yan and his co-workers developed a novel flow injection on-line KR multiplexed sorption preconcentration.9 Enlightened by that method, we designed a new sample introduction system for improvement of the retention efficiency of the simplified KR. In contrast to introduction of air-flow after each divided sub-injection,9 an Ar flow on-line merged with sample solutions prior to injection and preconcentration in this work. As a result, the analytes could pass through the PTFE tube rapidly, and thus the sample loading time was significantly reduced. In addition to the improvement of retention efficiency of analyte (up to 64%), the linearity of signal intensity against sample loading time was extended because of efficient contact between analyte and the inner surface of the simplified KR. As shown in Fig. 2, the fluorescence intensity increased linearly with the sample loading time up to 400 s based on introduction of 0.5 μg L−1mercury at a sample flow rate of 8 mL min−1. Therefore, it is convenient to obtain the required sensitivity simply by changing the sample loading time, which determined the sampling volume. In consideration of optimum sample throughput, a preconcentration time of 40 s was chosen for subsequent experiments.
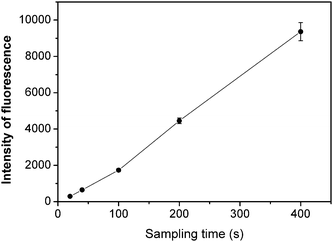 | ||
| Fig. 2 Effect of the sample loading time on the preconcentration of 0.5 μg L−1 of Hg2+. Experimental conditions: DDTC, 0.1%; argon flow rate, 500 mL min−1; and pH, 6.5. | ||
3.2 Optimization of experimental parameters for on-line preconcentration and in situPVG
Obviously, the analytical performance of the proposed system was not only strongly dependent on the efficiency of the on-line coiled reactor preconcentration but also on the efficiency of the followed in situPVG. Therefore, potential factors affecting these two processes should be investigated carefully.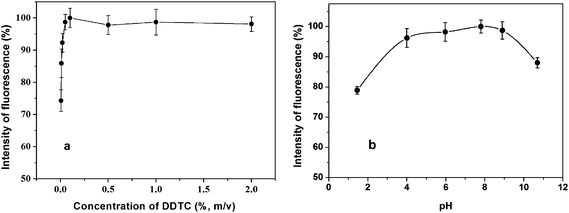 | ||
| Fig. 3 Effect of the concentration of DDTC, pH of the mixed solution of Hg2+ and DDTC on on-line preconcentration of Hg2+ from 2 μg L−1. a) Experimental conditions: pH, 6.5; and argon flow rate, 500 mL min−1. b) Experimental conditions: DDTC, 0.1%; and argon flow rate, 500 mL min−1. | ||
The pH of the solution significantly influences the formation of Hg-DDTC, and thus further affects the adsorption efficiency of analyte onto the reactor tube. Fixing the concentration of DDTC at 0.1% (m/v), 2 μg L−1Hg2+ was used to investigate the effect of pH of the mixed solution of Hg2+ and DDTC on signal response in the pH range of 1.4–11.0. Fig. 3b reveals the optimum pH range of 4.0–9.0. Low recovery may arise if the complex reaction of Hg2+ with DDTC occurs in a too acidic medium, as decomposition of Hg-DDTC may occur; or in a too basic solution, as the analyte may lose.23 Finally, pH 6.5 of mixed solution was chosen for use.
The argon carrier gas flow rate through the reactor tube and gas/liquid separator (GLS) is a basic parameter affecting the generation efficiency and adsorption efficiency of Hg-DDTC, sample throughput, the efficiency of gas-liquid separation and vapor transport, analyte concentration in the carrier gas, as well as analyte residence time during the atomization. The maximal signal intensity was observed at 500 mL min−1. Lower carrier gas flow rates may result in inefficient separation and transport of analyte from the GLS to AFS; higher flow rate may lead to significant dilution of analyte in carrier gas. Therefore, argon flow rate of 500 mL min−1 was selected for use.
The irradiation time was also investigated besides the number of lamp (Fig. 4). No signal can be detected in the absence of UV irradiation. Meanwhile, with the increased irradiation time, the mercury vapor was further photo-oxidized,25 thus the signal decreased beyond a 10 s irradiation time. This phenomenon implied that the PVG of mercury was accomplished very rapidly. Therefore, the volatile species should be transferred to the detector as rapidly as possible. An irradiation time of 10 s, corresponding to the minimum required time of sample solution for passing through the reactor tube, was selected for subsequent experiments for consideration of the balance between the PVG and the photo-oxidation.
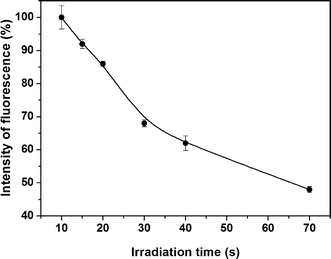 | ||
| Fig. 4 Effect of irradiation time on in situPVG of Hg2+ from 2 μg L−1. Experimental conditions: DDTC, 0.1%; argon flow rate, 500 mL min−1; and pH, 6.5. | ||
Here DDTC was not only used as a chelating agent but also as a reductant for in situPVG in this work. The effect of DDTC concentration on PVG efficiency was investigated in the range of 0.01% to 4%, as shown in Fig. 5. The signal was enhanced remarkably with increasing DDTC concentration in range of 0.01–2% (m/v) followed by a slight decrease, and 2% DDTC was chosen for use.
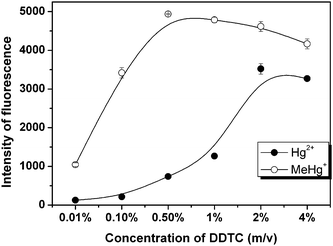 | ||
| Fig. 5 Effect of the concentration of DDTC on the photo-CVG of 4 μg L−1 of Hg2+ and 4 μg L−1 of MeHg+. | ||
Under the optimum operating conditions, the efficiency of PVG in DDTC system for Hg2+ was found to be 65% by comparison of response obtained from using the proposed system with that arising from use of conventional cold vapor generation system. PVG efficiency is usually lower than that by conventional CVGs for mercury.
3.3 Analytical figures of merit and sample analysis
Analytical figures of merit of the proposed method are summarized in Table 2. The retention efficiency of the proposed method was evaluated from a comparison of the relative concentration of analyte in the feed and waste solution after the sample was subjected to the reactor tube. 2 μg L−1 feed solution of Hg2+ was used and its waste solution was collected for analysis for residual Hg2+ for this purpose. The concentrations of mercury in both solutions were determined by conventional PVG-AFS without any preconcentration method. It was found that up to 64% retention efficiency could be achieved by using the proposed method. With 40 s loading time, the linear working range was from 0.02 to 8 μg L−1 with a linear correlation coefficient of 0.998. The limit of detection (LOD), defined as three times standard deviation of 11 measurements of a blank divided by slope of the calibration curve, was 0.004 or 0.0008 μg L−1with 40 s or 200 s loading time, respectively. It should be noted that the LOD could be further improved by increasing the sample loading time (thus increasing the sampling volume) when necessary. The LOD of the proposed technique compare favorably to those of ET-AAS or conventional CVG–AFS system after KR preconcentration, as summarized in Table 3.| Retention efficiency (%) | 64 |
| Sampling frequency (samples h−1) | 20 |
| Detection limit (3σ) (μg L−1) | |
| with 40 s of sample loading time | 0.004 |
| with 100 s of sample loading time | 0.002 |
| with 200 s of sample loading time | 0. 0008 |
| Regression equation (A, peak area of fluorescence intensity; C, concentration of standards, μg L−1; 5 standards) | A = 1271C + 16.65 |
| Correlation coefficient | 0.998 |
| Linear working range/μg L−1 | 0.02–8 |
| Precision (RSD, 2 μg L−1, n = 7) (%) | 4.5 |
Certified reference materials, mineral water and tap water sample were analyzed to evaluate the accuracy of the proposed method, with analytical results listed in Table 5. Direct on-line preconcentration and in situPVG of mercury in the certified reference material was not possible because of serious interferences of reduced Cr(III) by DDTC from the high concentration of K2Cr2O7 in the samples. This interference was successfully eliminated by using 0.1% (m/v) of EDTA as a masking reagent. A t-test showed that there are no significant differences between the analytical results obtained by the proposed method and the certified value at 95% confidence level. No detectable Hg2+ was found in the commercial mineral water and the tap water, and the recoveries of added mercury from these samples were found to be from 90% to 110%.
3.4 On-line preconcentration and potential speciation analysis of Hg2+ and MeHg+
The toxicity and bioavailability of mercury are largely dependent on its concentration and chemical form.32 Recently, many efforts have been expended to establish reliable and sensitive method for the determination of different mercury species. The most practical approach for speciation analysis of mercury is mainly to hyphenate powerful separation techniques to a sensitive detector, for example, liquid/gas chromatography or capillary electrophoresis coupled to inductively coupled plasma mass spectrometry (ICP-MS),33atomic absorption spectrometry (AAS),34AFS35 or UV spectrometry.36 Although these hyphenated techniques provided powerful ability for the speciation analysis of mercury, hyphenation always brings in time/reagent-consumption and potential destruction of analyte species. Therefore, sometimes non-chromatographic techniques have been desired for speciation of Hg2+ and MeHg+.37Initial experimental results showed that MeHg+ can be more easily converted into Hg0 with this proposed PVG scheme than Hg2+, particularly in reaction medium of low concentration of DDTC, as shown in Fig. 5. The reason is probably laid on the decomposition of MeHg+ yielding CH3 radicals under UV irradiation, which facilitates the conversion of MeHg+ to Hg0.38 An obvious signal from MeHg+ was observed with trace level DDTC and increased rapidly with increasing DDTC concentration within 0.5%. Although the maximal efficiency for Hg2+ was achieved with 2% DDTC, no detectable signal was obtained at DDTC concentration below 0.1%. Therefore, the speciation analysis of Hg2+ and MeHg+ can be realized by monitoring the concentration of DDTC. The analytical procedure is summarized as follows: (1) On-line preconcentration. Solutions of 0.1% DDTC and Hg2+/MeHg+ were separately introduced, on-line mixed, and then absorbed onto the inner surface of the reactor tube; (2) Determination of MeHg+. The UV lamp was turned on for 20 s after the residuals in the tube were swept away by a flow of Ar. Only MeHg+ could be reduced to its volatile species by the trace amount of free DDTC on inner wall of the tube, and was detected in this step; (3) Determination of Hg2+ and remaining MeHg+. The UV lamp was turned on again when 2% of DDTC solution was introduced into the tube and lasted for 25 s. The signal obtained during this step is from Hg2+ and the incomplete photo-reduced MeHg+ in Step 2. Then Hg2+ can be calculated and indirectly determined because concentration of MeHg+ was determined in Step 2; and (4) Clearing. The tube was rinsed with 40% ethanol and irradiated for 80 s by UV for elimination of the residual mercury species. Finally, the remaining ethanol may dissolve DDTC, and should be flushed out of the tube by DDW prior to next measurement. An SK-2003A continuous flow AFS instrument was used to further prove and visually show the feasibility of on-line preconcentration and speciation analysis of Hg2+ and MeHg+ by the proposed method, as shown in Fig. 6. The proposed method is of high sensitivity, simplicity, rapidness and non-chromatographic nature, thus minimizing many shortcomings of conventional hyphenated techniques.39
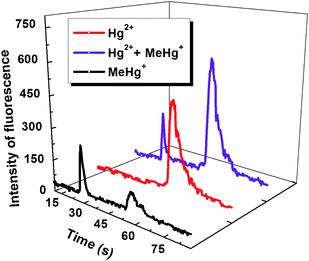 | ||
| Fig. 6 Typical signal profiles obtained from 2 μg L−1Hg2+, 2 μg L−1MeHg+, and 2 μg L−1Hg2+ + 2 μg L−1MeHg+. | ||
The proposed method was applied to speciation analysis of fish muscle (GBW 10029, and DORM-2) and human hair (GBW 09101b) for Hg2+ and MeHg+. Since co-existing ions might compete with mercury species in consumption of DDTC and adsorption on the inner surface of the reactor tube, 0.1% (m/v) EDTA was employed as a masking reagent for speciation analysis of mercury in biological samples. The analytical results of Hg2+ and MeHg+ in certified materials are summarized in Table 4. No significant difference was found between the determined and the certified values. Extracted solution of GBW 10029 was also spiked with 0.5 μg L−1Hg2+, and the recovery was found to be 104%.
| Sample | Added/μg L−1 | Detected b/μg L−1 | Certified/μg L−1 | ||||
|---|---|---|---|---|---|---|---|
| Hg2+ | MeHg+ | Hg2+ | MeHg+ | Hg2+ | MeHg+ | Total Hg | |
| a Concentration, μg g−1. b Mean ± SD, n = 3; nd, not detectable. | |||||||
| GBW (E) 080392 | — | — | 11.0 ± 0.8 | nd | 10 ± 0.5 | — | 10 ± 0.5 |
| GBW (E) 080393 | — | — | 104 ± 2.0 | nd | 100 ± 4 | — | 100 ± 4 |
| Mineral water | 0 | 0 | nd | nd | — | — | — |
| 0.05 | — | 0.045 ± 0.005 | — | — | — | — | |
| 0.2 | — | 0.21 ± 0.02 | — | — | — | — | |
| Tap water | 0 | 0 | nd | nd | — | — | — |
| 0.2 | — | 0.22 ± 0.02 | nd | — | — | — | |
| 0.5 | — | 0.52 ± 0.02 | nd | — | — | — | |
| DORM-2 | — | — | nd | 4.45 ± 0.27a | — | 4.47 ± 0.32a | 4.64 ± 0.26a |
| GBW 10029 | — | — | nd | 0.83 ± 0.03a | — | 0.84 ± 0.03a | 0.85 ± 0.03a |
| 0.5 | — | 0.52 ± 0.03 | 0.83 ± 0.03a | — | 0.84 ± 0.03a | — | |
| GBW 09101b | — | — | 0.24 ± 0.04a | 0.76 ± 0.05a | — | — | 1.06 ± 0.28a |
4. Conclusion
A novel analytical methodology using on-line coiled reactor preconcentration and in situPVG provides a simple, sensitive, cost-efficient, and reliable greener technology for the determination and speciation analysis of ultratrace levels of mercury. In the future, it is possible to integrate sampling, separation, enrichment and PVG procedure in a miniaturized device for the determination of mercury when using DDTC resin40 instead of DDTC solution. However, it remains to further explore the potential of this combination technique for determination and speciation analysis of trace/ultratrace levels of other PVG-forming elements, such as Sb, Se, Fe, and Ni.41,42Acknowledgements
The authors gratefully thank the National Natural Science Foundation of China (No.20835003 and No.20775051) for financial support of this project.References
- D. Kou and S. Mitra, Anal. Chem., 2003, 75, 6355–6360 CrossRef CAS.
- D. E. Raynie, Anal. Chem., 2006, 78, 3997–4003 CrossRef CAS.
- Y. Gao, P. Wu, W. Li, Y. Xuan and X. D. Hou, Talanta, 2010, 81, 586–590 CrossRef CAS.
- P. Wu, R. Liu, H. Berndt, Y. Lv and X. D. Hou, J. Anal. At. Spectrom., 2008, 23, 37–42 RSC.
- G. Daneshvar, A. Jabbari, Y. Yamini and D. Paki, J. Anal. Chem., 2009, 64, 602–608 CrossRef CAS.
- C. Puls and A. Limbeck, J. Anal. At. Spectrom., 2009, 24, 1434–1440 RSC.
- Y. Jin, H. Wu, Y. Tian, L. H. Chen, J. J. Cheng and S. P. Bi, Anal. Chem., 2007, 79, 7176–7181 CrossRef CAS.
- Y. Li, Y. Jiang, X. P. Yan and Z. M. Ni, Environ. Sci. Technol., 2002, 36, 4886–4891 CrossRef CAS.
- Y. Li, Y. Jiang, X. P. Yan, W. J. Peng and Y. Y. Wu, Anal. Chem., 2002, 74, 1075–1080 CAS.
- M. K. Sengupta and P. K. Dasgupta, Anal. Chem., 2009, 81, 9737–9743 CrossRef CAS.
- X. P. Yan, X. B. Yin, X. W. He and Y. Jiang, Anal. Chem., 2002, 74, 2162–2166 CrossRef CAS.
- X. M. Guo, R. E. Sturgeon, Z. Mester and G. J. Gardner, Anal. Chem., 2003, 75, 2092–2099 CrossRef CAS.
- X. M. Guo, R. E. Sturgeon, Z. Mester and G. J. Gardner, Anal. Chem., 2004, 76, 2401–2405 CrossRef CAS.
- Y. C. Sun, Y. C. Chang and C. K. Su, Anal. Chem., 2006, 78, 2640–2645 CrossRef CAS.
- M. Garcia, R. Figueroa, I. Lavilla and C. Bendicho, J. Anal. At. Spectrom., 2006, 21, 582–587 RSC.
- P. Grinberg, Z. Mester, R. E. Sturgeon and A. Ferretti, J. Anal. At. Spectrom., 2008, 23, 583–587 RSC.
- C. B. Zheng, R. E. Sturgeon and X. D. Hou, J. Anal. At. Spectrom., 2009, 24, 1452–1458 RSC.
- P. Grinberg and R. E. Sturgeon, Spectrochim. Acta, Part B, 2009, 64, 235–241 CrossRef.
- A. I. C. Ortiz, Y. M. Albarran and C. C. Rica, J. Anal. At. Spectrom., 2002, 17, 1595–1601 RSC.
- C. B. Zheng, L. Wu, Q. Ma, Y. Lv and X. D. Hou, J. Anal. At. Spectrom., 2008, 23, 514–520 RSC.
- Y. M. Yin, J. H. Qiu, L. M. Yang and Q. Q. Wang, Anal. Bioanal. Chem., 2007, 388, 831–836 CrossRef CAS.
- X. M. Guo, R. E. Sturgeon, Z. Mester and G. K. Gardener, Environ. Sci. Technol., 2003, 37, 5645–5650 CrossRef CAS.
- J. L. Parker and N. S. Bloom, Sci. Total Environ., 2005, 337, 253–263 CrossRef CAS.
- M. A. Vieira, A. S. Ribeiro, A. J. Curtius and R. E. Sturgeon, Anal. Bioanal. Chem., 2007, 388, 837–847 CrossRef CAS.
- J. D. Lalonde, M. Amyot, A. M. L. Kraepiel and F. M. M. Morel, Environ. Sci. Technol., 2001, 35, 1367–1372 CrossRef CAS.
- Y. Li, C. B. Zheng, Q. Ma, L. Wu, C. W. Hu and X. D. Hou, J. Anal. At. Spectrom., 2006, 21, 82–85 RSC.
- P. R. Aranda, P. H. Pacheco, R. A. Olsina, L. D. Martinez and R. A. Gil, J. Anal. At. Spectrom., 2009, 24, 1441–1445 RSC.
- K. Leopold, M. Foulkes and P. J. Worsfold, Anal. Chem., 2009, 81, 3421–3428 CrossRef CAS.
- J. L. Rodrigues, D. P. Torres, V. C. D. Souza, B. L. Batista, S. S. de Souza, A. J. Curtius and F. Barbosa, J. Anal. At. Spectrom., 2009, 24, 1414–1420 RSC.
- L. P. Yu and X. P. Yan, At. Spectrosc., 2004, 25, 145–153 CAS.
- J. C. A. de Wuilloud, R. G. Wuilloud, J. A. Gasquez, R. A. Olsina and L. D. Martinez, At. Spectrosc., 2001, 22, 398–404 CAS.
- I. Najera, C. C. Lin, G. A. Kohbodi and J. A. Jay, Environ. Sci. Technol., 2005, 39, 3116–3120 CrossRef CAS.
- J. Qvarnstrom, L. Lambertsson, S. Havarinasab, P. Hultman and W. Frech, Anal. Chem., 2003, 75, 4120–4124 CrossRef.
- Y. Li, Y. Jiang and X. P. Yan, Anal. Chem., 2006, 78, 6115–6120 CrossRef CAS.
- J. L. Gomez-Ariza, F. Lorenzo and T. Garcia-Barrera, J. Chromatogr., A, 2004, 1056, 139–144 CrossRef CAS.
- L. B. Xia, B. Hu and Y. L. Wu, J. Chromatogr., A, 2007, 1173, 44–51 CrossRef CAS.
- M. A. Vieira, P. Grinberg, C. R. R. Bobeda, M. N. M. Reyes and R. C. Campos, Spectrochim. Acta, Part B, 2009, 64, 459–476 CrossRef.
- J. A. Tossell, J. Phys. Chem. A, 1998, 102, 3587–3591 CrossRef CAS.
- H. Wu, Y. Jin, W. Y. Han, Q. Miao and S. P. Bi, Spectrochim. Acta, Part B, 2006, 61, 831–840 CrossRef.
- H. Emteborg, D. C. Baxter, M. Sharp and W. Frech, Analyst, 1995, 120, 69–77 RSC.
- C. B. Zheng, R. E. Sturgeon, C. S. Brophy, S. P. He and X. D. Hou, Anal. Chem., 2010, 82, 3899–3904 CrossRef CAS.
- L. W. Liu, H. Deng, L. Wu, C. B. Zheng and X. D. Hou, Talanta, 2010, 80, 1239–1244 CrossRef CAS.
Footnote |
| † This article is part of a themed issue highlighting outstanding and emerging work in the area of speciation. |
| This journal is © The Royal Society of Chemistry 2011 |
