Initial studies on quantitative DNA induced oxidation by gel electrophoresis (GE)-ICP-MS
Lucía Lopéz
Fernández
a,
María
Montes-Bayón
a,
Elisa Blanco
González
a,
L. María
Sierra
b,
Alfredo
Sanz-Medel
a and
Jörg
Bettmer
*a
aUniversidad de Oviedo, Dept. Química Física y Analítica, C/Julián Clavería 8, Oviedo, Spain. E-mail: bettmerjorg@uniovi.es; Fax: +34 985 103125; Tel: +34 985 103069
bUniversidad de Oviedo, Dept. Biología Funciona eIUOPA, C/Julián Clavería s/n, Oviedo, Spain
First published on 1st December 2010
Abstract
One of the most important consequences of oxidative stress is the induction of oxidation in DNA molecules. Permanent modification of genetic material resulting from “oxidative damage” incidents represents the first step involved in mutagenesis, carcinogenesis, and aging. Therefore, there is an urgent need for monitoring DNA oxidative damage in a quantitative way. For this purpose, the present work evaluates the use of gel electrophoresis (GE) on-line coupled to inductively coupled plasma-mass spectrometry (ICP-MS) to address induced oxidative events in plasmid DNA pBlueScript SK (2961 bp). Oxidative stress is induced in the samples by addition of Fe2+ and H2O2 through the Fenton reaction. After optimization of the set-up for large DNA fragments, the GE separation of the different oxidation products (as induced by the Fenton reaction) were followed by 31P+ monitoring with ICP-MS and compared with conventional slab gels. The main advantage with the proposed set-up is that the quantification of each resulting oxidation product could be performed using just an inorganic phosphate as internal standard.
Introduction
Over the past decade, there has been substantial interest in oxidative stress and its potential role in the development of disease-related pathophysiological complications in diabetes mellitus,1,2 atherosclerosis and associated cardiovascular disease,3,4 cancer5 and aging.6 “Oxidative stress” refers to an imbalance between the antioxidant defense systems and oxidant-generating systems. Among the oxidant species, the free radicals containing oxygen in the molecule, also called reactive oxygen species (ROS), are the most biologically relevant compounds.7 Normal cellular metabolism appears to be a primary source for endogenous ROS but various external events, such as exposure to ionising radiation, can lead to an increase in the generation of ROS.8,9 An increase in oxidative stress can have a profound effect on the modification of lipids and proteins, transcription, and cell function and metabolism. However, the availability of markers that can provide an accurate assessment of the degree of oxidative stress is still very limited. This has a special interest in clinical trials aimed at investigating the effectiveness of antioxidant therapies (e.g., with Se compounds) for preventing or reducing the risks of complications in prevalent diseases (e.g., diabetes mellitus).In this regard, the direct monitoring of ROS is extremely complicated due to their high reactivity and short-life times. Thus, a number of biomarkers that reflect the effect of such ROS in relevant biomolecules have been identified as useful indirect indexes of oxidative stress.10 Among them, the oxidation of DNA has been observed in numerous diseases, and as a result, it has been hypothesised that this damage plays an integral role in the aetiology of such diseases.11 Deoxyribonucleic acid is a particularly important target for oxidation, as damage may lead to heritable alterations.12 Consequently, DNA damage has been well studied, and several classes of products identified: base oxidation and resulting fragmentation products, and sugar fragmentation products. The oxidation of DNA bases, particularly the formation of 8-OH-guanine, is the first step that might continue to further DNA fragmentation.13 To combat the deleterious biological effect of the presence of 8-OH-guanine, cells have developed specific mechanisms to remove this lesion from cellular DNA.14 Thus, DNA-oxidation is normally evaluated by analysing the removed 8-OH-guanine metabolite that is excreted in urine. This can be conducted by means of gas chromatography with mass spectrometric detection (GC-MS),15 by liquid chromatography using electrochemical detection16,17 and, more recently, with mass spectrometric detection.18
However, it would be desirable to address initial oxidative damage on DNA before the oxidised bases are excised and metabolised as they correspond to the products of DNA repair.14 This is not an easy task since it implies the manipulation of DNA molecules (high molecular mass) for which conventional separation strategies (e.g. based on HPLC) are not ideal. Therefore, alternative systems have to be developed in order to isolate damaged DNA that can be independently quantified from the unmodified biomolecule. In this vein, the use of a modified gel electrophoresis system (GE) connected on-line to elemental detection via inductively coupled plasma mass spectrometry (ICP-MS) has been successfully tested for isolation of DNA ladders up to 1000 base pairs (bp).
ICP-MS has also been recognised as a suitable detector for the determination of (oligo-)nucleotides,19,20 their adducts with several chemicals,21–25 DNA fragments,26 entire DNA27,28 and DNA methylation.2931P+ detection has to be applied in the case that potential adducts do not contain any detectable heteroatom. ICP-MS detection of phosphorous is hampered by two phenomena: its high first ionisation potential (10.5 eV) that yields in a significant reduction of the ionisation efficiency and its numerous and abundant spectral interferences like 15N16O+, 14N16O1H+, and 12C1H316O+. Nevertheless, the use of double focussing (DF) ICP-MS devices has permitted the selective monitoring of P with acceptable detection limits (in the ng g−1 range).
In this work we demonstrate the feasibility of gel electrophoresis on-line coupled to ICP-MS as a quantitative tool for monitoring DNA oxidation. The proposed technique was already successfully applied to the quantitative analysis of metalloproteins,30 nanoparticles,31 and phosphorylated proteins32 and peptides,33 respectively. For studying the features of this system, a plasmid DNA has been selected as a model molecule. A plasmid is a DNA molecule that is separate from, and can replicate independently of, the chromosomal DNA. They are double stranded and they usually occur naturally in bacteria, but are sometimes found in eukaryotic organisms.34
Oxidation in plasmid DNA was induced by means of the Fenton reaction under different conditions and the resulting oxidated DNA species were determined. Depending on the oxidation conditions various structures of plasmid DNA could be observed and quantified. The proposed method provides quantitative DNA data referring to inorganic phosphate as an internal standard and could serve as an alternative tool in quantitative DNA studies.
Experimental
Reagents
All solutions were prepared using ultra-pure water (Milli-Q Water Purification System, Millipore, Bedford, MA, USA). Agarose SeaKem® LE was obtained from BioRad (Barcelona, Spain) and the DNA ladder 500 bp from Lonza (Barcelona, Spain). For the preparation of the buffer solutions ammonium acetate (Acros, Geel, Belgium), sodium hydroxide, tris(hydroxymethyl)amino-methane (Tris), boric acid (extrapure, all from Merck, Darmstadt, Germany), and ethylenediaminetetraacetic acid disodium salt (Na-EDTA, Sigma-Aldrich, Madrid, Spain) were used. The oxidation studies were carried out with iron(II)sulfate (Sigma-Aldrich) and hydrogen peroxide (30%, Panreac, Barcelona). Glycerol (85%, Merck) was added to the samples just before injection. Inorganic phosphorous standard (1000 mg L−1) and rhodium (1000 mg L−1, both obtained from Merck) were used as internal standards.The plasmid DNA pBluescript (Dept. of Biochemistry and Molecular Biology, University of Oviedo) was transformed in competing bacterial cells Tuner (DE3) pLacI obtained from the scientific services of the University of Oviedo and purified with the use of a Plasmid Maxi-kit (Izasa, Barcelona).
Instrumentation
The continuous elution gel electrophoretic system (Mini Prep Cell including a high-voltage power supply PowerPac3000, BioRad Laboratories, Munich, Germany) is described in detail elsewhere.26,35 Within this work, the outlet of the GE system was connected to a concentric nebulizer with a flow rate of 0.7 mL min−1. Unless otherwise stated, the parameters of the gel housed in glass tubes (ID: 2.2 mm) were as follows: 0.8% (w/v) agarose SeaKem® LE prepared in 50 mmol L−1 ammonium acetate buffer (pH = 8.0), which served also as an electrode and an elution buffer. The gel length was varied between 30 and 40 mm. DNA separations were carried out at voltages between 250 and 300 V. Sample volume injected on the top of the gel was 10 μL.The ELEMENT 2 inductively coupled plasma-sector field-mass spectrometer (ICP-SF-MS) from Thermo Fisher Scientific, Bremen, Germany allowed the simultaneous and interference-free detection of 31P+ and 56Fe+ in the medium resolution mode of 4000. The operating conditions were as follows: 1350 W RF power, 15.5 L min−1 coolant gas, 0.9 L min−1·auxiliary gas, 0.9 L min−1 nebulizer gas, 100 ms dwell time per isotope.
For comparative studies, slab gel electrophoresis was carried out. Typical separation conditions were as follows: 1% agarose, 0.01 mol L−1 TBE (Tris-borate-EDTA), pH = 8.2, voltage = 100 V. Detection was performed by fluorescence spectroscopy following staining with ethidium bromide.
Procedure for plasmid DNA oxidation
The Fenton reaction was applied to the oxidation of plasmid DNA. For the preparation of the Fe-EDTA complex, equimolar amounts (0.1 mol L−1) of FeSO4 and Na2H2EDTA·2H20 were dissolved in 0.84 mol L−1 NaOH and stored in the dark at 4 °C before use. The subsequent DNA oxidations were realised at 37 °C for two hours by using various concentrations between 0 and 250 μmol L−1 of the Fe-EDTA complex. Further concentrations were kept constant as follows: 16 ng μL−1 plasmid DNA (pBlueScript SK, 2961 bp) and 2.5 mmol L−1 H2O2. After adding 1 μL internal standard (phosphate) and 1 μL glycerol to 8 μL of each oxidation sample, the mixtures were injected into the separation set-up without any further preparation.Results and discussion
Optimisation of the GE-ICP-MS system using a 500 bp DNA ladder
Before using the GE-ICP-MS coupling, it has to be guaranteed that the system, particularly the gel, produces the lowest background on 31P+ possible. Therefore, precautions described elsewhere28 were necessary. Depending on the type of analytical application, in this case the monitoring of oxidation products of plasmid DNA, the gel electrophoretic needed to be optimised. Most influencing factors like applied voltage, gel dimensions and composition were studied for a 500 bp DNA ladder ranging from 500 to 7500 bp.As presented in Fig. 1, the optimised separation conditions permitted an excellent separation of the DNA fragments up to 5000 bp within 25 min. Peak width of the separated fragments goes up to 2 min for the larger fragments. It is important to keep in mind that the molecular mass of these species range from ∼300 kDa (500 bp) to ∼3000 kDa (5000 bp). The used conditions include a 0.8% agarose gel, 250 V as applied voltage and gel dimensions of 40 × 2.2 mm. For the predicted studies on plasmid DNA, these conditions served as a starting point.
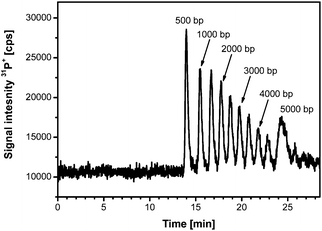 | ||
| Fig. 1 Optimised electrophoretic separation of a 500 bp DNA ladder. (Voltage: 250 V, gel dimensions 40 × 2.2 mm, 0.8% agarose). | ||
Optimisation of the GE-ICP-MS system using plasmid DNA
As said before, a plasmid is a DNA molecule that is separate from, and can replicate independently of, the chromosomal DNA. They are double stranded and usually occur naturally in bacteria, but are sometimes found in eukaryotic organisms with a size up to 1000 kbp.Plasmid DNA may appear in one of three main conformations: open-circular (OC), linear (L) and supercoiled (SC) that run at different speeds in a gel during electrophoresis. These conformations, in order of electrophoretic mobility from slowest to fastest are open-circular DNA, linear DNA and supercoiled DNA. Plasmid DNA is an excellent species to address oxidative DNA modifications since the formation of the different conformations is proportional to the oxidative damage. This is illustrated in the scheme of Fig. 2.
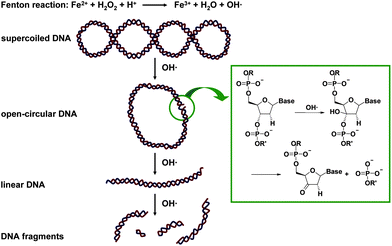 | ||
| Fig. 2 Schematic mechanism of plasmid DNA oxidation with OH·, generated by the Fenton reaction. | ||
The first oxidative damage modifies the supercoiled structure into the circular one by a single-strand break. Further oxidative damage turns in the opening of the circular structure to obtain linear DNA and furthermore, small DNA fragments. The rate of migration for small linear fragments is directly proportional to the voltage applied at low voltages. At higher voltages, larger fragments migrate at continually increasing yet different rates. Therefore, the resolution of a gel decreases with increased voltage.
Based on previous results on the optimisation of the separation of the DNA fragments, the different parameters such as gel concentration and length, buffer composition and concentration, and the applied voltage were varied for the separation of the different DNA plasmid forms. The model compound pBluescript DNA (2961 bp) was used. The initial form of the plasmid DNA is the supercoiled one. In order to transform the supercoiled plasmid DNA into its linear structure, the sample was treated with the restriction enzyme (in this case, BamHI), which recognises the 5′-GGATCC-3′ sequence present once in the pBluescript DNA. An electropherogram recorded under optimised conditions is presented in Fig. 3. In each case, inorganic phosphate was added as an internal standard. As can be seen, the native DNA presents a migration time of about 17.5 min, well separated from the phosphate standard (see black trace of Fig. 3). After enzymatic treatment, the linear form can be directly detected well separated from the supercoiled one (at about 19 min, see grey trace of Fig. 3). This initial example already demonstrates that the proposed GE-ICP-MS coupling with 31P+ detection can serve as a viable tool for monitoring this type of enzymatic reactions and enzymatic activity. Based on these optimisations in terms of separation, the plasmid DNA was treated with Fe-EDTA at different concentrations.
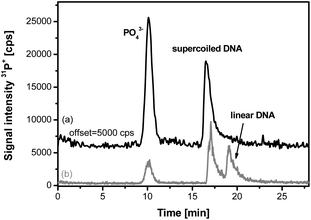 | ||
| Fig. 3 Electropherograms of supercoiled DNA (pBluescript) (a) before and (b) after enzymatic treatment with BamHI. (Voltage: 250 V, gel dimensions 31 × 2.2 mm, 0.8% agarose). | ||
Studies on plasmid DNA oxidation
The Fenton reaction is a well-known reaction frequently used for monitoring and evaluation of oxidation processes in biochemistry.36 Typically the species, e.g. lipids, proteins or DNA, are incubated under certain oxidation conditions in the presence of Fe2+ and H2O2 and the resulting oxidation products are then identified, and if possible, quantified.In this work, plasmid DNA was treated with the Fenton reagents and as illustrated in Fig. 2 different forms of DNA are expected dependent on the concentration of OH· radicals. In a systematic study, the plasmid DNA was isolated and incubated at 37 °C for two hours with the Fenton reagents. In this case the concentration of H2O2 was kept constant (10 mM) while the Fe-EDTA complex was varied between 0–5 μmol L−1. Fig. 4 shows the electropherograms obtained after incubation with three different concentrations of the Fenton reagent and compared with the same samples run in a conventional slab gel. As mentioned above, phosphate was added as an internal standard in each case.
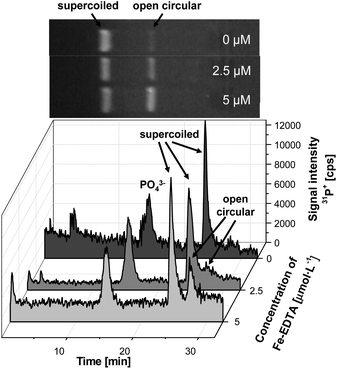 | ||
| Fig. 4 Electropherograms of plasmid DNA after incubation with low concentrations of the Fenton reagent (0–5 μmol L−1) in comparison to slab gel electrophoresis. (Voltage: 250 V, gel dimensions 40 × 2.2 mm, 0.8% agarose). | ||
It should be mentioned that besides 31P+, the signal of 56Fe+ was also monitored throughout all the experiments. However, only a single Fe peak was observable independent from the chosen conditions. This peak could be assigned to the Fe-EDTA complex. Therefore, no coelutions could be observed between this complex and the different DNA forms at any time.
In the case of untreated plasmid DNA, the dominant form was the supercoiled one eluting at about 24 min (see Fig. 4). A small peak can be found at 27 min, which indicates the presence of traces of open-circular DNA present after preparation and isolation. This could be confirmed by the slab gel electrophoresis, which showed a minor band next to the supercoiled form (top trace). As expected with increasing concentration of Fe-EDTA the peak at 27 min rose up indicating the early oxidation products of the plasmid DNA. At these low concentrations the open-circular DNA form is expected, whereas higher concentration of OH· will induce a double-strand break resulting in the linear DNA form.
The electropherograms indicate that already low contributions of the open-circular DNA form were detectable. In other words, oxidative damage of the plasmid DNA could be already observed in a very early stage. This might have great importance, not only for the observation of oxidative DNA damage, but also on the use of plasmid DNA as therapeutic agent and in plasmid-related biological technologies.37
As expected, the concentration of the damaged plasmid DNA (open-circular form) increased with higher concentration of Fe-EDTA (Fig. 5). Concentrations of 25 μmol L−1 Fe-EDTA were found to initiate a further oxidation of the open-circular to the linear form. This was confirmed by using slab gel electrophoresis. Unfortunately, the chosen experimental conditions did not permit the separation of the open circular and the linear forms from each other. The migration time of both species differed in less than 1 min, while the observed peak widths were broad enough to prevent a proper separation of the two peaks. For an improved separation other conditions (e.g., gel length and concentration) had to be chosen. However, the detection limits were then strongly affected (due to the increased peak width) and the analysis time needed to be increased to more than 45 min. For these reasons, the working conditions were kept for representing the whole picture, even if they could not discriminate between the open-circular and linear forms.
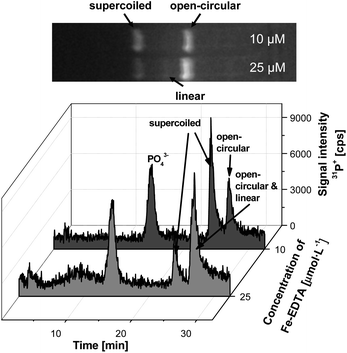 | ||
| Fig. 5 Electropherograms of plasmid DNA after incubation with elevated concentrations of the Fenton reagent (10 and 25 μmol L−1) in comparison to slab gel electrophoresis. (Voltage: 250 V, gel dimensions 40 × 2.2 mm, 0.8% agarose). | ||
Concentrations of 50 μmol L−1 Fe-EDTA proved to be sufficient to eliminate the original supercoiled form entirely. Thus, such incubations were applied to the plasmid DNA as shown in Fig. 6.
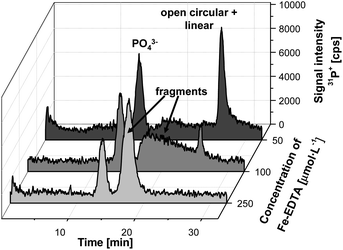 | ||
| Fig. 6 Electropherograms of plasmid DNA after incubation with elevated concentrations of the Fenton reagent (50–250 μmol L−1). (Voltage: 250 V, gel dimensions 40 × 2.2 mm, 0.8% agarose). | ||
As illustrated in Fig. 2, increased concentrations of OH· radicals will further result in the fragmentation of the linear form. Interestingly, these smaller fragments eluted faster from the gel column than the open-circular and linear form of entire DNA, and they can be also detected. It is noteworthy that the profile of the fragments in terms of their size differed significantly when concentration of Fe-EDTA varied between 100 and 250 μmol L−1. Incubations with the lower concentration resulted in a broad distribution of differently sized DNA small fragments, whereas a relatively sharp peak could be observed for the highest tested concentration of the Fe-EDTA (250 μmol L−1). This indicated a much narrower size distribution of the resulting fragments. From the elution time observed the size range was estimated to be in between 50 and 150 bp (of course, further studies are needed to verify these findings).
Quantification studies
Those electropherograms, shown before, demonstrate that the proposed coupling of GE and ICP-MS enables monitoring of this type of induced DNA oxidation. Nevertheless, the main strength of applying ICP-MS as “DNA detector” lies in its distinct ability of quantifying elements. This is due to the outstanding capability of this detector to provide compound independent ionization of the elements. Thus, in principle by using an inorganic standard of 31P, it is possible to address the concentration of this element in the different P-containing species of the electropherogram. For this purpose, it is required to know the exact concentration of the internal standard and to ensure that the matrix is similar along the elution time. In our case, here the composition of the buffer is constant along the separation, and so the second condition is fulfilled.Fig. 7 shows the observed variation of the relative concentration of each of the plasmid DNA forms with the used concentration of Fe-EDTA. However, such relative results can be converted into absolute P concentration (data not shown). By integration of the different forms it should be possible to obtain the total plasmid DNA analysed that can be compared to the initial plasmid DNA obtained and measured spectrophotometrically. Initial plasmid DNA concentration was about 112 ± 8 ng and the mean of the obtained results (using the different oxidation conditions) was 90 ng. These values revealed losses of about 20% during the different sample preparation steps but show the great potential of the ICP-MS based set-up for the aimed quantitation of oxidative DNA products.
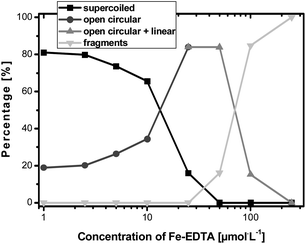 | ||
| Fig. 7 Results of the plasmid DNA oxidation studies in dependence of the concentration of the Fenton reagent. | ||
In comparison to the current densitometric approaches the proposed methodology offers a quantitative strategy for the precise and accurate determination of DNA oxidation products. As the results are traceable to a well-defined inorganic PO43− standard, the achieved repeatability (usually better than 7%) and the linear working range (3–4 order of magnitude) are superior to commonly used densitometric analysis of separated DNA forms by gel electrophoresis.37,38 The detection limits obtained here have been equivalent to our earlier findings on DNA determinations.28 Approximately 100 pg abs. P are detectable, which corresponds to a molar amount of 0.54 fmol absolute of the unfragmented plasmid DNA forms. Therefore, the proposed coupling of GE and ICP-MS can serve as a sensitive and overall quantitative tool in DNA research.
Conclusions
The coupling of gel electrophoresis and ICP-MS was evaluated here for quantitative investigations on DNA oxidation for the first time. Based on optimised separation conditions the proposed GE-ICP-MS coupling can serve as a feasible diagnostic tool for monitoring enzymatic reactions (e.g., measuring the activity of DNA restriction enzymes). Furthermore, the proposed hybrid tool allows the investigation of the concentration of the different forms of plasmid DNA resulting from different oxidation conditions due to the robust and matrix independent signal obtained for 31P. The GE-ICP-MS set-up has shown excellent possibilities to monitor changes in DNA molecules and confirms the important and growing role that ICP-MS is gaining in the field of heteroatom-tagged genomics and proteomics.39 Future work will be directed to make use of this DNA quantification tool for the assessment of DNA induced oxidation provoked by other chemicals on plasmid DNA.Acknowledgements
The authors would like to thank the financial support of L. López throughout the project IB08-032 (FICYT) and the Deutsche Forschungsmeinschaft (BE 2315/4-1). J. Bettmer acknowledges the Spanish Ministry for Education and Science (MEC) for the Ramón y Cajal contract.Notes and references
- J. L. Mehta, N. Rasouli, A. K. Sinha and B. Molavi, Int. J. Biochem. Cell Biol., 2006, 38, 794–803 CrossRef CAS.
- H. Ha, In-A. Hwang, J. H. Park and H. B. Lee, Diabetes Res. Clin. Pract., 2008, 82, S42–S45 CrossRef CAS.
- P. M. Abuja and R. Albertini, Clin. Chim. Acta, 2001, 306, 1–17 CrossRef CAS.
- N. Katakami, K. Sakamoto, H. Kaneto, M. Matsuhisa, I. Shimizu, F. Ishibashi, T. Osonoi, A. Kashiwagi, R. Kawamori, M. Hori and Y. Yamasaki, Biochem. Biophys. Res. Commun., 2009, 379, 861–865 CrossRef CAS.
- B. Halliwell, Biochem. J., 2007, 401, 1–11 CrossRef CAS.
- K. Cui, X. Luo, K. Xu and M. R. Ven Murthy, Progress Neuro-Psychopharmacol. Biol. Psychiatry, 2004, 28, 771–799 Search PubMed.
- M. Valko, D. Leibfritz, J. Moncol, M. T. D. Cronin, M. Mazura and J. Telser, Int. J. Biochem. Cell Biol., 2007, 39, 44–84 CrossRef CAS.
- J. Cadeta, E. Sageb and T. Doukia, Mutat. Res., Fundam. Mol. Mech. Mutagen., 2005, 571, 3–17 CrossRef CAS.
- S. Moureta, M. Charveronb, A. Faviera, J. Cadeta and T. Doukia, DNA Repair, 2008, 7, 704–712 CrossRef CAS.
- E. Mariani, M. C. Polidori, A. Cherubini and P. Mecocci, J. Chromatogr., B: Anal. Technol. Biomed. Life Sci., 2005, 827, 65–75 CrossRef CAS.
- M. Dizdaroglu, P. Jaruga, M. Birincioglu and H. Rodriguez, Free Radical Biol. Med., 2002, 32, 1102–15 CrossRef CAS.
- A. L. Jackson and L. A. Loeb, Mutat. Res., Fundam. Mol. Mech. Mutagen., 2001, 477, 7–21 CrossRef CAS.
- M. S. Cooke, R. Olinski and M. D. Evans, Clin. Chim. Acta, 2006, 365, 30–49 CrossRef CAS.
- I. Kuraoka, C. Bender, A. Romieu, J. Cadet, R. D. Wood and T. Lindahl, Proc. Natl. Acad. Sci. U. S. A., 2000, 97, 3832–3837 CrossRef CAS.
- M. B. Bogdanov, M. F. Beal, R. M. Douglas, R. M. Griffin and W. R. A. Matson, Free Radical Biol. Med., 1999, 27, 647–666 CrossRef CAS.
- A. Pilger, S. Ivancsits, D. Germadnik and H. W. Rudiger, J. Chromatogr., B: Anal. Technol. Biomed. Life Sci., 2002, 778, 393–401 CrossRef CAS.
- H. J. Helbock, K. B. Beckman, M. K. Shigenaga, P. B. Walter, A. A. Woodall, H. C. Yeo and B. A. Ames, Proc. Natl. Acad. Sci. U. S. A., 1998, 95, 288–293 CrossRef CAS.
- B. Malayappan, T. J. Garrett, M. Segal and C. Leeuwenburgh, J. Chromatogr., A, 2007, 1167, 54–62 CrossRef CAS.
- C.-F. Yeh and S.-J. Jiang, Analyst, 2002, 127, 1324–1327 RSC.
- D. Pröfrock, P. Leonard and A. Prange, J. Anal. At. Spectrom., 2003, 18, 708–713 RSC.
- C. Siethoff, I. Feldmann, N. Jakubowski and M. Linscheid, J. Mass Spectrom., 1999, 34, 421–426 CrossRef CAS.
- M. Edler, N. Jakubowski and M. Linscheid, J. Mass Spectrom., 2006, 41, 507–516 CrossRef CAS.
- D. G. Sar, M. Montes-Bayon, E. B. Gonzalez and A. Sanz-Medel, J. Anal. At. Spectrom., 2006, 21, 861–868 RSC.
- W. Brüchert, R. Krüger, A. Tholey, M. Montes-Bayón and J. Bettmer, Electrophoresis, 2008, 29, 1451–1459 CrossRef.
- D. G. Sar, M. Montes-Bayon, E. B. Gonzalez, L. M. Sierra, L. Aguado, M. A. Comendador, G. Koellensperger, S. Hann and A. Sanz-Medel, Anal. Chem., 2009, 81, 9553–9560 CrossRef.
- W. Brüchert and J. Bettmer, Anal. Chem., 2005, 77, 5072–5075 CrossRef CAS.
- J. S. Becker, S. F. Boulyga, C. Pickhardt, J. Becker, S. Buddrus and M. Przybylski, Anal. Bioanal. Chem., 2003, 375, 561–566 CAS.
- W. Brüchert and J. Bettmer, J. Anal. At. Spectrom., 2006, 21, 1271–1276 RSC.
- K. Wrobel, J. A. L. Figueroa, S. Zaina, G. Lund and K. Wrobel, J. Chromatogr., B: Anal. Technol. Biomed. Life Sci., 2010, 878, 609–614 CrossRef CAS.
- M. Garijo Añorbe, J. Messerschmidt, I. Feldmann and N. Jakubowski, J. Anal. At. Spectrom., 2007, 22, 917–924 RSC.
- A. Helfrich, W. Brüchert and J. Bettmer, J. Anal. At. Spectrom., 2006, 21, 431–434 RSC.
- A. Helfrich and J. Bettmer, J. Anal. At. Spectrom., 2007, 22, 1296–1299 RSC.
- S. R. Haider, H. J. Reid and B. L. Sharp, Anal. Bioanal. Chem., 2010, 397, 655–664 CrossRef CAS.
- G. N. M. Ferreira, G. A. Monteiro, D. M. F. Prazeres and J. M. S. Cabral, Trends Biotechnol., 2000, 18, 380–388 CrossRef CAS.
- W. Brüchert, A. Helfrich, N. Zinn, T. Klimach, M. Breckheimer, H. Chen, S. Lai, T. Hoffmann and J. Bettmer, Anal. Chem., 2007, 79, 1714–1719 CrossRef.
- M. Valko, H. Morris and M. T. D. Cronin, Curr. Med. Chem., 2005, 12, 1161–1208 CrossRef CAS.
- S.-B. Yu, J. Geng, P. Zhou, A.-R. Feng, X.-D. Chen and J.-M. Hu, J. Pharm. Biomed. Anal., 2007, 43, 816–821 CrossRef CAS.
- T. Schmidt, K. Friehs, M. Schleef, C. Voss and E. Flaschel, Anal. Biochem., 1999, 274, 235–240 CrossRef CAS.
- A. Sanz-Medel, Anal. Bioanal. Chem., 2005, 381, 1–2 CrossRef CAS.
| This journal is © The Royal Society of Chemistry 2011 |
