Interproton distance determinations by NOE – surprising accuracy and precision in a rigid organic molecule
Craig P.
Butts
*,
Catharine R.
Jones
,
Emma C.
Towers
,
Jennifer L.
Flynn
,
Lara
Appleby
and
Nicholas J.
Barron
School of Chemistry, University of Bristol, Cantocks Close, Bristol, BS8 1TS, United Kingdom. E-mail: Craig.Butts@bris.ac.uk; Fax: +44 117925 1295; Tel: +44 117 9288115
First published on 2nd November 2010
Abstract
The accuracy inherent in the measurement of interproton distances in small molecules by nuclear Overhauser enhancement (NOE) and rotational Overhauser enhancement (ROE) methods is investigated with the rigid model compound strychnine. The results suggest that interproton distances can be established with a remarkable level of accuracy, within a few percent of their true values, using a straight-forward data analysis method if experiments are conducted under conditions that support the initial rate approximation. Dealing with deviations from these conditions and other practical issues regarding these measurements are discussed
Introduction
The accurate measurement of interproton distances in organic molecules is a potentially powerful tool for establishing stereochemical and conformational detail of a structure. The nuclear Overhauser effect (NOE) can, in principle, be used to measure such distances but in practice accuracy is severely lacking and quantitative use of NOEs is contraindicated in essentially all literature discussions of the topic. The lack of accuracy in distance measurements arises because NOE intensities can be perturbed by numerous factors other than interproton distance. Commonly invoked experimental and molecular factors which perturb these include additional cross-relaxation pathways or spin diffusion (i.e. multiple-spin effects), selective polarisation transfer from inhomogeneous inversions, variation in effective τc between spins, accuracy of signal integration and conformational flexibility.1 To account for some of these perturbations, experimental elaborations such as extensive substrate modification, complementary relaxation measurements and full matrix relaxation data analysis can be applied. For example, recently Vogeli et al. determined high accuracy interproton distances in highly deuterated protein samples from such detailed analysis of cross-relaxation rates.2 Much earlier, Andersen et al.3 reported that appropriate analysis of NOESY spectra of prostaglandins gave internuclear distances determined within approximately ±10% of their ‘actual’ value. While this level of accuracy is useful it is too gross to allow many key conformational or stereochemical details to be extracted – for example, the distances between vicinal protons which are eclipsed, gauche or anti are ∼2.25 Å, ∼2.55 Å and ∼3.0 Å, respectively. Within the limits suggested by the work of Andersen et al., the anti case is probably separable from the other two, but there would not be clear distinction between any other conformational situation for these proton pairs. Indeed, most NMR spectroscopists working with small molecules will hold to the underlying tenet that quantitative NOE analysis should be avoided, except in the broadest semi-quantitative terms. While there are too many examples to identify herein, an excellent discussion and examples of NOEs in structure analysis can be found in reference 1.On the other hand, there is a case to be made for re-examining the accuracy of these measurements using modern techniques on a rigid small molecule. Reported applications of (semi-)quantitative NOEs almost exclusively relate to flexible molecules, where treatment of conformational dynamics will obscure the accuracy of underlying NOE measurements, and to biological macromolecules, where the slow-tumbling regime and fast relaxation controls NOE dynamics in sharp contrast to small molecule NOE spectroscopy. Also, many of the more fundamental small molecule reports, such as those of Andersen et al. and Macura et al., are based on relatively early experimental methods and data. The experimental side of NOE measurements has developed enormously in recent years, with new experimental methods (transient DPFGSE NOE, zero-quantum filtration, etc) and hardware improvements (non-quadrature detection, improved RF generation and digital receivers etc). All of these are highly beneficial to determining accurate and clean NOE intensities over a wide dynamic range, and hence should benefit distance determinations. As a result we felt it timely to re-examine the reliability and challenges facing determination of interproton distances using modern NOE-based methods on organic molecules, and ask the simple question; how reliably might we measure interproton distances?
This report4 focuses on the measurement of interproton distances in a organic molecule, tumbling isotropically in non-viscous solventsi.e. in the fast tumbling regime where observed proton–proton NOEs are roughly independent of ωτc, being dominated by double-quantum contributions, and hence are both positive and relatively large in magnitude. The rigid alkaloid strychnine (Fig. 1) is investigated as high precision computational and crystallographic data are available for comparison with NOE determinations, and the polycyclic structure avoids the complications of conformational dynamics and solvation at this stage.
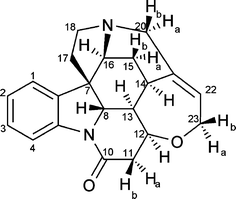 | ||
| Fig. 1 Molecular structure of strychnine. | ||
The determination of the interproton distances described herein is based on comparison of relative NOE intensities (and hence build-up rates) for pairs of spins in transient NOESY (or ROESY) experiments i.e. we standardise the intensity of each NOE peak versus another intensity in the same selective inversion experiment. This effectively minimises any perturbations which proportionately affect all spins in a given experiment. Indeed, Macura et al.5 have demonstrated that employing relative, rather than absolute, intensities of NOEs from within a single experiment can be used to correct for relaxation in 2D-NOESY experiments – effectively extending the period during which the Initial Rate Approximation holds for the absolute values of NOE enhancements, and this is confirmed in our experience. Hu and Krishnamurthy6 have recently extended the applicability of this to DPFGSE transient 1D-NOESY and 1D-ROESY experiments such as are employed in this report.
Under such conditions, and measured as described below in non-viscous solvents (CDCl3 and C6D6 for example), we find that there are negligible negative (transferred) NOEs (<0.1% of intensity of the inverted resonance) and all relative NOE intensities are essentially constant with mixing time (up to ∼600 ms), i.e. each NOE builds up at a rate proportional to its initial intensity during this time. The lack of transferred NOE signals and constancy of these (relative) build-up curves suggests that the Initial Rate (and thus Isolated Spin Pair) Approximation is holding true in these experiments, so in a preliminary analysis we will ignore multiple spin effects under these conditions. It is worth explaining a little of the detail behind the Initial Rate Approximation, whereby one can assume that a pair of protons (I and S) give rise to a build-up of NOE intensity which, for a given mixing time, is proportional only to the I–S cross-relaxation rate (σIS) according to eqn (1) where ηIS is the intensity of the NOE between I and S (S being the inverted spin) and τm is the experimental mixing time.1,7
| ηIS = σISτm | (1) |
Further, in the fast tumbling regime, the cross-relaxation rate is proportional to the internuclear distance (rIS−6) as described by eqn (2).
| σIS = krIS−6 | (2) |
The values of μ0, γ, and ω are essentially fixed for a given experiment, and thus if we assume τc is comparable for each spin pair InS in a given selective inversion experiment then k can be assumed to be constant (and identical) for each spin pair within a given selective inversion experiment.
We will now consider the case of selective inversion of spin S in a given transient 1D-NOESY spectrum where NOE intensity will build-up for a fixed τm. If k is also constant, as described above, then the ratio of the intensities of a pair of NOE signals ηI1S:ηI2S within that spectrum can thus be assumed to be proportional to their ratio of internuclear distances (eqn (3)) and this ratio will be independent of mixing time (within the Initial Rate Approximation).8
| ηI1S/ηI2S = rI1S−6/rI2S−6 | (3) |
Thus, if all of the assumptions made above are valid then the calculation of interproton distances is very straight forward. By measuring ηI1S and ηI2S we only need to know one distance, e.g. rI1S, in order to calculate the second distance, rI2S, or vice versa.
While this approach is not unknown, indeed it is outlined in reference 1, herein we report surprisingly high accuracy from NOE-distance measurements in a small rigid molecule using this analysis – beyond what would generally be recognised as possible – suggesting these assumptions are valid and that many of the perturbations highlighted above do not contribute significantly under the conditions reported. We do not suggest these measurements are universally applicable to all molecules but the robustness of the technique for strychnine suggests that it can be extended more widely and more accurately than is generally recognised.
Experimental
NMR Samples were prepared in 5 mm tubes, 0.7 ml CDCl3 (30 mg strychnine), 0.7 ml C6D6 (7 mg strychnine due to limited solubility) or 0.7 ml DMSO (6 mg strychnine due to limited solubility), under air without degassing. NMR data were all collected on 500 MHz Varian VNMRS DirectDrive spectrometers equipped with direct or indirect observe probes. 1-Dimensional selective transient NOESY spectra (64k data points, 8 kHz sweep width, 4.096 s acquisition time, 128 scans for CDCl3 samples (15 min data collection/irradiation) or 1024 scans for C6D6/DMSO samples (120 min/irradiation)) were obtained using the Varian Chempack NOESY1D sequence which is based on the DPFGSENOE (double-pulse field gradient spin-echo NOE) excitation sculpted selective sequence reported by Stott et al.,92D-NOESY spectra (2404 t2 points, 200 t1 points, 8 kHz sweep width, 0.15 s t2 acquisition time). All NOESY spectra employed 500 ms mixing times. 1D-NOESY data use 1 s relaxation delays, and 2D-NOESY data employ relaxation delays of 1–5 s as described in the main text. Both 1D- and 2D-NOESY experiments employed a zero-quantum filter element.10 Data were processed in MestreNova v6 or ACDLabs v12. 1D data were apodized with 1.5 Hz exponential functions while 2D-data were treated with 90-degree sine squared (t1) and 90-degree sine bell (t2) functions prior to Fourier Transform.Results and discussion
1D-NOESY data
The analysis employing eqn (3) to determine interproton distances is illustrated for H15a of strychnine in CDCl3. The selective (1D) transient DPFGSE-NOESY spectrum of H15a is shown in Fig. 2 and shows the clean, well-resolved NOE peaks with a very flat baseline which is representative of all of the spectra obtained in this study. For convenience, the absolute values for the NOE intensities were measured relative to the irradiated (negative) peak for which the integral was arbitrarily assigned a value of −1000. The NOE intensity for the H15 methylene protons H15a-H15b (η = 216.2) corresponds to an estimated distance of ∼1.76 Å, and hence the intensities of the remaining observed NOEs from H15a to H13 ((η = 60.4), H14 (η = 25.8), H16 (η = 31.7), and H8 (η = 1.3) can be used to determine their corresponding distances to H15a to be 2.18, 2.50, 2.42, and 4.29 Å respectively. A summary of the distances derived from the H15a NOEs in CDCl3 as well the computed11 and crystallographic values12 for strychnine are shown in Table 1.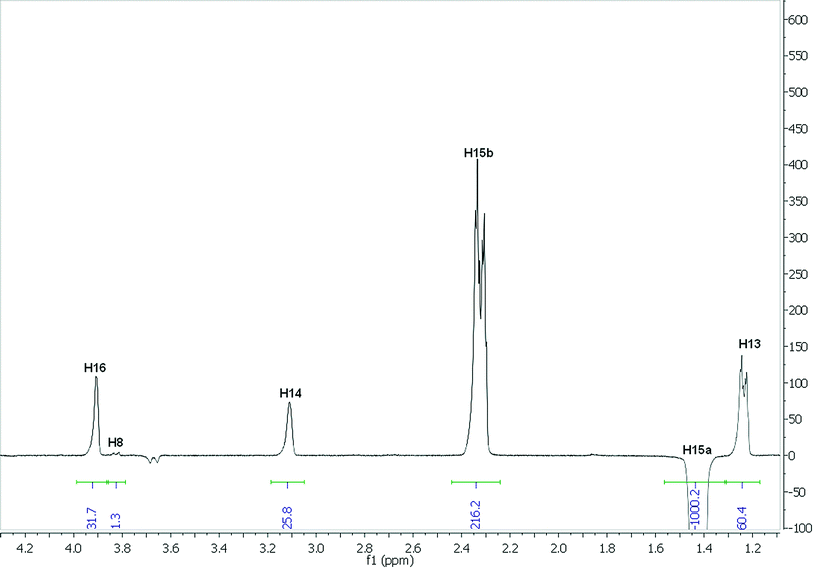 | ||
| Fig. 2 1D-NOESY spectrum of H15a of strychnine in CDCl3. | ||
| Irrad. 1H | Obs. 1H | NOE Integrala | Interproton distance/Å | ||
|---|---|---|---|---|---|
| NMR | DFT11 | X-ray12 | |||
| a Arbitrary units, set relative to the integral of the irradiated resonance (chosen as −1000). | |||||
| H15a | H13 | 60.4 | 2.18 | 2.25 | 2.23 |
| H14 | 25.8 | 2.50 | 2.54 | 2.53 | |
| H15b | 216.2 | 1.76 | 1.76 | 1.75 | |
| H16 | 31.7 | 2.42 | 2.47 | 2.40 | |
| H8 | 1.3 | 4.29 | 4.07 | 4.05 | |
| H16 | H15b | 19.3 | 2.44 | 2.47 | 2.48 |
| H20b | 3.0 | 3.33 | 3.37 | 3.66 | |
| H1 | 41.1 | 2.15 | 2.35 | 2.28 | |
| H17a | 14.2 | 2.57 | 2.70 | 2.65 | |
| H15a | 20.2 | 2.42 | 2.47 | 2.40 | |
| H18a | 1.7 | 3.65 | 3.64 | 3.67 | |
The distances for H15a in CDCl3 fit remarkably well with those obtained by computation11 and very high quality X-ray crystallographic data (R-factor = 1.5%). It should be noted that the small negative peak at ∼3.68 ppm in Fig. 2, corresponding to H20a, represents the largest transferred NOE peak (0.47% of the H15a inversion peak) observed in any of the 1D-NOESY spectra of strychnine under these conditions. This suggests that transferred NOEs will not significantly affect the strong NOEs probed in this study, but might play a role in perturbing the longest distance measurements in this example (say >3 Å).
The method employed to establish distances to other, non-CH2, protons can be illustrated with the methine proton H16. As no methylene partner exists an alternative calibration distance is required. Irradiation of H16 gives six NOEs, including the reverse H16-H15a NOE – for which the distance has already been determined to be 2.42 Å vide supra. This H15a-H16 distance can thus be used to calibrate the other interproton distances for H16. This same calibration approach can be used for all of the nuclei observed in the initial H15a and H16 datasets i.e. distances fromH13, H14, H15b, H8, H20b, H1, H17a and H18a can all now be established, based on the values in Table 1. Naturally, this cycle can be repeated again and these new distances used to calibrate other NOE experiments until all connected NOEs are analysed. An alternative approach would be to calibrate distances from every methylene pair of protons first and then establish distances from each of these until all connected NOEs are analysed. For the sake of simplicity we have employed the former method, as this scales the entire dataset to a single distance, but this may not be appropriate for more complex datasets.
In order to measure a complete set of distances for strychnine, selective transient 1D-NOESY experiments were applied to each resolved resonance of strychnine in CDCl3 and C6D6. For the purposes of this report, ‘resolved’ refers to individual resonances which are sufficiently separated in frequency such that they could be selectively irradiated without significant (>0.5%) inversion of adjacent resonances – in our experiments this typically requires ∼10 Hz of baseline separation between resonances that are not strongly coupled. These experiments gave rise to a total of 123 NOE signals which could be accurately analysed. Starting from the H15a-H15b NOE and calibrating with an assumed intermethylene distance of 1.76 Å, then propagating the distances through the full dataset (vide infra), interproton distances were obtained from each of the CDCl3 and C6D6 solutions of strychnine (44 and 42 internuclear distances, respectively). These datasets were combined and where the same distance was independently determined from two or more NOE datasets, the determined distance was taken to be the average of all of the values. This gave a total of 55 unique interproton distances for strychnine, which are plotted against their computationally determined values in Fig. 3.
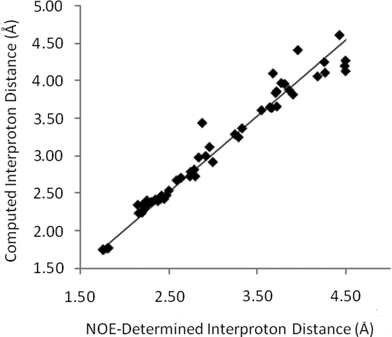 | ||
| Fig. 3 Computed interproton distances11 for strychnineversus those established by 1D-NOE measurements. | ||
The slope of the line-of-best fit in Fig. 3 is essentially unity (1.012), reflecting the accuracy of this NOE-based method in determining interproton distances across a range of separations in strychnine. The precision is also surprisingly high, as the average absolute error is 3.3% (0.09 Å) with a standard deviation of 3.1% (0.11 Å) for distances up to 4.5 Å. These error values compare very well with those obtained from X-ray crystallography, where mean interproton distance errors of 1.4–4.3% (std 1.2%–4.3%) arise from the numerous structure determinations of strychnine reported with R2 values of 1.5%12–3.7%.13
For the shorter interproton distances (<2.8 Å), the determined values are even more precise with a mean average error of 2.7% (0.05 Å) and standard deviation of 2.1% (0.05 Å). The reduced accuracy of the longer range NOEs could arise from a number of experimental, dynamical and analytical factors. For example, this may be the result of small transferred NOE contributions which will reduce the weakest NOE intensities by non-trivial amounts, or of the greater conformational flexibility inherent in longer distances i.e. where the contributing protons are separated by more bonds there are more intervening degrees of freedom. More widely separated proton pairs are also likely to fit less well with the assumptions made in applying eqn (3) – for example, one could suggest that it is less likely that widely separated spin pairs will have comparable τc values as they occupy considerably different regions of the molecule – hence will experience more anisotropic tumbling rates. A similar argument might suggest that the correction for bulk relaxation inherent in the use of relative NOE intensities is less robust when protons are widely separated, as they are more likely to have significantly different lattice environments and dynamics.
In any case, given that the NOE-based distances discussed herein are determined in the solution-state and yet are still comparable to X-ray structure determinations, the precision obtained is highly significant and suggests that all of these perturbing features are much less significant than is usually recognised when measuring distances in small molecules, as opposed to macromolecular systems. Further, once the 1D-NOESY data is obtained, the spectra are easily analysed, with apodization, phasing and baseline correction being straightforward – particularly on modern stable spectrometer platforms.
2D-NOESY data
Most literature reports which employ quantitative interproton distance data, do so from 2D-NOESY spectra rather than the selective 1D-NOESY methods described above. In particular, 2D datasets reduce the problem of overlap in the direct dimension of the 1D-spectrum, which can limit selective irradiations, thus potentially enabling a larger number of internuclear distances to be determined. Thus it is useful to compare results obtained from 1D and 2D NOE methods.A set of 2D-NOESY datasets were obtained with inter-scan relaxation delays ranging from 1–5 s. The ratios of NOE intensities for each proton were determined by analysing F2-slices at the F1-chemical shift of each resonance and integrating the areas of peaks in the slice. These intensities were then converted into interproton distances using the same calibration process described above for 1D-NOESY, starting from the F2-slices for H15a and H15b and the known H15a-H15b distance. An alternative analysis using volume integration directly from the 2D datasets was found to give less reliable distances and thus only integrated F2-slice data will be discussed further here.
The full set of interproton distances determined from the best 2D-NOESY experiment are shown in Fig. 4. There are fewer long range (>3.5 Å) interproton contacts than could be obtained from 1D-NOESY for reasons discussed below, but the dataset collected with the longest (5 s) relaxation delay did provide correspondingly accurate interproton distances (mean average error 3.8%) for the distances shown. The quality of distances determined fell dramatically in datasets with shorter relaxation delays (up to a mean average error ∼8.3% for a 1 s relaxation delay). The fundamental difficulty with these long relaxation delays is the massively increased data collection time – substantially longer than the total of the corresponding 1D-experiments. For experiments in CDCl3 (30 mg strychnine) 2D-NOESY experiments required ∼20 h versus ∼3 h for all of the 1D-NOESY irradiations. Shorter relaxation delays might be employed with subsequent data correction to compensate for the truncation. Andersen et al.3 and Geppert et al.14 have previously described methods to mitigate some of the effects of partial relaxation on the quality of distances in small molecules using 2D-NOESY. However any such data corrections are likely to perturb final distance qualities and in this instance we simply make note of the drop in quality when relaxation is truncated.
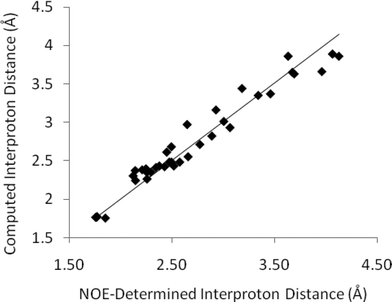 | ||
| Fig. 4 Computed interproton distances in strychnineversus those established by 2D-NOESY measurements (CDCl3, 5 s relaxation delay). These data do not include spurious distances subsequently identified by comparison of 2D and 1D-slices – see main text for details. | ||
However there is a more significant concern with 2-dimensional datasets, even if collected with sufficiently long relaxation delays. The 2D data presented in Fig. 4 and the corresponding errors above only consider peaks which correspond to those also observed in 1D-NOESY experiments. A number of other apparent NOE peaks in the 2D-NOESY slice data do not correspond to valid interproton distances and it is challenging to identify all of these directly from the F2-slices without any prior knowledge. For example, the F2-slice for H20a (3.68 ppm) from a 2D-NOESY spectrum of strychnine (bottom, Fig. 5) with an apparent strong NOE contact with H8 (3.85 ppm, highlighted) corresponding to an internuclear distance of ∼3.5 Å. This peak does not appear in the corresponding selective 1D-NOESY spectrum for H20a (top, Fig. 5). Inspection of both DFT and X-ray structures of strychnine suggests the H20a-H8 distance is around 4.65 Å. The 2D-NOESY ‘peak’ in this case arises from a t1-truncation artefact of the adjacent 3.85 ppm (H8) diagonal peak. In a similar fashion, t1-noise and overlap from adjacent strong correlations can also give rise to weak artefact peaks in the 1D-slices with intensities that correspond to distances of ∼3–4 Å. The t1-noise can be mitigated somewhat by collecting the data in t1-interleaved blocks and using t1-correction algorithms built into most NMR processing software, while aberrant peak shapes such as t1-truncation ‘sync-wiggles’ can be minimised with careful apodisation of the dataset. However even with careful processing, spurious peaks were still apparent at levels corresponding to >3 Å distances. To add to the difficulty of extracting sensible distances, the intensities of some of the artefact peaks obviously change with processing method and so simple reliance on post-processing corrections is not advised when high accuracy interproton distances are required. On the other hand, any strong dependence of relative peak intensity on processing method probably suggests a peak is artefactual and should be discounted. In our estimation, around 10–20% of the peaks observed in the 1D-slices arose from, or were contaminated by, such artefacts. As such, detailed inspection of the whole 2D spectrum is required in order to make qualitative judgments regarding the reliability of the peaks prior to distances being determined. These factors effectively highlight the increased complexity of analysing 2D-NOESY as compared to the more straight-forward 1D-NOESY analogue.
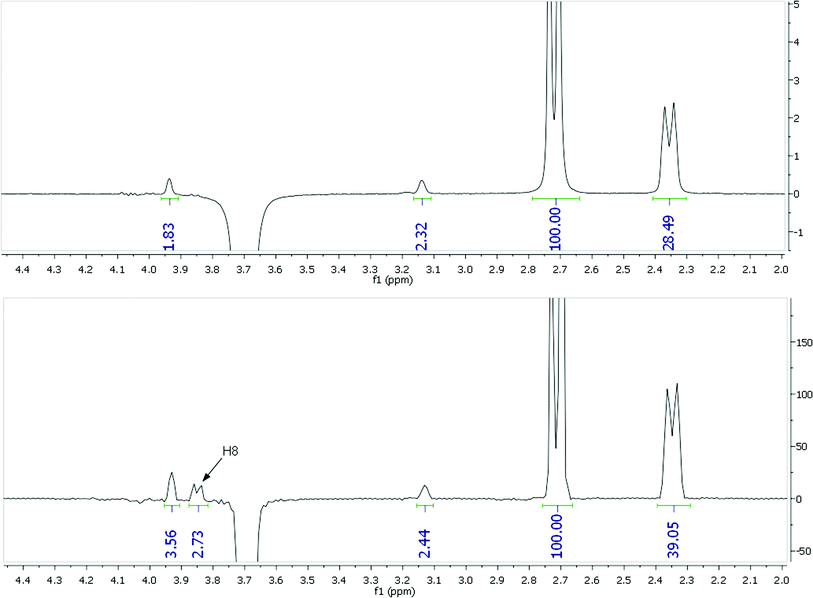 | ||
| Fig. 5 NOE data for H20a of strychnine (3.68 ppm in CDCl3) from a selective 1D-NOESY (top) and 2D-NOESY F2-slice (bottom) with an H8 artifact highlighted. | ||
In summary, we find the 1D-NOESY experiment to be faster, simpler, at least as accurate as 2D-NOESY for internuclear distance determinations, and able to applied with more confidence to longer range NOE contacts. On the other hand, 2D-NOESY can give nearly as accurate distances if data interpretation is applied carefully and clearly will be preferable in instances where selective irradiation is impractical, but great care must be taken to ensure that weak artefacts are not mistaken for genuine NOEs and hence corresponded to interproton distances.
Solvent effects
Interproton distances for strychnine were determined in three solvents, d6-DMSO, d6-benzene and CDCl3 using 1D NOESY experiments and analysed as described above. Comparison of the resulting interproton distances with the expected (DFT) values in each solvent is presented in Fig. 6. While the structure of strychnine is not affected by solvation, the distances measured by this NOE approach do vary substantially. It is clear in Fig. 6 that d6-benzene gives the most reliable fit to the expected values, with CDCl3 providing only slightly less reliable values. However, the errors in distances obtained in d6-DMSO (average error 6.9% [0.2 Å], std 4.2% [0.14 Å]) are about twice those of distances obtained in the less viscous solvents d6-benzene (average error 3.0% [0.1 Å], std 2.8% [0.11 Å]) and CDCl3 (average error 4.3% [0.1 Å], std 3.5% [0.10 Å]). Most noticeably, the distances between diastereotopic CH2 protons, which should all be ∼1.78 Å ± 0.02 Å, are determined with values of 1.73–1.97 Å (cf 1.74–1.81 Å in d6-benzene) illustrating that there is a problem with data quality rather than some unexpected conformational change in the structure. It should be noted that 2D-NOESY data in these solvents are affected to a similar degree, and in all cases were slightly less accurate than their 1D-NOESY counterparts.![Comparison of calculated interproton distances with those determined from 1D-NOESY data in C6D6, CDCl3 and DMSO. Average errors (std dev.) are: C6D6 3.0% [0.1 Å] (2.8% [0.11 Å]), CDCl3 4.3% [0.1 Å], (3.5% [0.10 Å]), DMSO 6.9% [0.2 Å] (4.2% [0.14 Å]).](/image/article/2011/OB/c0ob00479k/c0ob00479k-f6.gif) | ||
| Fig. 6 Comparison of calculated interproton distances with those determined from 1D-NOESY data in C6D6, CDCl3 and DMSO. Average errors (std dev.) are: C6D6 3.0% [0.1 Å] (2.8% [0.11 Å]), CDCl3 4.3% [0.1 Å], (3.5% [0.10 Å]), DMSO 6.9% [0.2 Å] (4.2% [0.14 Å]). | ||
As DMSO is more viscous than chloroform and benzene, it is likely that this reduced accuracy arises from slower molecular tumbling and faster relaxation in this solvent. This in turn could cause a deviation of NOE data from the Initial Rate Approximation at 500 ms, even under the correcting effect of interpreting relative NOE intensities i.e. the relative NOE intensities within a given selective 1D-NOESY spectrum are no longer constant as a function of mixing time. This was confirmed by 1D-NOESY build-up curves in DMSO. Fig. 7 illustrates build-up curves for H15a which show that the NOE reaches a maximum at ∼400–500 ms and external relaxation dominates above 600 ms. Choosing a shorter mixing time value (200 ms) which is less than half of that giving rise to the NOE maximum restored the Initial Rate Approximation for DMSO solutions of strychnine, i.e. relative NOE intensities in a given spectrum were constant with mixing time, and thus reduced the errors in all distances for strychnine to near those obtained in the less viscous solvents (average error 4.5% [0.13 Å], std 2.9% [0.10 Å]).
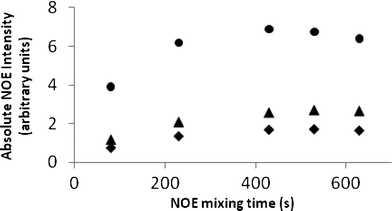 | ||
| Fig. 7 1D-NOE build-up curves in DMSO for H15a to H15b (●), H16 (▲) and H14 (✦). | ||
ROESY
Hu and Krishnamurthy6 have previously described the correction of 1D-ROESY data for relaxation and hence effectively demonstrated that eqn (3) is also applicable to 1D-ROESY measurements. Thus such experiments should give comparable interproton distance results to those obtained from NOESY data by using the data analysis method described above.1D-ROESY experiments were carried out in d6-benzene, CDCl3 and d6-DMSO, using a shorter mixing/spinlock period (200 ms) than for the corresponding NOESY experiments. In general the ROESY data suffered slightly from more baseline distortions – presumably TOCSY breakthrough artefacts – than the NOESY spectra but in CDCl3 and d6-benzene the distances and observed errors were comparable to the 1D-NOESY spectra obtained with 500 ms mixing times (d6-benzene average error 3.5% [0.09 Å], std 2.7% [0.09 Å], CDCl3 average error 3.2% [0.09 Å], std 3.3% [0.11 Å]). Notably, the ROESY data from d6-DMSO solutions using the 200 ms mixing period (average error 4.8%[0.14 Å], std 3.7% [0.13 Å]) were also comparable to the NOESY data obtained with 200 ms mixing times, while 500 ms mixing/spinlock ROESY spectra in DMSO (average error 6.7% [0.19 Å], std 4.0% [0.12 Å]) again resulted in lower quality distance data – supporting the deviation from the Initial Rate Approximation highlighted above.
Some practical details
While not the main thrust of this report, it is useful to highlight several other practical issues regarding the data collection and analysis used here which may also affect the quality and quantity of distance data extracted from NOE experiments.It is important to recognise that the NOE signals for interproton distances of >3.5 Å will be 50–100× weaker than those for the CH2 groups used to calibrate them. Therefore any significant post-processing of experimental data, such as extensive high-order phase and/or baseline correction, can easily perturb the integrity of these weakest signals. All of these experiments were performed on modern, stable spectrometer platforms which give extremely flat baselines, and required little or no first order phase correction, drift or baseline correction. When these experiments were performed on older spectrometers it was still possible to extract distances using this same experimental approach, but in general fewer clean peaks (and thus distances) were obtained, baselines were less reliable, more phase correction was required and hence the results were less accurate – especially at distances over 3 Å.
The presence of coherence transfer artefacts cause significant peak-shape distortions in NOE experiments and of particular concern were zero-quantum (ZQ) artefacts arising from spin–spin coupling. Such artefacts are most likely to arise in short-range NOEs between J-coupled spin pairs – often the most interesting for complex organic molecules, as they define the local stereochemical environment. In principle the anti-phase line shape of these artefacts should give rise to no overall contribution to integration, but when dealing with the weakest NOE peaks (>3 Å) it is critical that there is no substantial contribution. The results described above made use of the ZQ filter described by Thrippleton and Keeler10 so to test the contribution of ZQ artefacts, control 1D-NOESY experiments were conducted in CDCl3 with no ZQ filter in place. This resulted in seven of the NOE resonances peaks in CDCl3 showing significant distortion from ZQ contributions. However, in these limited number of cases the integral values of the NOE resonances still matched those obtained in the ZQ-filtered experiments. While this suggests that ZQ filters are not required for ensuring the accuracy of these distance-determinations, we would advise caution in interpreting this result. At the least, ZQ-filtration improves the appearance of the observed lineshapes, which makes interpretation of the NOE spectra – especially 2D variants – significantly more straightforward.
It is well recognised that the presence of paramagnetic impurities, such as dioxygen, can have a deleterious effect on the absolute intensities of NOE measurements, and common practice suggests that samples should be degassed prior to NOE studies. However in these studies no special care was taken to exclude oxygen and the results are still clearly robust. In fact, for small molecules the T1 values of the protons are sufficiently large that NOE intensity is still building up at mixing times of a few hundred milliseconds and we readily measured accurate NOE intensities in CDCl3 after 500 ms mixing times in aerated samples. While the presence of oxygen will increase spin–lattice relaxation during the mixing period and hence result in weaker NOEs, it would also result in more complete relaxation of the proton spins between scans, hence decreasing possible perturbation from truncation as discussed above. To test this, 1D- and 2D- measurements were performed on a degassed sample of strychnine in CDCl3 using comparable scan recycle times (5.5 s). While the 1D-NOESY showed negligible (<0.5%) change in the mean distance error obtained, the 2D-NOESY data was affected slightly (>1% increase in mean error compared to data from an aerated sample with a 5 s relaxation delay) reflecting some slightly higher sensitivity to truncation effects in these non-selective inversion experiments. So it appears that degassing is not strictly necessary when determining internuclear distances by NOE measurements and indeed may be somewhat deleterious to the quality of data obtained in cases where slow relaxation is occurring.
Conclusion
In summary, we report that interproton distances up to ∼4 Å in a rigid organic molecule such as strychnine can be accurately determined by a simple analysis of transient NOE intensities – fitting extremely well with crystallographic and DFT calculated structures. Mean errors in interproton distances as low as 3% can be obtained from 1D-, 2D- NOESY or ROESY experiments when these are conducted in the fast-tumbling regime and inside the Initial Rate Approximation. At distances >4 Å, signals from artefacts and NOEs become comparable in intensity and thus distance determinations become significantly less reliable under the conditions described. The interproton distances are most accurate when measured in a non-viscous solvent, but perturbations due to solvent viscosity and deviation from the Initial Rate Approximation were addressed by using a mixing time of around half of the mixing time observed to give maximum NOE intensity in a single 1D-NOESY build-up curve – whether this rule-of-thumb can be applied generally to small molecules is unclear.Where possible the use of 1D-NOE/ROE data is recommended, rather than 2D-data, as these generally have cleaner baselines, fewer artefacts and thus reduce the level of post-processing of spectra, which in turn minimises perturbation of, or misassignment of, the weakest NOEs. The most modern implementations of DPFGSE-based transient NOE experiments should be employed and incorporation of zero-quantum filtration is beneficial to the quality of spectra obtained, but in these experiments zero-quantum filtration did not substantially affect the distances determined. The effects of structural dynamics have not been considered in this report, however the accuracy of the data obtained herein offers significant optimism for comparably accurate dynamical analysis of NOE measurements in flexible systems and we are currently investigating these.
Acknowledgements
We would like to acknowledge Dr Mike Bernstein and Professor Mike Williamson for helpful discussions. Catharine Jones thanks the University of Bristol and Nick Barron thanks the Bristol Chemical Synthesis Doctoral Training Centre, funded by EPSRC (EP/G036764/1), AstraZeneca, GlaxoSmithKline, Novartis, Pfizer, Syngenta and the University of Bristol, for the provision of a Ph.D. studentship.Notes and references
- ‘The Nuclear Overhauser Effect in Structural and Conformational Analysis’, 2nd revised edition, D. Neuhaus, M. P. Williamson, John Wiley and Sons Ltd John Wiley & Sons Inc, 2000 Search PubMed.
- (a) B. Vögeli, T. F. Segawa, D. Leitz, A. Sobol, A. Choutko, A. D. Trzesniak, W. van Gunsteren and R. Riek, J. Am. Chem. Soc., 2009, 131, 17215–17225 CrossRef CAS; (b) B. Vogeli, M. Friedmann, D. Leitz, A. Sobol and R. Riek, J. Magn. Reson., 2010, 204, 290–302 CrossRef.
- N. H. Andersen, H. L. Eaton and X. Lai, Magn. Reson. Chem., 1989, 27, 515–528 CAS.
- Parts of these results, most notably some of the data in Fig. 3, has been presented in oral (SMASH, September 2009, Chamonix, France) and poster (no. 469, WWMRC2010, July 4–9, 2010, Florence, Italy) contributions to conference proceedings.
- S. Macura, B. T. Farmer II and L. R. Brown, J. Magn. Reson., 1986, 70, 493–499 CAS.
- H. Hu and K. Krishnamurthy, J. Magn. Reson., 2006, 182, 173–177 CrossRef CAS.
- High-Resolution NMR Techniques in Organic Chemistry [2nd revised edition], T. D. W. Claridge, Elsevier Science & Technology Elsevier Science Ltd, 2008 Search PubMed.
- This offers an alternative test for the fulfillment of the Initial Rate Approximation using a single 1D-NOESY buildup curve on a given sample i.e. where the Initial Rate Approximation holds true, all of the relative intensities of peaks within the spectra will be constant as a function of mixing time.
- K. Stott, J. Keeler, Q. N. Van and A. J. Shaka, J. Magn. Reson., 1997, 125(2), 302–324 CrossRef CAS.
- M. Thrippleton and J. Keeler, Angew. Chem., Int. Ed., 2003, 42, 3938–3941 CrossRef CAS.
- A. Bagno, F. Rastrelli and G. Saielli, Chem.–Eur. J., 2006, 12, 5514–5525 CrossRef CAS.
- M. Messerschmidt, S. Scheins and P. Luger, Acta Crystallogr., Sect. B: Struct. Sci., 2005, 61, 115 CrossRef.
- S. S. B. Glover, R. O. Gould and M. D. Walkinshaw, Acta Crystallogr., Sect. C: Cryst. Struct. Commun., 1985, 41, 990 CrossRef.
- T. Geppert, M. Kock, M. Reggelin and C. Griesinger, J. Magn. Reson., Ser. B, 1995, 107, 91–93 CrossRef CAS.
| This journal is © The Royal Society of Chemistry 2011 |

