hERG binding feature analysis of structurally diverse compounds by QSAR and fragmental analysis
N.S. Hari Narayana
Moorthy
*,
Maria J.
Ramos
and
Pedro A.
Fernandes
REQUIMTE, Departamento de Química e Bioquímica, Faculdade de Ciências, Universidade do Porto, 687, Rua do Campo Alegre, 4169-007, Porto, Portugal. E-mail: hari.moorthy@fc.up.pt; pafernan@fc.up.pt; Tel: +351 220 402 506
First published on 29th September 2011
Abstract
A series composed of structurally diverse hERG blockers was considered for the present hERG binding feature analysis. The QSAR models derived from the analysis were validated which revealed that the developed models (biparametric) are statistically significant. In all the models, the SlogP_VSA9 descriptor has contributed along with either MOPAC (AM1_HOMO or AM1_IP) or partial charge (PEOE_VSA-6) descriptors. These descriptors describe that the molecules should have functional groups with less negative charge and/or high ionization potential for better activity. Fragmental analysis was also performed on the substituents present in the molecules, and reveals that the presence of a COOH group is detrimental for the activity and also it reduces the partition coefficient of the molecule. The presence of an aromatic substituent significantly improves the activity and, simultaneously, increases the partition coefficient value of the molecule. These findings suggest that the partition coefficient is one of the important properties for the hERG blocking activity of the studied molecules. The additive effect of the partition coefficient (SlogP_VSA9) and the negative charge on the van der Waals surface area of the molecules was analyzed by using the multiplied values of the descriptors (multiplication of descriptor with their respective regression coefficient). These studies confirm that the presence of a less negatively charged group with aromatic rings is favourable for hERG blocking activity. Hence, the results obtained from the studies are useful for developing novel moieties with reduced hERG blocking activities.
Introduction
The human ether-a-go-go-related gene (hERG) (K+ channel protein) is mainly expressed in the heart and the nervous system of the human body and the small molecule (drug) induced blockade of this hERG channel has been associated with the elongation of the QT interval called long QT syndrome (LQTS).1–3 They cause ventricular tachyarrhythmia called torsades de pointes (TdP) and sudden cardiac death. Only some hERG channel blockers induce TdP because they can have effects on (modulate) other channels that counteract the hERG channel-mediated effects. However, hERG channel blockade is an important indicator of potential pro-arrhythmic liability and is used as a significant target for class III antiarrhythmic drugs; for all other therapeutic agents, it is an unwanted side effect which can affect their efficiency.4–6 Nowadays, hERG blocking activity is one of the main problems in drug design along with inappropriate ADMET properties. Scientists must consider these issues while designing and developing novel bioactive moieties against various biological targets. In order to overcome this hurdle (hERG blockade), intense effort is needed to develop computational methods to predict the hERG binding properties of any molecule at an early stage of drug discovery. However, in silico prediction of hERG channel blockade by therapeutic agents is still a difficult task.In our laboratory, computational based structure feature analyses (QSAR, pharmacophore and docking studies) of biologically active moieties and hERG blockers are underway for the development of pharmacologically active novel molecules free of toxicity (hERG blockade). Quantitative structure activity relationship (QSAR) analysis is one of the tools that links biological activity data (hERG blocking activity) with physicochemical properties (structural features) of a set of molecules.7–9 The literature shows that some computational models, including QSAR analysis (2D and 3D), classification, homology modeling, pharmacophore etc., have been reported recently for hERG channel blockers. The results of the reported QSAR studies suggested that the 2D QSAR (regression) methods (still faster than 3D techniques) could give more useful information than other classification models. Although classification models are certainly useful, they struggle to provide the type of detailed SAR predictions that are possible with regression techniques.10–13 The QSAR models developed with structurally diverse compounds that exhibit variation in activities can provide internally consistent models, which explain the structural features responsible for the hERG blocking activity. In the present investigation, a series of compounds comprised of structurally diverse derivatives were considered to investigate hERG blocking activity of the molecules.14 However, no QSAR report has been published on this diverse series of compounds. Hence, the development of internally consistent and statistically significant QSAR models (using various validation methods) along with the effect of fragmental/groups (substitutions) on the variation in the activities is important in this analysis. These combined QSAR and fragmental analyses are used to investigate the effects of the fragments/substituents in the variation in physicochemical properties (contributed in the QSAR models) and how those features affect the hERG blocking activity of the molecules.
Experimental
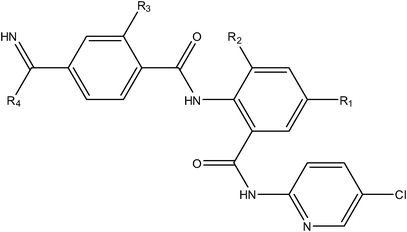
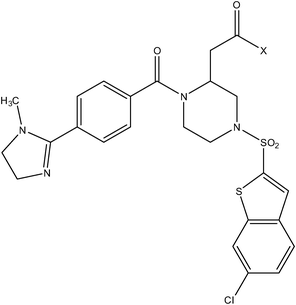
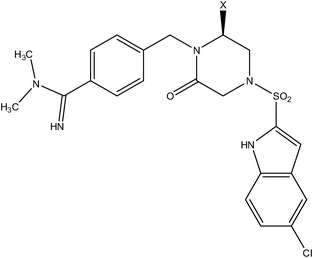
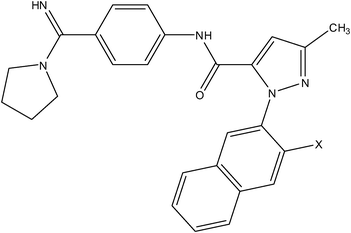
A series of structurally diverse compounds (anthranilamide benzamidine, piperazine, piperizinone, pyrazole, acrylamide, anilinesulfonamide and piperidine derivatives) exhibiting hERG blocking activity (Ki (μM)) were considered for the present analysis (Table 1).14 Only those compounds with defined hERG blocking activities were considered for the QSAR study and the remaining compounds (those that do not have defined activities (>10 μM)) in the series were omitted from the analysis (the presence of these compounds in this analysis can yield unstable or false positive QSAR models). Initially, the binding activities in molar units were converted to −logIC50 (pIC50) to reduce the skew of the data.| Compound number | R1 | R2 | R3 | R4 | Ki (hERG μM) | ||
|---|---|---|---|---|---|---|---|
| a hERG = human ether-a-go-go-related gene. | |||||||
| 1 |

|
H | H | –N(CH3)2 | 0.089 | ||
| 2 |

|
H | H | –N(CH3)2 | 0.071 | ||
| 3 |

|
H | H | –N(CH3)2 | 0.37 | ||
| 4 |

|
H | H | –N(CH3)2 | 4.6 | ||
| 5 |

|
H | H | –N(CH3)2 | 0.57 | ||
| 6 |

|
H | H | –N(CH3)2 | >10 | ||
| 7 | –CH2CH2COOCH3 | H | H | –N(CH3)2 | 0.79 | ||
| 8 | –CH2CH2COOH | H | H | –N(CH3)2 | >10 | ||
| 9 | –OCH2CO2C2H5 | H | H | –N(CH3)2 | 0.97 | ||
| 10 | –OCH2COOH | H | H | –N(CH3)2 | >10 | ||
| 11 | Cl | H | H |

|
0.016 | ||
| 12 | Cl | H | H |

|
>10 | ||
| 13 | Cl | H | H |

|
0.017 | ||
| 14 | Cl | H | H |

|
>10 | ||
| 15 | Cl | OCH3 | F |

|
0.051 | ||
| 16 | Cl | OCH3 | F |

|
>10 | ||
| 17 | Cl | H | H | –N(CH3)2 | 0.10 | ||
| 18 | Cl | H | H |

|
1.4 | ||
| 19 | Cl | H | H |

|
1.4 | ||
| 20 | Cl | H |

|
–N(CH3)2 | 0.14 | ||
| 21 | Cl | H |

|
–N(CH3)2 | >2.0 | ||
| 22 | Cl | H |

|
–N(CH3)2 | 1.6 | ||
| 23 | Cl | H |

|
–N(CH3)2 | >10 | ||
| 24 | Cl | H |

|
–N(CH3)2 | >6.6 | ||
| 25 | OCH3 | H |

|
–N(CH3)2 | 0.20 | ||
| 26 | OCH3 | H |

|
–N(CH3)2 | 0.60 | ||
| 27 | OCH3 | H |

|
–N(CH3)2 | >10 | ||
| Piperazine series | Piperizinone series |
|
|
| Compound number: 28–30 | Compound number: 31, 32 |
| Pyrazole series | Acrylamide series |
|
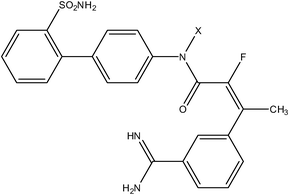
|
| Compound number: 33, 34 | Compound number: 35, 36 |
| Anilinesulfonamide series | Pyrazole series II |
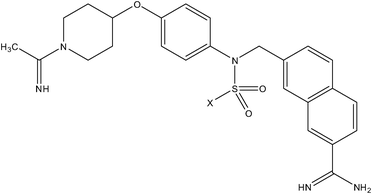
|
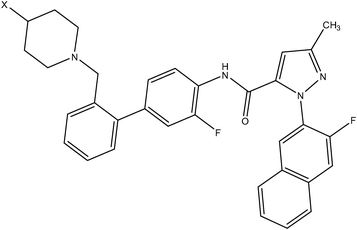
|
| Compound number: 37, 38 | Compound number: 39, 40 |
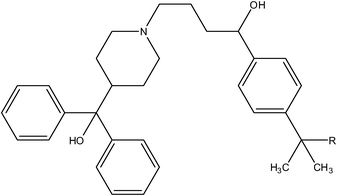
|
|
| Compound number: 41, 42 | |
| Compound number | X | Ki (hERG μM) |
|---|---|---|
| 28 |

|
0.60 |
| 29 |

|
>10 |
| 30 |

|
>10 |
| 31 | –COOC2H5 | 0.071 |
| 32 | –COOH | >10 |
| 33 | CN | 0.88 |
| 34 | –COOH | >10 |
| 35 | H | 0.53 |
| 36 | –CH2COOH | >10 |
| 37 | CH3 | 3.9 |
| 38 | –CH2COOH | >10 |
| 39 | H | 1.0 |
| 40 | –COOH | >10 |
| 41 (Terfenadine) | H | 0.056 |
| 42 (Fexofenadine) | –COOH | 23 |
The geometry of the sketched molecules was optimized using the semi-empirical MOPAC program and Hamiltonian Austin Model 1 (AM1) force field with 0.05 RMS gradients of the MOE software.15 The QuaSAR module of the MOE software16 and the Statistica software17 were used for the physicochemical descriptor calculation and the statistical analysis, respectively.
In this correlation analysis, the biological activity (hERG blockade) and the physicochemical descriptors were considered as dependent and independent variables, respectively. Initially, the data set was split into training (80%) and test sets (20%) using Statistica software (care was taken to achieve an even distribution of activities in both the sets (training and test)). In order to reduce the amount of redundant and useless information, descriptors that possessed zero correlation to the dependent variable (biological activity) as well as descriptors that showed intercorrelation superior to 0.5 were discarded. Partial least square (PLS) analysis was also performed to reduce the number of descriptors in the pool. Forward and backward stepwise regression analysis was performed on the data set to select the appropriate descriptors for multiple linear regression (MLR) model development. The significant models selected from the preliminary correlation analysis were validated by different validation techniques, such as leave one out (LOO), leave many out (LMO), bootstrapping (BS), Y-randomization and test set methods.18–20
Results and discussion
QSAR analysis provided significant internally consistent models, which are given below.Model 1
pIC50 = 0.0158 (±0.0034) SlogP_VSA9 −0.3609 (±0.0541) AM1_HOMO +1.7158 (±0.5708)
N = 20, R = 0.9038, R2 = 0.8169, AdjR2 = 0.7953, F(2,17,0.01) = 37.9190 (6.1120), SEE = 0.3642, t(17,0.005) = 3.0062 (2.8982), p = 0.0079, Beta values for AM1_HOMO =−0.700 and SlogP_VSA9 = 0.482.
Model 2
pIC50 =0.0158 (±0.0034) SlogP_VSA9 + 0.3609 (±0.0541) AM1_IP + 1.7158 (±0.5708)
N = 20, R = 0.9038, R2 = 0.8169, AdjR2 = 0.7953, F(2,17,0.01) = 37.9190 (6.1120), SEE = 0.3642, t(17,0.005) = 3.0062 (2.8982), p = 0.0079, Beta values for AM1_IP = 0.699 and SlogP_VSA9 = 0.482.
Model 3
pIC50 = 0.0176 (±0.0040) SlogP_VSA9 −0.0435 (±0.0077) PEOE_VSA-6 + 5.3961 (±0.3393)
N = 25, R = 0.8303, R2 = 0.6894, AdjR2 = 0.6611, F(2,22,0.01) = 24.4110 (5.7190), SEE = 0.4499, t(22,0.0005) = 15.9010 (3.7921), p = 0.0000, Beta values for PEOE_VSA-6 = −0.670 and SlogP_VSA9 = 0.520.
The QSAR models (1–3) developed using MLR analysis are biparametric in nature and the subdivided surface area descriptor (SlogP_VSA9) is the main contributor. Models 1 and 2 were developed with 20 compounds (training set) and the remaining 5 compounds were used as the test set to validate the predictivity (internal consistency) of the models. Model 3 was developed with the entire compounds in the data set (25), because the data set contains structurally diverse compounds and in some derivatives, a single compound possessed defined biological activity. The regression coefficient and other statistical parameters of the models 1 and 2 are the same, but the descriptors present in the models and their contributions are different, such as AM1_HOMO for model 1 (negative sign) and AM1_IP for model 2 (positive sign).
The correlation coefficient (R) is a significant parameter describing the goodness of fit of any data. The R values of the models 1 and 2 are 0.9038 and model 3 has 0.8303, which reveals that the selected models have considerable variation in their activity and the data have significant fit with the contributed descriptors. The Fischer values (F) and the ttest values are used to examine the confidence level in which the regression models are significant. The values within the parentheses that follow the calculated F values are the tabulated values at 99% significance. The F values indicate that the regression relations are not a chance fit but are a significant occurrence. t is the student ttest and the values within the parentheses after the calculated values are the tabulated t values at the 0.005 confidence level for models 1 and 2 and model 3 is significant at the 0.0005 confidence level. These values are comparable to their corresponding tabulated values, which shows that the models are statistically significant for further validation studies to confirm their reliability and robustness.
The significant QSAR models obtained from the analysis were further validated to investigate their internal consistency by LOO, LMO, BS, Y-randomization and test set validation methods. These methods examine the self consistency and reliability of the models, which implies a quantitative assessment of the model robustness and their predictive power. The results derived from the various validation methods are summarized in Table 2.
| Parameter | Models 1 and 2 | Model 3 | |
|---|---|---|---|
| Training | Test | ||
| R 2 | 0.8169 | 0.9210 | 0.6894 |
| R 2 (LOO) | 0.8785 | — | 0.8760 |
| R 2 (LMO) | 0.6637 | — | 0.6176 |
| R 2 ( BS ) | 0.7312 | — | 0.6147 |
| Q 2 (LOO) | 0.7482 | 0.5371 | 0.6288 |
| Q 2 (LMO) | 0.6338 | — | 0.6175 |
| Q 2 ( BS ) | 0.7291 | — | 0.6141 |
| PRESS | 3.1010 | 0.1883 | 5.3217 |
| S PRESS | 0.4271 | — | 0.4918 |
| SDEP | 0.3938 | 0.1941 | 0.4614 |
| R 2 0 | 0.9437 | — | 0.8592 |
| R 2 pred | — | 0.9224 | — |
| (R2 − R 2 0 )/R2 | −0.1552 | — | −0.2463 |
| K | 1.0000 | — | 1.0000 |
| K′ | 0.9974 | — | 0.9957 |
| Cooks (Max) | 0.4031 | — | 0.1107 |
| Cooks (Min) | 0.0001 | — | 0.0000 |
| Cooks ( Avg ) | 0.0606 | — | 0.0304 |
| D 2 (Max) | 6.1386 | — | 8.4777 |
| D 2 (Min) | 0.0312 | — | 0.1087 |
| D 2 ( Avg ) | 1.9000 | — | 1.9200 |
The QSAR models (1 and 2) developed with the training set compounds were used to predict the activities of the test set compounds. The predicted residual errors between the observed and the predicted activities of the compounds were analyzed using the following statistical parameters, such as SPRESS, SDEP and PRESS. The models (1 and 2) possessed low SPRESS (0.4271) and SDEP values (0.3938 for the training set and 0.1941 for the test set), which reveal that the models 1 and 2 have yielded small residual values. Model 3 has also provided low SPRESS and SDEP values (<0.5) as the models 1 and 2. It confirms that the models (1–3) have predicted the activities of the compounds (training and test) with small residual errors. The PRESS value is another statistical parameter used to investigate the residual error of prediction between the observed and the predicted activities. The training set models 1 and 2 have provided PRESS values near to 3, however the test set provided a value of 0.1883. Model 3 has given a value little higher than 5. The cross-validated correlation coefficient values (Q2) of the models are one of the important parameters that explain the predictive capacity of the models and are calculated from the PRESS values as 1 − (PRESS/Yobs − Yavg) (Table 2).
The cross-validated correlation coefficients values (Q2LOO,Q2LMO and Q2BS) for the training set models 1 and 2 are >0.72 calculated through all the validation methods except LMO (0.6338) and the Q2 values of the test set compounds (Q2test) are 0.5371. The complete set model (model 3) provided Q2 values from all the validation methods (Q2LOO, Q2LMO and Q2BS) >0.6. These obtained results reveal that the selected models have sufficient predictive power and self consistency (where Q2 > 0.5 it may be considered that the models possess sufficient predictive power). Additionally, at least one of the slopes of the regression lines (k or k′) should pass through the origin, indicated by values closer to 1. The calculated slopes of the regression lines (k and k′) are given in Table 2, which show that the models (1–3) have k and k′ values of 1 and close to 1, respectively. This shows that the slopes of the regression lines pass through the origin. Any QSAR models can be considered acceptable,20–23 if they satisfy all of the following conditions: (i) Q2 > 0.5, (ii) R2 > 0.6, (iii) R20 or R′20 is close to R2, such that [(R2 − R20)/R2] or [(R2 − R′20)/R2] < 0.1 and 0.85 ≤ k ≤ 1.15 or 0.85 ≤ k′ ≤ 1.15.
The predictabilities of the models were also confirmed by additional validation parameters such as R20 and R2pred. The calculated R20 values (calculated from the regression equation without intercept values) of the compounds are near to their corresponding R2 values and the (R2 − R20)/R2 values are <0.1. The R2pred values (0.9224) provide the external predictive ability (test set) of the models. However, the results obtained from various validation studies show that the calculated statistical parameters of the models satisfy the conditions stated as above. They also confirm that the selected models have predicted the activities with small residual errors and which are comparable with their observed activities (Table 3).
| Compound number | pIC50 | Models 1 and 2 | Model 3 | ||||||
|---|---|---|---|---|---|---|---|---|---|
| Normal | LOO | LMO | BS | Normal | LOO | LMO | BS | ||
| a Test compounds, LOO: leave one out, LMO: leave many out, BS: bootstrapping. | |||||||||
| 1 | 7.05 | 6.40 | 7.74 | 6.40 | 6.39 | 6.73 | 7.39 | 6.66 | 6.70 |
| 2 | 7.15 | 6.51 | 7.83 | 6.42 | 6.45 | 6.62 | 7.71 | 6.54 | 6.56 |
| 3 | 6.43 | 6.46 | 6.40 | 6.52 | 6.49 | 6.73 | 6.12 | 6.79 | 6.74 |
| 4 | 5.34 | 5.20 | 5.54 | 5.09 | 5.11 | 5.55 | 5.09 | 5.55 | 5.58 |
| 5 | 6.24 | 6.45 | 6.00 | 6.51 | 6.52 | 6.13 | 6.37 | 6.09 | 6.12 |
| 7 | 6.10 | 6.30 | 5.85 | 6.39 | 6.34 | 6.05 | 6.16 | 6.03 | 6.04 |
| 9 | 6.01a | 6.22 | — | — | — | 6.62 | 5.38 | 6.89 | 6.73 |
| 11 | 7.79 | 7.47 | 8.19 | 7.36 | 7.42 | 7.32 | 8.36 | 7.22 | 7.27 |
| 13 | 7.77 | 7.47 | 8.14 | 7.64 | 7.48 | 7.32 | 8.30 | 7.15 | 7.20 |
| 15 | 7.29 | 7.76 | 6.59 | 8.01 | 7.94 | 7.57 | 6.89 | 7.34 | 7.51 |
| 17 | 7.00 | 6.95 | 7.05 | 6.88 | 6.93 | 6.85 | 7.16 | 6.77 | 6.81 |
| 18 | 5.85 | 6.13 | 5.55 | 6.11 | 6.20 | 5.67 | 6.07 | 5.63 | 5.71 |
| 19 | 5.85a | 6.07 | — | — | — | 5.67 | 6.07 | 6.37 | 5.88 |
| 20 | 6.85 | 7.03 | 6.66 | 5.68 | 6.62 | 6.89 | 6.81 | 6.82 | 6.88 |
| 22 | 5.79 | 5.85 | 5.74 | 5.76 | 5.91 | 5.72 | 5.89 | 5.74 | 5.78 |
| 25 | 6.70 | 6.32 | 7.14 | 6.20 | 6.25 | 6.19 | 7.27 | 6.08 | 6.14 |
| 26 | 6.22 | 6.89 | 5.51 | 6.96 | 6.93 | 6.67 | 5.75 | 6.71 | 6.68 |
| 28 | 6.22 | 6.12 | 6.34 | 6.17 | 6.12 | 6.52 | 5.90 | 6.58 | 6.54 |
| 31 | 7.15 | 7.00 | 7.30 | 7.06 | 7.03 | 6.88 | 7.43 | 6.93 | 6.91 |
| 33 | 6.06 | 6.29 | 5.72 | 6.45 | 6.63 | 6.02 | 6.10 | 6.10 | 6.05 |
| 35 | 6.28a | 6.36 | — | — | — | 6.29 | 6.26 | 6.56 | 6.38 |
| 37 | 5.41a | 5.13 | — | — | — | 6.39 | 4.36 | 7.03 | 6.65 |
| 39 | 6.00a | 6.11 | — | — | — | 6.87 | 5.07 | 6.91 | 6.88 |
| 41 | 7.25 | 7.37 | 7.11 | 7.49 | 7.44 | 6.48 | 8.09 | 6.36 | 6.43 |
| 42 | 4.64 | 4.93 | 4.17 | 5.01 | 5.17 | 4.71 | 4.52 | 4.71 | 4.77 |
The models were further validated by applying the Y-randomization test. Thus, for each original model, the randomization experiments yield R2 values for possible comparison with the original R2. If the original QSAR model is statistically significant, its score should be significantly better than those from permuted data. The R2 values for 20 trials based on permuted data are shown in Fig. 1. The R2 values of the original models are higher (trial 1 in Fig. 1) than any of the trials using permuted data (trials 2–21 in Fig. 1). Hence, the models are statistically significant and robust. The validation results obtained from various validation studies reveal that the models are statistically significant and have significant predictive capacity and robustness.
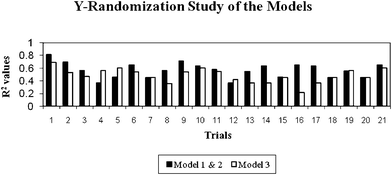 | ||
| Fig. 1 Y-Randomization results derived from the selected models (the first trial value is the real R2 value and the remaining trials (2–21) are R2 values calculated from the permuted data). | ||
Distance based approaches are also a way of validating any QSAR models. Cook’s distances indicate the distances between the computed B values (standard coefficient values) and the values one would have obtained if the respective case had been excluded (leave one out). All distances should be of about equal magnitude, otherwise there is a reason to believe that the respective case (s) biased the estimation of the regression coefficients.24,25 The maximum Cook’s distance values of the models are <0.4, which is <1 (squared Cook’s distances),24,25 and the Cook’s distances of all the compounds have almost equal magnitude (<1), showing that the equation has significant predictive ability (Table 2).
Mahalanobis distances (D2) identify the interpolation region by assuming that the data have a normal distribution. Mahalanobis distances improve the prediction accuracy and speed up a solution for QSAR. The higher the Mahalanobis distances for a case (molecule), the more the independent variables diverge from the average values. That compound may be considered an outlier in the series or biases the model building and activity prediction. The models posses maximum D2 values <8.4 and the average D2 values are <2, showing that the data points in the models do not widely deviate from the average observed activity values.
The multicollinearity and the serial autocorrelation of the models and the descriptors, respectively provide information on the stability, reliability and robustness of the models. Multicollinearity is a statistical phenomenon used in multiple regression models in which two or more predictor descriptors are highly correlated. To confirm the absence of multicollinearity, the variance inflation factor (VIF) was calculated for each parameter in the regression equations. Not uncommonly, a VIF of 10 or even one as low as 4 (equivalent to a tolerance level of 0.10 or 0.25) have been used as a rule of thumb to indicate excessive or serious multicollinearity.26 In the selected models (1–3), the VIF values are near to 1, showing that the descriptors in the models are free from multicollinearity i.e. none of the independent variables in the models are collinear with other independent variables in the models (Table 4).25,26
| Models | Descriptors | Toleran. | R 2 | VIF a | Durbin–Watson | |
|---|---|---|---|---|---|---|
| Calculated | Tabulated | |||||
| a VIF: variance inflation factor. | ||||||
| Model 1 | AM1_HOMO | 0.9799 | 0.0201 | 1.0205 | 2.1911 | 1.1000–1.5370 |
| SlogP_VSA9 | 0.9799 | 0.0201 | 1.0205 | |||
| Model 2 | AM1_IP | 0.9799 | 0.0201 | 1.0205 | 2.1911 | 1.1000–1.5370 |
| SlogP_VSA9 | 0.9799 | 0.0201 | 1.0205 | |||
| Model 3 | PEOE_VSA-6 | 0.9977 | 0.0023 | 1.0025 | 1.4011 | 1.2060–1.5500 |
| SlogP_VSA9 | 0.9977 | 0.0023 | 1.0025 | |||
A Durbin–Watson (DW) test was employed to check the autocorrelation of residuals (correlation of adjacent residuals). The tabulated upper and lower bound values of DW were considered to test the hypothesis of zero autocorrelation against the positive and negative autocorrelations.25–27 In the present study, the DW values of the models are higher than the tabulated upper and lower bound values at a 5% significance level (Table 4) and the values are closer to 2 for models 1 and 2 and 1.4 for model 3, showing that the models do not have a serious autocorrelation problem.
The validation results obtained from the studies and other statistical parameters calculated from the stability studies (multicollinearity and autocorrelation) show that the developed (selected) models are robust, reliable and statistically significant.
Applicability of the descriptors
The model 1 was developed with the subdivided surface area and MOPAC type descriptors such as SlogP_VSA9 and AM1_HOMO respectively. The subdivided surface area descriptors, describe an approximate accessible van der Waals (vdW) surface area (in Å2) calculation for each atom, vi, along with another atomic property, pi (partition coefficient or molar refractivity). SlogP_VSA9 is defined to be the sum of the vi over all atoms i (calculated with Li > 0.4) and the atomic property pi (logP) for atom i as calculated in the SlogP descriptor (calculated with the Wildman and Crippen SlogP method).16,28 The partition coefficient (logP) of a small molecule can be calculated as the sum of the contributions of each of the atoms in the molecule using the following eqn (1):| Pcalc = ∑niai | (1) |
The second descriptor contributed in the model is MOPAC type descriptor (AM1_HOMO), calculating the energy (eV) of a molecule at the highest occupied molecular orbital (HOMO) using the AM1 Hamiltonian of the MOPAC package. It is a popular quantum mechanical descriptor which plays a major role in governing many chemical reactions and the energy of the HOMO is directly related to the electron affinity and characterizes the susceptibility of the molecule towards attack by electrophiles (this occupied MO that can donate an electron). It is a global molecular property that describes the nucleophilicity of a compound and it measures the ability of a molecule to act as an electron donor. Lower HOMO values lead to weaker nucleophilicity. The negative contribution of this descriptor explains that the decreased HOMO values reduce the electronegative properties of the groups/molecule. This reveals that the active region of the protein may have some negatively charged groups, which may act as a nucleophile in interactions.
The model 2 was developed with the same subdivided surface area descriptor (SlogP_VSA9) as model 1 and a MOPAC descriptor, AM1_IP. AM1_IP signifies the ionization potential (kcal mol−1) of a molecule calculated using the AM1 Hamiltonian. The positive sign of the regression coefficient of the descriptor suggests that a higher (increased) ionization potential is favourable for hERG blocking activity.
The partial charge descriptor (PEOE_VSA-6) present in model 3, provides the partial charge of an atom (qi) on the vdW surface area (Å2) of an atom (vi). It is calculated in a range of qi (partial charge of an atom i) values less than −0.30. These PEOE_VSA descriptors use the PEOE method for partial charge calculation. Partial equalization of orbital electronegativities (PEOE) is a method of calculating atomic partial charges, in which the charge is transferred between bonded atoms until equilibrium. The amount of charge transferred at each iteration is damped with an exponentially decreasing scale factor to guarantee convergence. The amount of charge transferred, dqij, between atoms i and j when Xi > Xj is:
| dqij = (1/2k) (Xi − Xj)/Xj+ | (2) |
The results derived from the analysis show that the polar property (positive charge) of the vdW surface of the molecules is important for the hERG blocking activity. This is supported by the contributing descriptors in the selected models such as AM1_HOMO, AM1_IP and PEOE_VSA6, which describe the importance of the polar properties (positive charge) for hERG blocking activities. The SlogP_VSA9 descriptor also suggests that the optimum partition coefficient and the presence of polar atoms in the molecules are favourable for the hERG blocking effect.
In the selected models, the partition coefficient descriptor (SlogP_VSA9) is an important descriptor responsible for activity prediction with other contributing descriptors (electrostatic). Hence, the role of fragments/substituents in the variation in the partition coefficient (logPo/w) and the hERG blocking activity was analyzed (calculated (logPo/w) values provided in Table 5). In this data set, the compounds 1–27 are made up of an anthranilamide benzamidine nucleus as the parent structure and most of the derivatives possessing this nucleus exhibit well defined activity. The topological structural analysis shows that a number of compounds in the data set were substituted with aromatic rings (phenyl or piperidine) in the anthranilamide nucleus of the molecules. Where the phenyl ring is connected with the parent structure by a sulfide bridge, the partition coefficient values are higher than 5 and where it is connected by an oxygen bridge the structures possessed partition coefficient values of a little less than 5. The compounds substituted with non-aromatic substituents have logPo/w values between 3–3.5. This shows that lowering the partition coefficient values in these compounds (1–27) leads to variation in the hERG blocking activities. In addition, the substituents in the aromatic phenyl ring play an important role in varying hERG blocking activity. In this series, the compounds substituted with COOH groups possessed lower activity than their corresponding esterified derivatives and the partition coefficients of these COOH group-containing compounds are comparatively lower than those of their corresponding esterified compounds. These results agree with the QSAR results, such that the negative charge on the molecules is detrimental for the hERG blocking activity. The compounds substituted with non-aromatic substituents and either COOH or esterified groups provided variation in logPo/w values, which caused differences in activities.
| Compound number | Biological activity | logP(o/w) | SlogP_VSA9RC/PEOE_VSA-6RC |
|---|---|---|---|
| 1 | 7.0506 | 5.6180 | −112.9830 |
| 2 | 7.1487 | 5.5590 | −11.1367 |
| 3 | 6.4318 | 5.1140 | −112.9830 |
| 4 | 5.3372 | 5.4160 | −1.1286 |
| 5 | 6.2441 | 4.9230 | −4.1921 |
| 6 | — | 4.7800 | −0.7402 |
| 7 | 6.1024 | 3.4890 | −6.4434 |
| 8 | — | 3.3460 | −0.6530 |
| 9 | 6.0132 | 3.1897 | −6.3435 |
| 10 | — | 2.9540 | −0.6693 |
| 11 | 7.7959 | 4.5510 | −17.0006 |
| 12 | — | 4.0670 | −1.2309 |
| 13 | 7.7696 | 4.5510 | −17.0006 |
| 14 | — | 4.0670 | −1.2309 |
| 15 | 7.2924 | 4.7300 | −10.4887 |
| 16 | — | 4.2460 | −1.4012 |
| 17 | 7.0000 | 3.9640 | −123.2230 |
| 18 | 5.8539 | 3.5900 | −1.2309 |
| 19 | 5.8539 | 4.1200 | −1.2309 |
| 20 | 6.8539 | 4.8880 | −127.2970 |
| 21 | — | 4.6350 | −1.2716 |
| 22 | 5.7959 | 4.0170 | −1.2716 |
| 23 | — | 4.0170 | −1.2716 |
| 24 | — | 4.0700 | −1.2716 |
| 25 | 6.6990 | 4.2520 | −7.6087 |
| 26 | 6.2218 | 3.8650 | −6.5547 |
| 27 | — | 3.3810 | −0.7065 |
| 28 | 6.2218 | 2.0730 | −11.3806 |
| 29 | — | 2.6100 | −1.0501 |
| 30 | — | 2.6100 | −1.0501 |
| 31 | 7.1487 | 2.8440 | −14.6914 |
| 32 | — | 2.3600 | −0.8587 |
| 33 | 6.0555 | 3.9940 | −106.6470 |
| 34 | — | 4.1320 | −0.5353 |
| 35 | 6.2757 | 3.4410 | −150.8630 |
| 36 | — | 3.2640 | −0.7611 |
| 37 | 5.4089 | 3.9870 | −2.5621 |
| 38 | — | 3.6130 | −0.9003 |
| 39 | 6.0000 | 7.3630 | −249.5800 |
| 40 | — | 6.4920 | −1.2528 |
| 41 | 7.2518 | 7.6530 | −2.6038 |
| 42 | 4.6383 | 7.4160 | −0.6320 |
In compounds 11–16, the piperidine ring has been substituted by a phenyl ring (benzamidine) in the molecule and these compounds have partition coefficient values >4, but compounds 17–19 do not have aromatic substitution yet have considerable activity like the earlier compounds. Among the latter, compounds 18 and 19, substituted with a COOH group, exhibit different partition coefficient values but have similar activities. Compound 17 does not have an aromatic ring and COOH groups, however, it has significant hERG blocking activity due to the partition coefficient. Among the compounds substituted with a piperidine ring (20–27), compounds 20, 25 and 26 do not have COOH groups in their structure, but have comparable partition coefficient values to earlier compounds (1–19). These show that the molecules with aromatic substitution, esterified COOH groups and higher partition coefficients than their corresponding COOH substituted compounds exhibit significant hERG binding capability.
The compounds constructed with piperazine and piperazinone nuclei (28–32) have partition coefficient values ranging between 2 and 2.8. Among these, compound 28 has a lower partition coefficient value (2.07), but has better activity than its analogs in the series (29 and 30). This may be due to the presence of the morpholine ring in compound 28 and the COOH group in other compounds (29 and 30). The partition coefficient difference between compounds 31 and 32 is 0.5. Likewise, compounds 33 and 34 have a partition coefficient difference of 0.13. The differences in the partition coefficient values give rise to variation in the activities of these compounds. Compounds 39 and 40 have a pyrazole nucleus as have 33 and 34, but have higher partition coefficient values than the latter compounds (33 and 34). This may be due to the presence of aromatic rings (phenyl or piperidine) in their structure.
Compounds composed of the acrylamide and the anilinesulfonamide nucleus also provide similar results to other compounds discussed earlier. The variation in partition coefficient values of these compounds (difference of 0.2–0.3) causes an activity difference. This activity variation is also due to the effect of free COOH groups present in the molecules. These fragmental analysis results show that the partition coefficient is not a single factor determining the binding properties of the molecules. Additionally, the free COOH groups also determine the activities of the compounds by decreasing the partition coefficient or increasing the polar property (negative charge) of the molecules.
The combined results of the QSAR and the fragmental analysis demonstrate that the highest electron content in the molecular orbital of the molecule is detrimental for the activity. Also they have shown that the presence of negatively charged groups can reduce the binding affinity of the molecules. This reveals that the active site of the protein may have some negatively charged polar groups for interaction with the molecules. The fragmental analysis also suggests that the presence of aromatic substitution is important for the activity. These results agree with the earlier work performed in our laboratory that showed that the presence of an aromatic ring and the distance between the aromatic ring and the other polar centre on a molecule are important for hERG blocking activity31 (also unpublished data). From the reported studies, it can be seen that the active site of the hERG protein has T623 (tryptophan), Y652 (tyrosine) and F656 (phenyl alanine) residues.5 This explains why interactions can occur between the polar groups of the molecules and the carbonyl oxygen of hERG residue T623 (tryptophan) by hydrogen bonding; an aromatic moiety in a molecule makes a π–π interaction with the aromatic residue and a hydrophobic group in the molecule forms a hydrophobic interaction with the benzene ring of the residue.5 This shows that the active site of the protein is comprised of polar and aromatic residues. The fragmental analysis and QSAR analysis show that the partition coefficient (aromatic property also) and the negative charge (detrimental) on the vdW surface of the molecules are mainly responsible for the hERG blocking activity.
In order to interpret the effect of physicochemical descriptors of a given compound on the hERG blocking activity, we have multiplied the descriptor values with their respective regression coefficients (SlogP_VSA9 × regression coefficient (SlogP_VSA9RC) and PEOE_VSA-6 x regression coefficient (PEOE_VSA6RC)) (Table 5). As both the contributors have different signs, the module of the ratio SlogP_VSA9RC/PEOE_VSA-6RC was determined to assess for each individual compound the relative importance of the contributions arising for each compound in the global molecule's activity. The calculated ratio values provided significant results for the interpretation of the relative contribution to the hERG blocking action. The values show that the compounds which have low activity or inactive against the hERG target possessed lower ratio values than other active compounds. The inactive compounds in the series have maximum values of 1.2716 and the active compounds in the series have values between 2 and 250. The major variations in these ratio values are due to the impact of the negative charge descriptor (PEOE_VSA-6) rather than the SlogP_VSA9 descriptor. The most active compounds (11 and 13) in the series possessed values of 17 and other significantly active compounds exhibited values between 10 and 20. This reveals that the optimum ratio values for a better activity should lie between these values (10–20). It also illustrates that lower ratio values cause poor binding. It is interesting to note that the structurally diverse compounds also provided significant values. This confirms that the combined effect of these properties is favourable for the hERG blocking activity of these compounds.
This work concludes that the developed QSAR models are significant and the fragmental analysis shows that aromatic rings are favourable and a negative charge on a molecule is unfavourable for hERG blocking activity. The descriptors contributing to the models show that the hERG blocking effect of a compound depends upon a lower negative charge (AM1_HOMO, AM1_IP and PEOE_VSA-6) and an optimum partition coefficient (SlogP_VSA9). Aromatic substitution in a molecules also has an impact on the variation of the partition coefficient. These studies confirm that the presence of a less negatively charged group with aromatic rings is favourable for hERG blocking activity. Hence, in the early stages of drug discovery, it may be considered that a lower number of aromatic rings in a structure and negatively charged groups can improve the drug design research.
Acknowledgements
One of the authors N.S.H.N. Moorthy is grateful to the Fundaçao para a Ciencia e Technologia (FCT), Portugal, for a Postdoctoral Grant (SFRH/BPD/44469/2008).References
- D. C. Beshore, N. J. Liverton, C. J. McIntyre, C. F. Claiborne, B. Libby, J. C. Culberson, J. J. Salata, C. P. Regan, J. J. Lynch, L. Kiss, R. Spencer, S. S. Kane, R. B. White, S. Yeh, G. D. Hartman and C. J. Dinsmore, Discovery of triarylethanolamine inhibitors of the Kv1.5 potassium channel, Bioorg. Med. Chem. Lett., 2010, 20, 2493–2496 Search PubMed.
- C. Jamieson, E. M. Moir, Z. Rankovic and G. Wishart, Medicinal chemistry of hERG optimization: Highlights and Hang-ups, J. Med. Chem., 2006, 49(17), 5029–5049 CrossRef CAS.
- M. C. Sanguinetti and J. S. Mitcheson, Predicting drug–hERG channel interactions that cause acquired long QT syndrome, Trends Pharmacol. Sci., 2005, 26(3), 119–124 Search PubMed.
- A. M. Brown, Drugs, hERG and sudden death, Cell Calcium, 2004, 35, 543–547 CrossRef CAS.
- H. Choe, K. H. Nah, S. N. Lee, H. S. Lee, H. S. Lee, S. H. Jo, C. H. Leem and Y. J. Jang, A novel hypothesis for the binding mode of hERG channel blockers, Biochem. Biophys. Res. Commun., 2006, 344, 72–78 Search PubMed.
- M. Perry, M. J. de Groot, R. Helliwell, D. Leishman, M. Tristani-Firouzi, M. C. Sanguinetti and J. Mitcheson, Structural determinants of hERG channel block by clofilium and ibutilide, Mol. Pharmacol., 2004, 66, 240–249 Search PubMed.
- N. S. H. N. Moorthy and P. Trivedi, QSAR modelling of some 2-methoxy acridones: cytotoxic in multi drug resistant cells, Int. J. Cancer Res., 2006, 2, 267–276 Search PubMed.
- P. M. Kumar, C. Karthikeyan, N. S. H. N. Moorthy and P. Trivedi, Quantitative structure activity relationships of selective antagonists of glucagons receptor using QuaSAR descriptors, Chem. Pharm. Bull., 2006, 54, 1586–1591 Search PubMed.
- N. S. H. N. Moorthy, C. Karthikeyan and P. Trivedi, QSAR studies on cytotoxic acridine 5,7 diones: A comparative study using P_VSA descriptors and topological descriptors, Indian J. Chem., Sect. B: Org. Chem. Incl. Med. Chem., 2007, 46B, 177–184 Search PubMed.
- L. Du, M. Li, Q. You and L. Xia, A novel structure-based virtual screening model for the hERG channel blockers, Biochem. Biophys. Res. Commun., 2007, 355, 889–894 Search PubMed.
- L. P. Du, K. C. Tsai, M. Y. Li, Q. D. You and L. Xia, The pharmacophore hypotheses of I(Kr) potassium channel blockers: novel class III antiarrhythmic agents, Bioorg. Med. Chem. Lett., 2004, 14, 4771–4777 Search PubMed.
- K. Yoshida and T. Niwa, Quantitative structure–activity relationship studies on inhibition of hERG potassium channels, J. Chem. Inf. Model., 2006, 46, 1371–1378 Search PubMed.
- M. Seierstad and D. K. Agrafiotis, A QSAR model of hERG binding using a large, diverse, and internally consistent training set, Chem. Biol. Drug Des., 2006, 67, 284–296 Search PubMed.
- B. Y. Zhu, Z. J. Jia, P. Zhang, T. Su, W. Huang, E. Goldman, D. Tumas, V. Kadambi, P. Eddy, U. Sinha, R. M. Scarborougha and Y. Song, Inhibitory effect of carboxylic acid group on hERG binding, Bioorg. Med. Chem. Lett., 2006, 16, 5507–5512 Search PubMed.
- MOE, Molecular modelling package, Chemical Computing Group Inc., Montreal, Canada, 2002 Search PubMed.
- A. Lin, QuaSAR-descriptors. J. Chem. Comput. Group, 2002, http://www.chemcomp.com Search PubMed.
- Statistica 8.0 statistical software, StatSoft, Inc., Tulsa, OK, USA, 2008 Search PubMed.
- N. S. H. N. Moorthy, M. J. Ramos and P. J. Fernandes, Analysis of α-glucosidase inhibitory activity of chromenone derivatives by its molecular features: A computational study, Med. Chem., 2011 Search PubMed , in press.
- A. Golbraikh and A. Tropsha, Beware of Q2, J. Mol. Graphics Modell., 2002, 20, 269–276 CrossRef CAS.
- P. P. Roy and K. Roy, On some aspects of variable selected for partial least squares regression models, QSAR Comb. Sci., 2008, 27, 302–313 CrossRef CAS.
- N. S. H. N. Moorthy, S. F. Sousa, M. J. Ramos and P. A. Fernandes, Structural feature study of benzofuran derivatives as farnesyltransferase inhibitors, J. Enzyme Inhib. Med. Chem., 2011 DOI:10.3109/14756366.2011.552885.
- R. Kiralj and M. M. C. Ferreira, Basic validation procedures for regression models in QSAR and QSPR studies: Theory and applications, J. Braz. Chem. Soc., 2009, 20, 770–787 Search PubMed.
- P. Gramatica, Principle of QSAR model validation: Internal and external, QSAR Comb. Sci., 2007, 26, 694–701 Search PubMed.
- R. Cook and Dennis, Influential observation in linear regression, J. Am. Stat. Assoc., 1979, 74, 169–174.
- N. S. H. N. Moorthy, N. M. Cerquira, M. J. Ramos and P. A. Fernandes, QSAR analysis of 2-benzoxazolyl hydrazone derivatives for anticancer activity and its possible target prediction, Med. Chem. Res., 2011 DOI:10.1007/s00044-010-9510-3.
- N. S. H. N. Moorthy, M. J. Ramos and P. A. Fernandes, QSAR analysis of isosteviol derivatives as α-glucosidase inhibitors with element count and other descriptors, Lett. Drug Des. Discovery, 2011, 8(1), 14–25 Search PubMed.
- J. Durbin and G. S. Watson, Testing for serial correlation in least squares regression. 1, Biometrika, 1950, 37, 409–428 CAS.
- S. A. Wildman and G. M. Crippen, Prediction of physicochemical parameters by atomic contributions, J. Chem. Inf. Model., 1999, 39, 868–873 CrossRef CAS.
- R. S. Mulliken, A. new electroaffinity scale; together with data on valence states and on valence ionization potentials and electron affinities, J. Chem. Phys., 1934, 2, 782–793 CAS.
- J. Gasteiger and M. Marsili, Iterative partial equalization of orbital electronegativity – A rapid access to atomic charges, Tetrahedron, 1980, 36, 3219–3228 CrossRef CAS.
- N. S. H. N. Moorthy, S. F. Sousa, M. J. Ramos and P. A. Fernandes, In silico based structural analysis of arylthiophene derivatives for FTase inhibitory activity, hERG and other toxic effects, J. Biomol. Screening, 2011 DOI:10.1177/1087057111414899.
| This journal is © The Royal Society of Chemistry 2011 |

