Electrical, optical, and thermoelectric properties of Ga2O3(ZnO)9†‡
Yuichi
Michiue
*a,
Takao
Mori
a,
Anastasiia
Prytuliak
a,
Yoshitaka
Matsushita
b,
Masahiko
Tanaka
b and
Noboru
Kimizuka
c
aNational Institute for Materials Science, 1-1 Namiki, Tsukuba, Ibaraki 305-0044, Japan. E-mail: MICHIUE.Yuichi@nims.go.jp; Fax: ;81-29-860-4662; Tel: +81-29-860-4662
bNational Institute for Materials Science, Sayo-cho, Sayo, Hyogo 679-5148, Japan
cDepartment of Chemical Engineering and Materials Science, Yuan Ze University, 135 Yuantung Road, Neili, Chungli, Taoyuan 32003, Taiwan
First published on 27th October 2011
Abstract
The physical properties of the sintered sample of Ga2O3(ZnO)9, a member of the homologous series Ga2O3(ZnO)m and recently found to have new structures, were investigated. The material was found to be a new transparent conducting oxide, and is composed of relatively abundant and inexpensive elements compared to indium. The electrical conductivity of a sintered low 57% density sample, 13 S cm−1 as fired at 1723 K, could be varied by postheating in air or a reducing gas (H2 3%![[thin space (1/6-em)]](https://www.rsc.org/images/entities/char_2009.gif) :
:![[thin space (1/6-em)]](https://www.rsc.org/images/entities/char_2009.gif) Ar 97%) flow. The changes in conductivity were associated with the variations of absorbance in the visible light range, while the optical band gap, or the absorption edge, was almost unchanged. The thermoelectric properties showed n-type behavior. It was relatively easy to vary the thermoelectric properties through redox treatments, and reversibility was also observed. The maximum figure of merit Z reaches a value of close to 10−4 K−1 at 660 K for a sample with density of only 73%. The potential of Ga2O3(ZnO)9 as a thermoelectric material appears to be similar to or even greater than the related In2O3(ZnO)m system, and since Ga2O3(ZnO)9 has an advantage in the abundance of constituent elements, it is revealed to be a promising system for further investigations.
Ar 97%) flow. The changes in conductivity were associated with the variations of absorbance in the visible light range, while the optical band gap, or the absorption edge, was almost unchanged. The thermoelectric properties showed n-type behavior. It was relatively easy to vary the thermoelectric properties through redox treatments, and reversibility was also observed. The maximum figure of merit Z reaches a value of close to 10−4 K−1 at 660 K for a sample with density of only 73%. The potential of Ga2O3(ZnO)9 as a thermoelectric material appears to be similar to or even greater than the related In2O3(ZnO)m system, and since Ga2O3(ZnO)9 has an advantage in the abundance of constituent elements, it is revealed to be a promising system for further investigations.
Introduction
ZnO is one of the most useful ceramics, and the electrical properties of doped ZnO have been intensively studied so far. Conductivity is generally enhanced for ZnO doped with trivalent metal ions, such as Al, Ga, etc.. Electrical conductivity as high as 300 S cm−1 is reported for Ga-doped ZnO powders,1 for example. When the amount of doping ions exceeds the solubility limit, a series of compounds with long-period structures are formed in some cases; these are homologous phases. ZnO-based homologous phases M2O3(ZnO)m (M = In, Fe, Ga) were reported,2–4 where m is an integer. In2O3(ZnO)m has layered structures isotypic to LuFeO3(ZnO)m,5 although incommensurate modulations in the In/Zn occupation were also observed in In2O3(ZnO)m.6Fe2O3(ZnO)m can be explained as superstructures of the In2O3(ZnO)m type.3 On the other hand, the structure of Ga2O3(ZnO)m, which was first examined by high-resolution transmission electron microscopy7 and recently determined,8 is fundamentally different from the In2O3(ZnO)m type. First-principle calculations were carried out for Ga2O3(ZnO)69 and a unified description for the crystal structures of the series Ga2O3(ZnO)m was presented using higher-dimensional crystallography.10 Properties of the homologous series Ga2O3(ZnO)m have never been reported as far as we know. Indeed the development of new processes to obtain thin films or various architectures in nano-order size of well-established ceramics materials such as ZnO and TiO2 is attractive in recent trends, but the investigation of new materials with untypical structures is still important in the field of materials chemistry.Transparent conducting oxides (TCO) are important as optoelectronic devices for displays, solar cells, and so on.11 Most applications of TCO require films. Powder materials are also useful as additives to polymers and papers to prevent build up of static electricity. Although tin-doped indium oxide (ITO) has been the most widely used TCO, Al- and Ga-doped ZnO are extensively studied as alternative materials to ITO, because indium is expensive. Also, much attention has been paid for the homologous series In2O3(ZnO)m because of their potential use as a TCO.12 It is of interest to examine the electrical and optical properties of Ga2O3(ZnO)m, because of their potential use as a TCO analogous with ZnO and In2O3(ZnO)m.
On the other hand, for efficient energy usage there is a large incentive to develop thermoelectric materials which can effectively directly convert waste heat to electricity. Bi2Te3 is a well known thermoelectric material,13 however, it cannot be used at mid to high temperature ranges. To this end, compounds such as boron carbide,14Si![[thin space (1/6-em)]](https://www.rsc.org/images/entities/char_2009.gif) :
:![[thin space (1/6-em)]](https://www.rsc.org/images/entities/char_2009.gif) Ge,15 and recently, newly designed boron cluster-based compounds,16–18oxides,19–25 silicides26,27 are being extensively studied. This new series of oxides, Ga2O3(ZnO)m is of interest for several reasons. First of all, the related compounds of doped ZnO25 and In2O3(ZnO)m22–24 have been found to exhibit the highest power factors among n-type oxides. Secondly, the new oxides are a homologous series and it is known that this can be a built-in way to reduce the thermal conductivity which is another critical factor in the thermoelectric figure of merit. In2O3(ZnO)m has yielded promising results.22–24 The thermal conductivity of In2O3(ZnO)m was demonstrated to be lowered as the m was increased from m = 5, 7, 9.22 Doping and texturing were also shown to improve the properties.23,24 These factors motivated us to investigate the thermoelectric properties of this new series of gallium oxides, which have recently been determined to have a different structure from any of the known ZnO related compounds, despite the similarity in composition with In2O3(ZnO)m, for example.10 As an important novel point we have also effectively controlled the oxidation of the samples and demonstrated its large effect on the thermoelectric properties.
Ge,15 and recently, newly designed boron cluster-based compounds,16–18oxides,19–25 silicides26,27 are being extensively studied. This new series of oxides, Ga2O3(ZnO)m is of interest for several reasons. First of all, the related compounds of doped ZnO25 and In2O3(ZnO)m22–24 have been found to exhibit the highest power factors among n-type oxides. Secondly, the new oxides are a homologous series and it is known that this can be a built-in way to reduce the thermal conductivity which is another critical factor in the thermoelectric figure of merit. In2O3(ZnO)m has yielded promising results.22–24 The thermal conductivity of In2O3(ZnO)m was demonstrated to be lowered as the m was increased from m = 5, 7, 9.22 Doping and texturing were also shown to improve the properties.23,24 These factors motivated us to investigate the thermoelectric properties of this new series of gallium oxides, which have recently been determined to have a different structure from any of the known ZnO related compounds, despite the similarity in composition with In2O3(ZnO)m, for example.10 As an important novel point we have also effectively controlled the oxidation of the samples and demonstrated its large effect on the thermoelectric properties.
Experimental
Metal oxides in molar ratios Ga2O3![[thin space (1/6-em)]](https://www.rsc.org/images/entities/char_2009.gif) :
:![[thin space (1/6-em)]](https://www.rsc.org/images/entities/char_2009.gif) ZnO = 1
ZnO = 1![[thin space (1/6-em)]](https://www.rsc.org/images/entities/char_2009.gif) :
:![[thin space (1/6-em)]](https://www.rsc.org/images/entities/char_2009.gif) 9 were mixed in an agate motor, and heated at 1723 K for 4 days in an unsealed Pt tube. The samples were taken out of the furnace, ground, and heated again at 1723 K in the same way. X-ray diffraction measurements were carried out using a PANalytical X'pert PRO MPD system with Cu-Kα radiation. High-resolution diffraction data was collected using a synchrotron radiation facility. The powder specimen was put into a quartz capillary tube with an inner diameter of 0.2 mm. The measurement was carried out with a wavelength of 0.65297 Å over a 2θ range up to 40° using a high-resolution diffractometer28 with Debye–Scherrer geometry installed at the BL15XU beamline in SPring-8.
9 were mixed in an agate motor, and heated at 1723 K for 4 days in an unsealed Pt tube. The samples were taken out of the furnace, ground, and heated again at 1723 K in the same way. X-ray diffraction measurements were carried out using a PANalytical X'pert PRO MPD system with Cu-Kα radiation. High-resolution diffraction data was collected using a synchrotron radiation facility. The powder specimen was put into a quartz capillary tube with an inner diameter of 0.2 mm. The measurement was carried out with a wavelength of 0.65297 Å over a 2θ range up to 40° using a high-resolution diffractometer28 with Debye–Scherrer geometry installed at the BL15XU beamline in SPring-8.
Electrical conductivities of Ga2O3(ZnO)9 at room temperature were measured by a Loresta GP resistivity meter (Mitsubishi Chemical Analytech). UV-VIS diffuse reflectance spectra were measured using a Hitachi U-4000 spectrophotometer. The same measurements for the electrical conductivity and UV-VIS spectra were also performed after the sample was postheated in air and reducing gas (H2 3%![[thin space (1/6-em)]](https://www.rsc.org/images/entities/char_2009.gif) :
:![[thin space (1/6-em)]](https://www.rsc.org/images/entities/char_2009.gif) Ar 97%) flow.
Ar 97%) flow.
Resistivity and the thermoelectric power of the m = 9 compound of the homologous series Ga2O3(ZnO)m were measured with an ULVAC ZEM-2 by using the four probe method and differential method, respectively. Temperature range of the measurements was from 300 K to 700 K.
To determine the thermal conductivity, first of all, the room temperature specific heat was measured by using a transient heat pulse method with a small temperature increase of 2% relative to the system temperature. Then, the relative specific heat and thermal diffusivity coefficient were measured by a laser flash method from 300 K to 700 K with an ULVAC TC-7000. The thermal conductivity is determined as the product of the density, specific heat, and thermal diffusivity coefficient.
Results and discussion
X-ray diffraction
Diffraction intensities from the synchrotron radiation for Ga2O3(ZnO)9 were fitted by the Rietveld method. The structure model (Fig. 1) was taken from a single-crystal analysis.10 Structural parameters described in (3 + 1)d superspace was converted to those in 3d space and used for the profile fitting. As diffraction peaks for ZnGa2O4 of the spinel structure were also detected in the pattern, the refinement was carried out by taking the sample as a mixture of the 2 phases. A volume fraction of ZnGa2O4 was 1.3%. Cell dimensions, background and peak profile parameters were refined, giving indexes Rwp = 2.31%, Rp = 1.28%, Rall(F) = 4.36%, and wRall(F) = 4.70%. Thus, the formation of Ga2O3(ZnO)9 as a member of the homologous series Ga2O3(ZnO)m was confirmed. Stability of the phase m = 9 was examined by measuring the XRD of the sample after postheating in air. The structure of Ga2O3(ZnO)9 was retained after heating at 973 K for 1 day, while the phase decomposed to spinel-type ZnGa2O4 and wurtzite ZnO after heating at 1173 K for 1 day.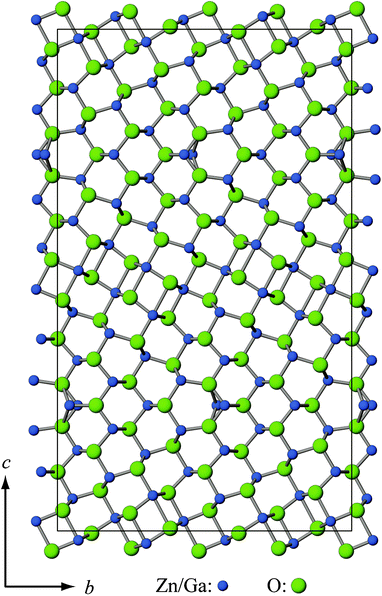 | ||
| Fig. 1 Projection of the structure model for Ga2O3(ZnO)9 along the a-axis. | ||
Electrical and optical properties
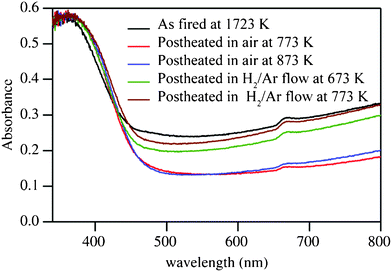
The electrical conductivity of Ga2O3(ZnO)9 as fired at 1723 K and after postheat treatments is listed in Table 1. We stress that the measurements were made on an as-prepared sample with a low density of only 57% and the actual intrinsic electrical conductivity of the compound can be expected to be significantly higher. We are working now to find and develop easy densification methods. UV-VIS spectra for some of these samples are given in Fig. 2. As the sample fired at 1723 K is conductive and transparent in the visible light range (slight blue-green in color), it is concluded that Ga2O3(ZnO)9 is a new transparent conducting oxide. This material has the potential to be of high value because it is composed of abundant and inexpensive elements. Electrical and optical properties are practically unchanged by postheating up to 773 K. The sample after the postheating at 873 K is an insulator, accompanied by a slight change in color to light yellow. This is because the carriers are depleted by the oxidation of the sample. It should be noted that pure and Ga-doped ZnO never become insulators by postheating in atmosphere. We find that this induced change has reversibility. The carriers in Ga2O3(ZnO)9 can be generated by the reducing process, which makes the sample conductive again and blue-greenish light gray in color after heating in reducing gas (H2 3%![[thin space (1/6-em)]](https://www.rsc.org/images/entities/char_2009.gif) :
:![[thin space (1/6-em)]](https://www.rsc.org/images/entities/char_2009.gif) Ar 97%) flow at 773 K, for example. The enhancement of the conductivity by the reducing process is a generally common feature for materials containing ZnO as a main component.
Ar 97%) flow at 773 K, for example. The enhancement of the conductivity by the reducing process is a generally common feature for materials containing ZnO as a main component.
| Samplea | Conductivity (S cm−1) |
|---|---|
| a Measurements and post heat treatments were made on an as-prepared sample with a low density of 57%. (The actual intrinsic electrical conductivity of the compound itself can be expected to be significantly higher.) | |
| As fired at 1723 K | 13 |
| Postheated in air at 673 K | 13 |
| 773 K | 13 |
| 873 K | < 10−7 |
| Postheated in H2/Ar at 573 K | 4.2 × 10⁻² |
| 673 K | 2.6 |
| 773 K | 37 |
In general, the optical band gap of the direct allowed transition, such as for ZnO, is given as an intersection in the plot of (αhν)2 as a function of hν, where α is the absorption coefficient, h the Planck constant, and ν the frequency. Applying the same method for the present cases, optical band gaps were estimated as given in Table 2. The values are almost identical for all the samples, and roughly close to those of In2O3(ZnO)m, 2.8–3.0 eV.12 It is found that the changes in electrical conductivity of Ga2O3(ZnO)9 are mainly associated with the variations of absorbance in the visible light range (as demonstrated in Fig. 2) rather than the variation of the optical band gap, or the absorption edge.
| Sample | Optical band gap (eV) |
|---|---|
| As fired at 1723 K | 2.75 |
| Postheated in air at 773 K | 2.80 |
| 873 K | 2.78 |
| Postheated in H2/Ar at 673 K | 2.80 |
| 773 K | 2.81 |
We investigate the effects of different treatments of the sample on the electrical conductivity in more detail together with the thermoelectric properties in the next subsection.
Thermoelectric properties
We discovered that heating above 700 K could cause changes in the sample which could affect the reproducibility (in the heat cycling) of the results. With temperatures 700 K and below there were no changes due to heat cycling and the results were well reproduced. With development, it is hoped that these materials can be utilized for thermoelectric applications in the mid high temperature range up to 700 K. We have made a series of measurements, changing the density and oxidation state of Ga2O3(ZnO)9 (Table 3). Density of the as-prepared sample was 57% of the theoretical value. The density of the sample was increased to 73% by compacting the sample with cold isostatic pressing (CIP) at 300 MPa.| Sample No. | Form | Condition |
|---|---|---|
| A0 | As-prepared (hand pressed). 57% density | As sintered |
| A | CIP. 73% density | As sintered |
| B | CIP. 73% density | Reduced in (H2 3%![[thin space (1/6-em)]](https://www.rsc.org/images/entities/char_2009.gif) : :![[thin space (1/6-em)]](https://www.rsc.org/images/entities/char_2009.gif) Ar 97%) gas at 673 K Ar 97%) gas at 673 K |
| C | CIP. 73% density | Reduced in (H2 3%![[thin space (1/6-em)]](https://www.rsc.org/images/entities/char_2009.gif) : :![[thin space (1/6-em)]](https://www.rsc.org/images/entities/char_2009.gif) Ar 97%) gas at 873 K Ar 97%) gas at 873 K |
| D | CIP. 73% density | After full oxidization in air at 873 K, reduced at 573 K |
| E | CIP. 73% density | After full oxidization in air at 873 K, reduced at 623 K |
The temperature dependence of the resistivities, ρ, of the Ga2O3(ZnO)9 oxide for different condition samples are plotted in Fig. 3. We consider how the resistivity changes with the different conditions of the sample (Table 3). First of all, comparing A0 and A, the resistivity is lowered by approximately 2.5 times with the densification (57% to 73%) of the sample. Such large or even larger effects have been observed before for other materials,29 and can be readily understood since samples with lower density have open pores and less connectivity of the material. There is little temperature dependence of the resistivity, although a trend can be observed where the resistivity decreases with increasing temperature, namely, insulating/semiconducting behavior.
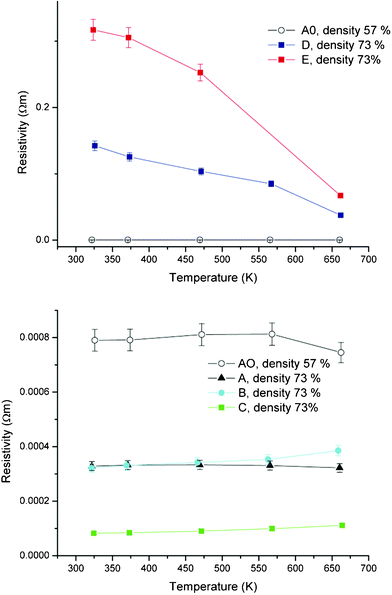 | ||
| Fig. 3 Temperature dependence of resistivity of samples. Sample A0 is 57% density while all other samples are 73% density. | ||
The Seebeck coefficient of Ga2O3(ZnO)9 takes negative values indicating n-type behavior. As mentioned in the introduction, oxides have been studied as promising thermoelectric materials. Doped ZnO25 and In2O3(ZnO)m compounds22–24 have shown the best thermoelectric properties for n-type oxides. Ga2O3(ZnO)9 represents a new crystal structure type (Fig. 1) which is different from any known ZnO related compounds. Despite the similarity in composition, the structure of Ga2O3(ZnO)9 is fundamentally different from In2O3(ZnO)m, for example, it is orthorhombic, whereas In2O3(ZnO)m have hexagonal or trigonal (rhombohedral) lattices. Although a direct comparison of the thermoelectric power factor is difficult, since the Ga2O3(ZnO)9 samples we can presently prepare only have a maximum density of 73%, from the magnitude of the Seebeck coefficient results coupled with the resistivity, it is indicated that the thermoelectric properties of Ga2O3(ZnO)9 are on par with the base ZnO or In2O3(ZnO)m compounds, making it a promising thermoelectric system to investigate further. This is further reinforced by the thermal conductivity measurement in the latter part of the paper.
We next varied the state of the CIP Ga2O3(ZnO)9 sample under various redox reactions to investigate the effect of redox on the thermoelectric properties. These results are the four B to E samples.
First of all, with the first level reaction to reduce the Ga2O3(ZnO)9 sample (B), we observe that there is not a large variation in the thermoelectric properties. The room temperature resistivity is decreased slightly but the high temperature resistivity is higher for B compared to A. In any case, there is not a large difference. However, in the temperature dependence of the resistivity we note that while A exhibits a semiconducting/insulating dependence, B shows a metallic dependence, with the resistivity increasing as the temperature is increased. The Seebeck coefficient shows very little difference (Fig. 4) and it is indicated that the first level reduction procedure has little effect on the oxidation state of the compound, as noted above.
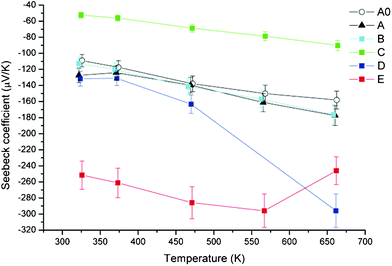 | ||
| Fig. 4 Temperature dependence of Seebeck coefficient of samples. | ||
A large difference is obtained upon carrying out the second level reduction procedure (C) on Ga2O3(ZnO)9. The resistivity is reduced by a factor of more than 4, taking a low value of 7 × 10⁻⁵ Ohm m at room temperature. The temperature dependence is metallic. Correspondingly the Seebeck coefficient is also reduced in magnitude, taking values of −50 μV K−1 to −80 μV K−1 from 300 K to 700 K.
The power factor P which is given as:
| P = α2/ρ | (1) |
is plotted in Fig. 5. It can be observed that although the resistivity is significantly reduced, overall the redox reduction procedure was not beneficial for increasing the thermoelectric power factor.
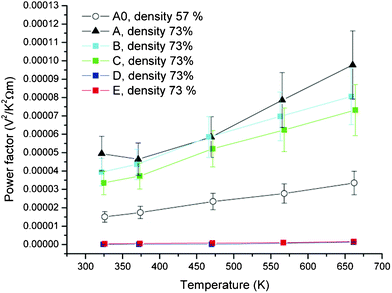 | ||
| Fig. 5 Temperature dependence of power factor of samples. Sample A0 is 57% density while all other samples are 73% density. | ||
Next, we investigate effects of oxidation on the Ga2O3(ZnO)9 sample. First of all, sample D which is the most oxidized of our samples, shows a very large increase in the resistivity (Fig. 3). The room temperature resistivity is 0.32 Ohm m which is more than 3 orders higher than that of the as-prepared sample A. Sample E is reduced a little more (Table 1) than sample D and correspondingly has a lower room temperature resistivity of 0.14 Ohm m. Both samples show a semiconducting/insulating dependence. The Seebeck coefficients of the two samples show an increase in magnitude as would be expected, however, it is not enough to compensate for the large increase of the resistivities and the power factors of both oxidized samples are low. Actually, sample D shows strange behavior in that despite the increase of the resistivity by more than three orders compared to sample A, the Seebeck coefficient shows little increase up to the data point at 470 K (after which there is an increase). Although the origin is not clear at present, this indicates that there is more to the differences obtained here than variation of carrier concentration.
The results of the thermal conductivity κ of sample A are shown in Fig. 6. The thermal conductivity shows little temperature dependence, which is similar to the behaviour previously observed for In2O3(ZnO)m for a high m number of the homologous series,22 and takes a low value of around 1.05 W m−1 K−1 above 375 K. A direct comparison between the absolute values of the thermal conductivities of the two systems is difficult, since the Ga2O3(ZnO)9 sample has lower density (73%). However, we note that the crystal structure of Ga2O3(ZnO)9 is more complex than In2O3(ZnO)m, which could lead to intrinsically lower thermal conductivity, attractive for thermoelectrics.
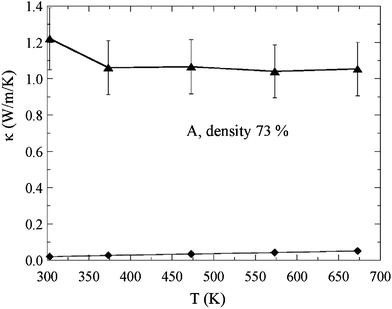 | ||
| Fig. 6 Temperature dependence of total thermal conductivity (triangles) and estimated electronic thermal conductivity (diamonds) of the 73% density sample A. | ||
We estimate the contribution from the electronic thermal conductivity κe to the total thermal conductivity by assuming the Wiedemann–Franz relation
| κe, = L0T/ρ | (2) |
The Lorentz number is taken as L0 = 1/3(πkB/e)2, while we obtain ρ values by smoothly extrapolating the resistivity results obtained above. The electronic thermal conductivity κe is also plotted in Fig. 6 and it can be seen that it is less than 5% of the total thermal conductivity.
The calculated figure of merit Z (Z = P/κ) for the 73% density sample is plotted in Fig. 7. Z monotonically increases with increasing temperature and reaches a maximum value of approximately 10−4 at 660 K, the limit of our measurement. This Z value is comparative and actually slightly larger than that previously obtained for unmodified In2O3(ZnO)m,22 and reveals Ga2O3(ZnO)9 to be a promising n-type oxide system for further investigations.
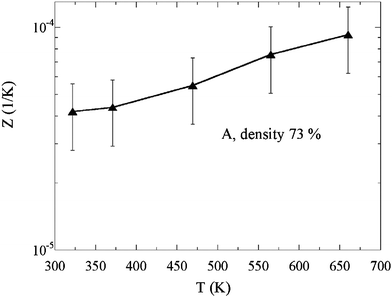 | ||
| Fig. 7 Temperature dependence of figure of merit Z of the 73% density sample A. | ||
It is striking that this figure of merit could be obtained for a nondense Ga2O3(ZnO)9 sample with 73% density, compared to dense In2O3(ZnO)m. The figure of merit typically increases significantly with densification, since the gain from the electrical conductivity is typically sizably larger than the increase of thermal conductivity.29
To summarize, we were able to fairly easily vary the thermoelectric properties of Ga2O3(ZnO)9 through redox procedures. The highest figure of merit Z obtained was for the as-prepared (and CIP densified) sample with density of 73% and takes a value of ∼10−4 K−1. Despite the low density, the figure of merit is comparable or higher than those previously obtained for In2O3(ZnO)m. The figure of merit of Ga2O3(ZnO)9 can be expected to be relatively easily and significantly improved with further densification of the samples. It is indicated that optimization of the power factor would be achieved at or near the oxidation state of the as-prepared sample for Ga2O3(ZnO)9. We find that the thermoelectric figure of merit Z of Ga2O3(ZnO)9 appears to be comparative or superior with the extensively studied In2O3(ZnO)m compounds, and considering its relatively abundant and inexpensive constituent elements compared to indium, we think that this system should be investigated further.
There are five important points for further development of Ga2O3(ZnO)m.
First of all, it should be stressed again that the results we obtain are for relatively low density samples. By investigating the densification processes, the thermoelectric figure of merit can be expected to be significantly improved.
Secondly, as can be seen in Fig. 7, the figure of merit shows an increase with temperature. The Ga2O3(ZnO)9 compound shows a relatively low stability with high temperature (for an oxide). If the temperature stability can be improved, higher power factors can be obtained. It is known that substitutional doping of transition metals can in some cases yield better temperature resistance. Transition metal doping should be carried out next, in an effort to straightforwardly improve the properties and in addition improve the temperature dependence which can yield higher operating temperatures and higher thermoelectric power factors.
Thirdly, we have demonstrated that it is relatively easy to change the thermoelectric properties of Ga2O3(ZnO)9 through redox reactions. Further tuning of the properties should also be carried out.
Fourthly, it has previously been found for the indium oxides that an optimum value of m exists for the thermoelectric properties.22 We will investigate the other homologous compounds of the Ga2O3(ZnO)m series.
Fifthly, previous improvements of the thermoelectric properties of In2O3(ZnO)m were achieved through yttrium substitution and texturing, for example.23,24 Now that the promising properties of the Ga2O3(ZnO)m system as an n-type oxide have been revealed, further efforts of atom substitution and texturing should be carried out.
Conclusions
Formation of Ga2O3(ZnO)9 was confirmed by the Rietveld method using X-ray diffraction intensities measured at a synchrotron facility. The structure of the phase was retained after heating in air at 973 K for 1 day, but decomposed to spinel-type ZnGa2O4 and wurtzite after heating in air at 1173 K for 1 day.The material is a new TCO with slight a blue–green tint in color and the electrical conductivity was measured to be 13 S cm−1 for 57% low density samples as fired at 1723 K. The sample changes to an insulator after postheating in air at 873 K, which is a different behavior from that observed in pure and Ga-doped ZnO. By postheating in reducing gas (H2 3%-Ar 97%) flow, the insulating sample again becomes conductive, showing reversibility. The changes in conductivity are associated with the variations of absorbance in the visible light range, while the optical band gap estimated from the diffuse reflectance spectra was always around 2.8 eV.
The thermoelectric properties of Ga2O3(ZnO)9 were n-type and showed some promising features such as easy and to an extent reversible control through redox treatment. The thermoelectric properties appear to be on par with the basic ZnO and In2O3(ZnO)m compounds which have previously been extensively investigated as promising n-type oxide thermoelectric systems. Densification procedures should be investigated in more detail together with doping and variation of the homologous series m in Ga2O3(ZnO)m.
To summarize, we have discovered a new TCO composed of abundant and inexpensive elements, which furthermore has promising thermoelectric properties. This material should be the object of further development.
Acknowledgements
One of the authors (YM) is grateful to Dr Yasuo Ebina (NIMS) for his help in the measurement of UV-VIS spectra, and Dr Naoki Ohashi (NIMS) for helpful discussion. The work of one of the authors (TM) was partly supported by grants from AOARD (AOARD 104144) and also the Thermal & Electric Energy Technology Foundation. This research was also partially supported by Scientific Research on Priority Areas of New Materials Science Using Regulated Nano Spaces, the Ministry of Education, Science, Sports and Culture, Grant-in-Aid for TM.References
- R. Wang and A. W. Sleight, Chem. Mater., 1996, 8, 433 CrossRef CAS.
- H. Kasper and Z. Anorg, Z. Anorg. Allg. Chem., 1967, 349, 113 CrossRef CAS.
- N. Kimizuka, M. Isobe, M. Nakamura and T. Mohri, J. Solid State Chem., 1993, 103, 394 CrossRef CAS.
- N. Kimizuka, M. Isobe and M. Nakamura, J. Solid State Chem., 1995, 116, 170 CrossRef CAS.
- M. Isobe, N. Kimizuka, M. Nakamura and T. Mohri, Acta Crystallogr., Sect. C: Cryst. Struct. Commun., 1994, 50, 332 CrossRef.
- C. F. Li, Y. Bando, M. Nakamura and N. Kimizuka, J. Electron Microscopy, 1997, 46, 119 CAS.
- C. F. Li, Y. Bando, M. Nakamura, K. Kurashima and N. Kimizuka, Acta Crystallogr., Sect. B: Struct. Sci., 1999, 55, 355 CrossRef.
- Y. Michiue, N. Kimizuka and Y. Kanke, Acta Crystallogr., Sect. B: Struct. Sci., 2008, 64, 521 Search PubMed.
- J. L. F. Da Silva, A. Walsh and S.-H. Wei, Phys. Rev. B: Condens. Matter Mater. Phys., 2009, 80, 214118 CrossRef.
- Y. Michiue and N. Kimizuka, Acta Crystallogr., Sect. B: Struct. Sci., 2010, 66, 117 Search PubMed.
- J. F. Wager, D. A. Keszler and R. E. Presley, in Transparent Electronics, Springer, New York, 2008 Search PubMed.
- T. Moriga, D. D. Edwards, T. O. Mason, G. B. Palmer, K. R. Poeppelmeier, J. L. Schindler, C. R. Kannewurf and I. Nakabayashi, J. Am. Ceram. Soc., 1998, 81, 1310 CrossRef CAS.
- G. S. Nolas, J. Sharp and H. J. Goldsmid, Thermoelectrics: Basic Principles and New Materials Developments, Springer: New York, 2001 Search PubMed.
- C. Wood and D. Emin, Phys. Rev. B, 1984, 29, 4582 CrossRef CAS.
- D. M. Rowe, J. Power Sources, 1987, 19, 247 CrossRef CAS.
- T. Mori, “Higher Borides” in Handbook on the Physics and Chemistry of Rare Earths, Vol. 38, ed. K. A. Gschneidner Jr., J. -C. Bunzli, and V. Pecharsky; North-Holland: Amsterdam, 2008, p. 105-173 Search PubMed.
- T. Mori and T. Nishimura, J. Solid State Chem., 2006, 179, 2908 CrossRef CAS.
- T. Mori, D. Berthebaud, T. Nishimura, A. Nomura, T. Shishido and K. Nakajima, Dalton Trans., 2010, 39, 1027 RSC.
- I. Terasaki, Y. Sasago and K. Uchinokura, Phys. Rev. B: Condens. Matter, 1997, 56, R12685 CrossRef CAS.
- H. Ohta, S.-W. Kim, Y. Mune, T. Mizoguchi, K. Nomura, S. Ohta, T. Nomura, Y. Nakanishi, Y. Ikuhara, M. Hirano, H. Hosono and K. Koumoto, Nat. Mater., 2007, 6, 129 CrossRef CAS.
- X. Y. Huang, Y. Miyazaki and T. Kajitani, Solid State Commun., 2008, 145, 132 CrossRef CAS.
- H. Ohta, W.-S. Seo and K. Koumoto, J. Am. Ceram. Soc., 1996, 79, 2193 CrossRef CAS.
- M. Kazeoka, H. Hiramatsu, W.-S. Seo and K. Koumoto, J. Mater. Res., 1998, 13, 523 CrossRef CAS.
- H. Kaga, R. Asahi and T. Tani, Jpn. J. Appl. Phys., 2004, 43, 7133 CrossRef CAS.
- (a) T. Tsubota, M. Ohtaki, K. Eguchi and H. Arai, J. Mater. Chem., 1997, 7, 85 RSC; (b) T. Tsubota, M. Ohtaki, K. Eguchi and H. AraiJ. Mater. Chem., 1998, 8, 409 Search PubMed; (c) M. Ohtaki, K. Araki and K. Yamamoto, J. Electron. Mater., 2009, 38, 1234 CrossRef CAS.
- E. N. Nikitin, V. G. Bazanov and V. I. Tarasov, Sov. Phys. Sol. State, 1961, 3, 2648 Search PubMed.
- J. V. Zaikina, T. Mori, K. A. Kovnir, U. Schwarz, Y. Grin and A. Shevelkov, Chem.–Eur. J., 2010, 16, 12582 CrossRef CAS.
- M. Tanaka, Y. Katsuya and A. Yamamoto, Rev. Sci. Instrum., 2008, 79, 075106 CrossRef.
- T. Mori, T. Nishimura, K. Yamaura and E. Takayama-Muromachi, J. Appl. Phys., 2007, 101, 093714 CrossRef.
Footnotes |
| † Electronic supplementary information (ESI) available: Structure parameters and final profile fit for X-ray diffractions of Ga2O3(ZnO)9. See DOI: 10.1039/c1ra00315a |
| ‡ Crystallographic data of Ga2O3(ZnO)9: Orthorhombic, space groupCmcm, a = 3.23958(4), b = 19.6484(2), c=33.4626(4) (Å). |
| This journal is © The Royal Society of Chemistry 2011 |

