DOI:
10.1039/C1RA00524C
(Paper)
RSC Adv., 2011,
1, 1794-1798
A facile aqueous sol–gel method for high surface area nanocrystalline CeO2†
Received
28th July 2011
, Accepted 14th September 2011
First published on 28th October 2011
Abstract
Thermally stable high surface area nanocrystalline CeO2 was synthesized via an aqueous sol–gel method using cerium hydroxide and urea as precursors. The CeO2 sol is yellow colored and absorbs light over the range 200–500 nm. Nanocrystalline CeO2 particles derived from the sol are spherical in shape and range from 9 to 13 nm in diameter. The CeO2 powder has a high surface area of up to 85 m2 g−1 and a band gap of 3.1 eV. The method of preparation is facile, utilises low cost reagents and can be performed on a large scale.
1. Introduction
Semiconductor metal oxide nanoparticles are attractive for a wide variety of applications including catalysis, photocatalysis, sensors, optoelectronic materials and environmental remediation.1,2,3,4 Cerium dioxide based materials are of particular interest due to their potential applications as oxygen storage promoters in three-way catalysts,5 catalysts for H2 production from fuels,6 optical films,7 oxygen sensors8 and solid state conductors for fuel cells.9 In addition, CeO2 is a wide band gap material that is non-toxic and stable, features which are similar to other metal oxide nanoparticles such as TiO210 and ZnO11 and render it an attractive alternative material for applications in solar cells7 and photocatalysis.12
Various techniques such as solvothermal synthesis,13 electrode deposition,14 hydrothermal,15 sol–gel16 and precipitation methods12 have been reported for the synthesis of CeO2 nanoparticles. Of these approaches, sol–gel methods provide a large degree of control of the properties (size, morphology, pure phase, surface area and pore size) of metal oxide nanoparticles which are essential for successful application in catalysis, photocatalysis and solar cells.5–12 Hence this methodology has been extensively used for the synthesis of metal oxide nanoparticles such as TiO2,17,18, ZnO19,20, and CeO216
The majority of methods reported for the synthesis of CeO2 have used non-aqueous sol–gel methods16,21,22, based on expensive templates such as P123,23 hydrocarbons,24 colloidal silica,25 carbon26etc. This paper describes a novel aqueous sol–gel process for the synthesis of nano crystalline CeO2 sol using cerium nitrate as a precursor. The synthesis is facile and utilizes inexpensive precursors and can be readily scaled up. The as synthesized CeO2 powder was calcined at different temperatures and characterized by X-ray diffraction (XRD), FTIR spectroscopy, BET surface area measurements, diffuse reflectance spectra, thermal, XPS and TEM analysis.
2. Experimental
8.64 g of Ce(NO3)36H2O (99%, Aldrich) was placed in 100 mL distilled water (0.2 M) and stirred for half an hour to ensure complete dissolution. NH4OH (NH3 content 28–30%, Aldrich, ACS reagent) solution was then added drop wise to precipitate cerium(IV) hydroxide. The addition of NH4OH was continued until the pH attained a value of 10 to ensure that all cerium nitrate had been precipitated as cerium hydroxide. This precipitate was collected by centrifugation and washed with distilled water to render the precipitate free from nitrate and ammonia. The precipitate was then dispersed in 200 mL of 0.1 M urea solution. The pH of the solution was adjusted by the drop wise addition of a 10% HCl solution to a pH of 2. The sol was dried at 100 °C for 24 h and the resultant xero-gel was calcined at different temperatures (400, 500 and 600 °C) at a temperature ramp rate of 5 °C min−1 followed by heating for 2 h at the highest temperature. The yield of CeO2 calculated after calcination of the gel was 87%.
XRD patterns of the calcined sample were obtained with a Siemens D 500 X-ray diffractometer in the diffraction angle range 2θ = 10–70° using Cu-Kα radiation. The crystallite size of the CeO2 particle was calculated from the Scherrer equation:
| |  | (1) |
where Φ is the crystallite size (nm), λ the λ/Å, θ the Bragg angle (radian) and β the peak width at half maximum (radian). Differential scanning calorimetry (DSC) analysis was performed using a Perkin Elmer Pyris 1 DSC instrument. A small amount of the precursor sample was heated from room temperature to 500 °C at a constant heating rate of 10 °C min−1.
BET (Brunauer, Emmett and Teller) surface area and pore size measurements were carried out by nitrogen adsorption using a Quantachrome Autosorb-1 surface area analyzer. Measurements were performed after degassing the powder samples for 2 h at 120 °C. FTIR spectra of the sample were obtained using a Perkin Elmer 100 spectrophotometer in the range 4000–650 cm−1 using 16 scans per sample. UV-visible and diffuse reflectance spectra were obtained using a Varian Carey 4000 spectrophotometer over the range 200–800 nm. The band-gap, E, was calculated from diffuse reflectance spectra using the equation:
| |  | (2) |
where h is Planck's constant, c the velocity of light and λint the wavelength (m). TEM measurements were performed using a JEOL 2010 instrument operating at 200 kV. Images were collected on a Gatan CCD Multiscan 794 camera. X-ray photoelectron spectra (XPS) were obtained using a Kratos AXIS 165 spectrometer. The instrument employs a monochromatic AlKα X-ray source (hν = 1486.58 eV) which was used at 150 W (10 mA, 15 kV). For survey spectra and high resolution spectra of C 1s, O 1s, N 1s and Ce 3d pass energies of 160 and 20 eV were used, respectively. Core level binding energies were determined using the C 1s peak at 284.8 eV as the charge reference.
3. Results and discussion
3.1 Synthesis of the CeO2 sol
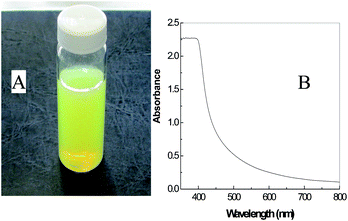
A precipitate of cerium hydroxide was initially prepared by reacting cerium nitrate with ammonium hydroxide. The precipitate was then dispersed in a urea solution prepared in deionised water. This water dispersed sol was further stabilized by peptization performed with HCl, where H3O+ acts as a charge stabilizer by preventing the formation of agglomerates of cerium hydroxide nano-particles. The pH range 1.8–2 provides adequate surface charge for the stabilization of the sol. No evidence of precipitation of the sol was observed for up to 2 months (Fig. 1a), indicative of the stability of the sol prepared via this method. The absorption spectrum of the sol (Fig. 1b) demonstrates that the material absorbs light over the range 200–500 nm.
The FT-IR spectrum of CeO2 gel that had been dried at 80 °C (Fig. 2a) exhibited six main absorption bands at 3430, 3327, 1676, 1588, 1465, 1151 and 700 cm−1. The presence of a large band at 3430 cm−1 corresponding to the O–H stretching frequency and a band at 1676 cm−1 to the bending vibration of associated water,27,28 are indicative of the presence of residual water and hydroxyl groups in the dried gel (Fig. 2a). The peak at 1151 cm−1 is assigned to the stretching vibration of the C–N bond of urea,27 while the peak at 1465 cm−1 is due to the deformation mode of ammonium ions formed by the decomposition of urea.29 The intensity of the peaks at 1151 and 1465 cm−1 decreased or were entirely absent for samples calcined above 400 °C, indicating that the urea component was removed at these temperatures. The peak at 1588 cm−1 corresponds to the vibrational stretching band of CO2 formed from the decomposition of urea.24 Finally the peak at ca.700 cm−1 in the precursor gel (Fig. 2a) corresponds to the vibrational stretching of the Ce–O–C bond formed by the interaction between cerium hydroxide and the carboxylate group of urea.24 The band at 700 cm−1 is absent in the spectra of the sample calcined at 400, 500 and 600 °C (Fig. 2b, c and d) as are all additional peaks associated with urea. However, spectra at 400, 500 and 600 °C (Fig. 2b, c and d) shows the presence of a band at 3430 cm−1 corresponding to the O–H stretching frequency and a band at 1676 cm−1 to the bending vibration of associated water. The formation of Ce–O–C bond indicates that there is a degree of interaction between the organic and inorganic components via condensation reaction in the initial gel precursor. While this type of gel strengthening can assist the formation of mesopores, this peak is absent in the calcined sample suggesting that the interaction is weak. It has been previously reported that a gel network of this type with branching and cross linking is morphologically weak and collapses easily on calcination.30
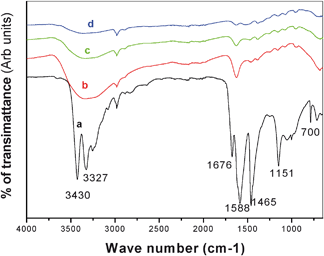 |
| | Fig. 2 FTIR spectra of a) CeO2 dried gel at 100 °C, calcined CeO2 powder at b) 400 °C c) 500 °C and d) 600 °C. | |
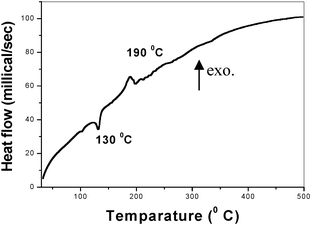
Differential scanning calorimetry (DSC) was performed (Fig. 3) to investigate the thermal properties and amorphous-to-crystalline transition of the initial CeO2 precursor. An endothermic peak at 130 °C can be assigned to the thermal decomposition of the ceria-urea precursor31. The exothermic peak (Fig. 3) at 190 °C is indicative of the formation of crystalline CeO2.32 FTIR spectra indicated that chelation of urea to the cerium hydroxide precursor occurred via the formation of Ce–O–C bonds (Fig. 2). This bond formation arises from the reaction between cerium hydroxide and C![[double bond, length as m-dash]](https://www.rsc.org/images/entities/char_e001.gif) O of urea and is confirmed by a peak at 700 cm−1. The mechanism of formation of CeO2 particles may be explained in a similar manner to that proposed for the urea modification TiO2. A simplified form of this mechanism is shown below:28
O of urea and is confirmed by a peak at 700 cm−1. The mechanism of formation of CeO2 particles may be explained in a similar manner to that proposed for the urea modification TiO2. A simplified form of this mechanism is shown below:28
| | | Ce(OH)4 + (NH2)2CO → (HO)3–Ce–O–CNHNH2 + H2O | (3) |
| | | (HO)3–Ce–O–CNHNH2 → CeO2 + 2NH3 + CO2 | (4) |
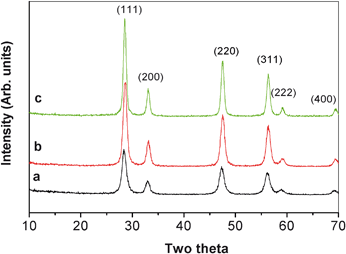
Fig. 4 shows the XRD spectra of CeO2 particles that had been calcined at 400, 500 and 600 °C. A set of diffraction peaks can be indexed to (111), (200), (220), (311), (222) and (400) corresponding to a cubic fluorite structured ceria phase with space group Fm3m and a lattice parameter of 5.45 Å (JCPDS file no. 34–0394). The crystallite sizes calculated using the Scherrer equation is shown in Table 1. As the temperature increased from 400 to 600 °C, the crystal size increased from 9.1 to 13.6 nm.
Table 1 Crystallite size and band gap of CeO2 synthesized at different temperatures
|
T/°C |
Crystallite size (nm) |
| 400 |
9.1 |
| 500 |
10.7 |
| 600 |
13.6 |
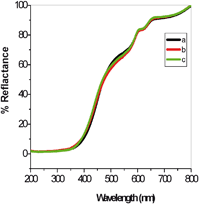
Fig. 5 shows the diffuse reflectance spectra of CeO2 samples calcined at different temperatures. There was no measurable change in the absorption spectrum as the temperature was increased, in agreement with the observation that the particle sizes are similar for all calcined samples. All calcined samples had an absorption band at ca. 400 nm indicative of band gap energies of 3.1 eV. No changes to the band gap energy were observed when the temperature was increased to 800 °C.
3.5 BET surface area
The N2 adsorption isotherms and physicochemical properties of CeO2 calcined at 400, 500 and 600 °C are shown in Table 2 and Fig. 6. All calcined samples displayed a type IV isotherm with surface areas of up to 85 m2 g−1. The average pore size increased with increasing calcination temperature due to the larger size of the crystallites. All samples showed decreases in surface areas with increasing calcination temperature. Inter-particle pore sizes will be larger for bigger particles and is reflected in the lower surface area values. The highest pore diameter of 5.14 nm was obtained for the sample calcined at 600 °C, which also had the lowest surface area, 55.5 m2 g−1. On heating to 800 °C, the surface area decreased to 10 m2 g−1. In comparison, a recent report on CeO2 particles synthesised using cetyltrimethyl ammonium bromide as a template (CTAB) had a surface area of 54 m2 g−1.33 This material was obtained by hydrothermal synthesis at 80 °C for 4 days followed by calcination at 550 °C for 12 h. Guo et al. reported a value of 450 m2 g−1 for CeO2 synthesised from cerium chloride octahydrate using sodium dodecyl sulfate as a template.34 This method produces a precipitate, in contrast to that described here which as an aqueous based sol–gel, has the potential to be used in thin film applications such as in solar cells and as antibacterial coatings on glass and textile materials. The sol obtained is stable for long periods (the photograph in Fig. 1a is of a sol kept for two months). The current method of preparation is easy to perform on a large scale using simple reagents such as cerium nitrate and urea.
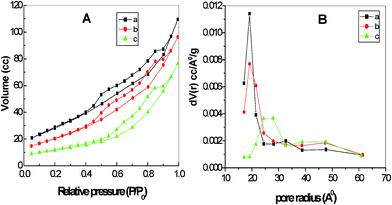 |
| | Fig. 6 A) N2 adsorption isotherms and B) pore size distributions of CeO2 calcined at a) 400 b) 500 and c) 600 °C. | |
Table 2 Surface area, total pore volume and pore diameter of the CeO2 calcined at different temperatures
| Calcination temperature |
BET surface area (m2 g−1) |
Total pore volume (cm3 g−1) |
Pore diameter (nm) |
| 400 |
84.9 |
0.150 |
4.0 |
| 500 |
81.5 |
0.144 |
4.0 |
| 600 |
55.5 |
0.121 |
5.1 |
3.6 XPS analysis
XPS analysis demonstrated that Ce, O, C and N were present in all samples (Table 3). High resolution Ce 3d spectra from samples calcined at 400, 500 and 600 °C are shown in Fig. 7A. Peak doublets at 883, 889 and 898 eV corresponding to Ce 3d5/2 were observed while the peaks at 901, 908 and 917 eV correspond to Ce 3d3/2. The binding energies are characteristic of cerium in the Ce4+ state.26 The calculated atomic ratio of O (using the peak at a binding energy of 529.5 eV) to Ce was 2.03, confirming the stoichiometry of the synthesized CeO2. The relative concentration of nitrogen present is small (2–5 atomic%) and decreased with increasing calcination temperature (Fig. 7B). The N 1s region of the spectrum could be fitted with component peaks at 398, 399.9 and 401.2 eV which can be assigned to nitride, chemisorbed nitrogen and protonated ions, respectively. The presence of nitride indicates that some nitrogen may be doped into the CeO2 lattice. An increase in carbon composition is seen at higher temperatures. In addition to contribution from residual urea used in the synthesis, the majority of the carbon is adventitous carbon33 generally present in most samples. The notable increase in relative carbon content at a calcination temperature of 600 °C is mainly hydrocarbon in nature and may be due to residues remaining from performing calcination in air.35
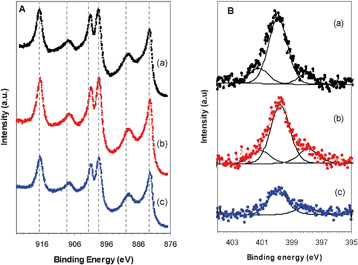 |
| | Fig. 7 XPS of CeO2 of A) Ce3d and B) N1s calcined at a) 400 b) 500 and c) 600 °C. | |
Table 3 XPS analysis of amounts of Ce, C, O and N present in samples calcined at different temperatures
| Calcination T/°C |
Atomic percentage of elements (At.%) |
| Ce |
C |
O |
N |
| 400 |
17.1 |
26.5 |
50.8 |
5.7 |
| 500 |
17.3 |
27.5 |
50.5 |
4.8 |
| 600 |
16.1 |
33.4 |
48.0 |
2.5 |
3.7 TEM analysis
TEM images and diffraction patterns of CeO2 calcined at 500 °C (Fig. 8) demonstrate that the CeO2 nano-particles are crystalline and have a relatively uniform spherical morphology. The average particle size of CeO2 was 7 nm, in reasonable agreement with the size calculated using the Scherrer equation (Table 1). The selected area electron diffraction (SAED) patterns indicate that the CeO2 particles are highly crystalline and were indexed to cubic fluorite structured ceria (Fig. 8 inset). TEM images of the CeO2 material calcined at 400 and 600 °C displayed a similar spherical shape with particle sizes of ca. 10 and 15 nm respectively and had a cubic fluorite structure (Fig. 1S†).
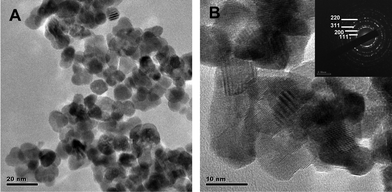 |
| | Fig. 8 TEM images of (A) CeO2 particles calcined at 500 °C and (B) at higher magnification. The inset shows the SAED pattern indexed to cubic ceria . | |
4. Conclusions
This study demonstrated the use of an aqueous sol–gel method for the controlled synthesis of CeO2 nano-materials. The main advantages of this approach are the use of inexpensive precursors, ease of synthesis and simplicity of processing. Spherical nanoparticles ranging in size from 9 to 13 nm with high surface areas of up to 85 m2 g−1 were obtained. These materials have potential in thin film applications, in solar cells and as photocatalysts, current work is in progress to evaluate the materials in such applications.
Acknowledgements
The research leading to these results has received funding from the European Community's Seventh Framework Programme (FP7/2007-2011) under grant agreement n°212533 (BioElectricSurface). Funding from the HEA PRTLI4 nanoscience programme INSPIRE is gratefully acknowledged. P. Periyat acknowledges the Irish Research Council for Science, Engineering and Technology for a IRCSET-Marie Curie fellowship.
References
-
(a) R. van de Krol, Y. Liang and J. Schoonman, J. Mater. Chem., 2008, 18, 2311 RSC;
(b) X. Chen and S. S. Mao, Chem. Rev., 2007, 107, 2891 CrossRef CAS.
-
(a) I. P. Parkin and R. G. Palgrave, J. Mater. Chem., 2005, 15, 1689 RSC;
(b) C. Burda, X. Chen, R. Narayanan and M. A. El-Sayed, Chem. Rev., 2005, 105, 1025 CrossRef CAS.
-
(a) G. Shen, P. Chen, K. Ryu and C. Zhou, J. Mater. Chem., 2009, 19, 828 RSC;
(b) D. P. Puzzo, L. D. Bonifacio, J. Oreopoulos, C. M. Yip, I. Manners and G. A. Ozin, J. Mater. Chem., 2009, 19, 3500 RSC.
- M. G. Antoniou, P. A. Nicolaou, J. A. Shoemaker, A. A. Cruz and D. D. Dionysios, Appl. Catal., B, 2009, 91, 165 CrossRef CAS.
- J. Kaspar, P. Fornasiero and M. Graziani, Catal. Today, 1999, 50, 285 CrossRef CAS.
- B. C. H. Steele, Nature, 1999, 400, 619 CrossRef CAS.
-
(a) A. Corma, P. Atienzar, H. Garcia and J. C. Chane-Ching, Nat. Mater., 2004, 3, 394 CrossRef CAS;
(b) R. X. Li, S. Yabe, M. Yamashita, S. Momose, S. Yoshida, S. Yin and T. Sato, Solid State Ionics, 2002, 151, 235 CrossRef CAS.
- P. Jasinski, T. Suzuki and H. U. Anderson, Sens. Actuators, B, 2003, 95, 73 CrossRef.
- B. C. H. Steele and A. Heinzel, Nature, 2001, 414, 345 CrossRef CAS.
-
(a) P. Periyat, D. E. Mccormack, S. J. Hinder and S. C. Pillai, J. Phys. Chem. C, 2009, 113, 3246 CrossRef CAS;
(b) P. Periyat, S. C. Pillai, D. E. McCormack, J. Colreavy and S. J. Hinder, J. Phys. Chem. C, 2008, 114, 7644 CrossRef.
- R. G. Kutty, M. K. Seery and S. C. Pillai, J. Phys. Chem. C, 2008, 112, 13563 Search PubMed.
- P. Ji, J. Zhang, F. Chen and M. Anpo, Appl. Catal., B, 2009, 85, 148 CrossRef CAS.
- L. Qian, J. Zhu, W. Du and X. Qian, Mater. Chem. Phys., 2009, 115, 835 CrossRef CAS.
- I. Yamaguchi, M. Watanabe, T. Shinagawa, M. Chigane, M. Inaba, A. Tasaka and M. Izaki, ACS Appl. Mater. Interfaces, 2009, 1, 1070 CAS.
-
(a) M. Hirano and M. Inagaki, J. Mater. Chem., 2000, 10, 473 RSC;
(b) Z. Guo, F. Jian and F. Du, Scr. Mater., 2009, 61, 48 CrossRef CAS.
- H. Xiao, Z. Ai and L. Zhang, J. Phys. Chem. C, 2009, 113, 16625 CAS.
- P. Periyat, K. V. Baiju, P. Mukundan, P. K. Pillai and K. G. K.Warrier, J. Sol–Gel Sci. Tech., 2007, 43, 289 CrossRef.
- P. Periyat, K. V. Baiju, P. Mukundan, P. K. Pillai and K. G. K. Warrier, Appl. Catal., A, 2008, 349, 13 CrossRef CAS.
- S. C. Pillai, J. M. Kelly, D. E. McCormack and R. Ramesh, J. Mater. Chem., 2004, 14, 1572 RSC.
- S. C. Pillai, J. M. Kelly, D. E. McCormack, P. O'Brien and R. Ramesh, J. Mater. Chem., 2003, 13, 2586 RSC.
- Y. S. Chaudhary, S. Panigrahi, S. Nayak, B. Satpati, S. Bhattacharjee and N. Kulkarni, J. Mater. Chem., 2010, 20, 2381 RSC.
- C. L. Robert, J. W. Long, E. M. Lucas, K. A. Pettigrew, R. M. Stroud, M. S. Doescher and D. R. Rolison, Chem. Mater., 2006, 18, 50 CrossRef.
- C. Ni, X. Li, Z. Chen, H. H. Li, X. Jia, I. Shah and J. Q. Xiao, Microporous Mesoporous Mater., 2008, 115, 247 CrossRef CAS.
- H. Gu and M. D. Soucek, Chem. Mater., 2007, 19, 1103 CrossRef CAS.
- N. C. Strandwitz and G. D. Stucky, Chem. Mater., 2009, 21, 4577 CrossRef CAS.
- S. Wang, J. Zhang, J. Jiang, R. Liu, B. Zhu, M. Xu, Y. Wang, J. Cao, M. Li, S. Zhang, W. Huang and S. Wu, Microporous Mesoporous Mater., 2009, 123, 349 CrossRef CAS.
- S. C. Pillai, P. Periyat, R. G. Kutty, D. E. McCormack, M. K. Seery, H. Hayden, J. Colreavy, D. Corr and S. J. Hinder, J. Phys. Chem. C, 2007, 111, 1605 CAS.
- P. Cheng, J. Qiu, M. Gu and W. Shangguan, Mater. Lett., 2004, 58, 3751 CrossRef CAS.
- L. Ren, X. Huang, F. Sun and X. He, Mater. Lett., 2007, 61, 427 CrossRef CAS.
- H. H. Kung and E. I. Ko, Chem. Eng. J., 1996, 64, 203 CAS.
- C. C. Hwang, T. H. Huang, J. S. Tsai, C. H. Lin and C. H. Peng, Mater. Sci. Eng., B, 2006, 132, 229 CrossRef CAS.
- A. Q. Wang, N. D'Souza and T. D. Golden, J. Mater. Chem., 2006, 16, 481 RSC.
- A. Vantomme, Z. Y. Yuan, G. Du and B. L. Su, Langmuir, 2005, 21, 1132 CrossRef CAS.
- M. N. Guo, C. X. Guo, L. Y. Jin, Y. J. Wang, J. Q. Lu and M. F. Luo, Mater. Lett., 2011, 64, 1638 CrossRef.
-
(a) X. Yang, C. Cao, L. Erickson, K. Hohn, R. Maghirang and K. Klabunde, J. Catal., 2008, 260, 128 CrossRef CAS;
(b) M. Ariza, F. Martin and D. Leinen, Appl. Phys. A: Mater. Sci. Process., 2001, 73, 579 CrossRef CAS;
(c) E. Paparazzo, G. M. Ingo and N. J. Zachetti, J. Vac. Sci. Technol., A, 1991, 9, 1416 CrossRef CAS.
Footnote |
| † Electronic supplementary information (ESI) available. See DOI: 10.1039/c1ra00524c |
|
| This journal is © The Royal Society of Chemistry 2011 |
Click here to see how this site uses Cookies. View our privacy policy here. 


![[double bond, length as m-dash]](https://www.rsc.org/images/entities/char_e001.gif) O of urea and is confirmed by a peak at 700 cm−1. The mechanism of formation of CeO2 particles may be explained in a similar manner to that proposed for the urea modification TiO2. A simplified form of this mechanism is shown below:28
O of urea and is confirmed by a peak at 700 cm−1. The mechanism of formation of CeO2 particles may be explained in a similar manner to that proposed for the urea modification TiO2. A simplified form of this mechanism is shown below:28