Well controlled core/shell type polymeric microspheres coated with conducting polyaniline: fabrication and electrorheology†
Fei Fei
Fang
,
Ying Dan
Liu
,
Il Sang
Lee
and
Hyoung Jin
Choi
*
Department of Polymer Science and Engineering, Inha University, Incheon, 402-751, Korea. E-mail: hjchoi@inha.ac.kr; Fax: 82-32-865-5178; Tel: 82-32-860-7486
First published on 1st September 2011
Abstract
We report the fabrication and electrorheology of encapsulated core/shell structured microspherical particles with crosslinked poly(methyl methacrylate) (PMMA) as a core and conducting polyaniline (PANI) as a shell. Monodisperse PMMA particles were synthesized by dispersion polymerization initially, and then PANI was coated on the surface modified PMMA core via a chemical oxidation method for the application of electrorheological (ER) materials under an applied electric field strength. For the surface modification, the pristine PMMA microspheres were treated with ethylene glycol dimethacrylate, glycidyl methacrylate and oxydianiline in sequence as a crosslinking, swelling and grafting agent, respectively. Through this way the well controlled core/shell structure with a thick PANI layer was achieved. ER performance of these obtained microspheres dispersed in a silicone oil was investigated, in which their yield stress was analyzed based on the universal equation as a function of applied electric strength. Interesting shear stress curves observed under various electric field strengths were also found to be fitted well with the Cho–Choi–Jhon model of the rheological equation of state.
Introduction
Colloidal suspensions with the ability of being responsive to external electric or magnetic field, such as ferrofluid, electrorheological (ER) and magnetorheological (MR) fluids, have been explored and have attracted particular attention due to not only their scientific interests but also enormous engineering applications. ER fluids, typically composed of polarizable particles dispersed in an insulating liquid, are one such type of fascinating and smart two-phase colloid suspension, whose state can be altered reversibly with the aid of an electric field.1–4 Under an external electric field, the fluid will transform its state from liquid-like to solid-like within a millisecond, consequently inhibiting the fluid flow. It is acknowledged to be caused by the dispersed polarizable particles' attraction to each other to form fibril structures which will orient along the electric field direction.5,6 Meanwhile, the rheological properties of shear viscosity, yield stress, and dynamic modulus of the fluid change dramatically,7–9 along with their magnetically analogous MR suspensions under external magnetic fields,10,11 which have been commercialized in automotive applications.12 Although possessing similar performance, application of ER fluids is not as successful as MR fluids due to their lower yield stresses and difficulty in designing a highly safe high voltage supplier device. However, ER fluids enjoy various new potential applications including the ER smart droplet based microfluidics for chemical reaction and bio-analysis,13 in addition to tactile displays with controlled hardness and vibration.14As for the ER materials, conducting polymers have attracted much attention due to their facile synthesis, low density, fast response to an electric field as well as vast potential in improving the ER effect,1,15–18 in addition to inorganic materials including high dielectric TiO2 and BaTiO3,19,20 zeolite, mesoporous silica21,22 and carbon materials such as carbon nanotubes, graphene and graphene oxide,23–25 both in their pure and hybridized states. Reports on composites composed of inorganic and semi-conducting polymeric particles, their copolymers and small dipole molecule assisted giant ER materials became more and more prevailing.26,27 In addition, morphology factors of the dispersed phase were considered as one of the most critical parameters in the development of not only theoretical modeling but also model materials. Recently, 1D fibrous nanomaterials, polyaniline (PANI) nanofibers for example, have been found to show enhanced ER effects and even improved dispersion stability.2,28,29 A novel core/shell structure, which was much reported currently for preparing conducting polymer nanolayer coated latex particles, transparent and/or tough coating techniques,30 was also introduced for synthesizing ER particles especially for the ones containing conducting materials either as the core or shell part, in order to obtain appropriate conductivity for ER measurement.24,31–33 Note that core/shell structured functional systems have been introduced in various areas including biomedical applications34 and rheology control.35
In a previous study, we have developed PANI coated poly(methyl methacrylate) (PMMA) core/shell structured uniform microparticles prepared for the ER dispersed phase by means of a dispersion polymerization.32,36 The obtained microparticles were monodispersed and spherical in shape. They attributed the observed ER behaviors to the PANI shell because the insulating PMMA core was supposed to be unfavorable to give an ER effect comparing the yield stress of PAPMMA series with that of the PANI based ER system.
In this study, we seek further to enhance the mechanical strength of an inner structure of the core/shell typed microparticles by adding the crosslinking agent of ethylene glycol dimethacrylate (EGDMA)37–39 to the PMMA cores before being coated by the conducting PANI overlayer. Then the ER characteristics of the obtained core/shell microspheres marked as PA–PEGDMA were carefully investigated in this study.
Experimental
Materials
We employed a typical dispersion polymerization method to synthesize the monodispersed PMMA microparticles as follows: purified methyl methacrylate (MMA) monomer and a radical initiator of 2,2-azoisobutyronitrile (AIBN) were dissolved in methanol containing poly(vinyl pyrrolidone) as a stabilizer at room temperature. After removing oxygen by nitrogen purging, the reaction mixture was heated to 55 °C and maintained for 24 h. The obtained monodispersed PMMA microspheres were washed sufficiently by methanol and then dispersed in water prepared for the following PANI polymerization.The shell structure was coated onto the PMMA core microspheres by the following procedures. First, 30 g PMMA monodispersed microparticles were dispersed in 686 g water containing sodium dodecylsulfate (SDS, 2.25 g), and kept under mild stirring to allow SDS contact and adsorption onto the PMMA surface. Second, the mixture of ethylene glycol dimethacrylate (EGDMA, 30 g) and benzoyl peroxide (BPO, 1.8 g) was put into the reactor to react for 12 h. Here, we used the EGDMA as a crosslinking agent compared with the previously used glycidyl methacrylate (GMA) only.40 Then 120 g GMA dissolved in 35 g SDS aqueous solution was allowed to swell the above suspension for about 5 h. The polymerization was followed by increasing temperature of the reaction system up to 75 °C, and then this temperature was kept for 24 h with vigorous stirring. Then, the obtained crosslinked and swollen beads (PEGDMA) were dispersed in acetone containing oxydianiline (ODA, 30 g), and the reaction between glycidyl and amine groups took place at 55 °C.
The PANI shell was prepared by polymerizing aniline within an aqueous acidic medium containing ODA–PEGDMA and poly(vinyl alcohol) as a dispersing stabilizer, and ammonium persulfate (APS) was used as an initiator. The polymerization was kept for 24 h at 0 °C. Then, the synthesized PA–PEGDMA particles were centrifuged and filtered with distilled water, acetone, and methanol to remove excess initiator, monomer, and oligomers, and dried at 65 °C in a vacuum oven for 2 days. In order to apply for the ER materials, the obtained PA–PEGDMA microparticles underwent a dedoping process aimed to produce semiconductive particles. The conductivity of PA–PEGDMA was changed to 7.16 × 10⁻¹¹ S cm−1via the dedoping process.
Characterization
The morphology of obtained particles during synthesis was observed by using a scanning electron microscope (SEM, S-4300, Hitachi) along with an optical microscope (OM) (Olympus BX51, USA). Fourier transform infrared spectroscopy (FT-IR, Perkin Elmer System 2000) was also applied to perform the chemical structure analysis. The thermal properties of PA–PEGDMA as well as other products at each step were examined by using a thermogravimetric analyzer (TGA, TA instrument Q50, USA). The electrical conductivity of the particles was measured via a 4-pin probe resistivity meter (LORESTA-GP).The ER phenomenon under an electric field was detected with an optical microscope (OM) (Olympus BX51, USA) equipped with a DC high voltage generator. ER behaviors were investigated by using a rotational rheometer (Physica, MC120, Germany) equipped with a high DC voltage generator and concentric cylinder type measuring unit. The temperature was maintained at 25 °C and the DC electric field strength was limited to 2.5 kV mm−1 to avoid short circuit. Then, the yield behavior and shear stress curves were analyzed via the reported universal equation and Cho–Choi–Jhon model, respectively.
Results and discussion
Scheme 1 shows the proposed mechanism for this experiment. Initially, both crosslinking agent (EGDMA) and swelling agent (GMA) were added to pure and monodisperse PMMA microspheres to increase their thermal stability along with particle size. Here, attention should be paid to the weight ratio of EGDMA and GMA added to avoid unexpected gel formation. In this way, the epoxide groups are introduced to induce an epoxy resin reaction with amine groups.41 Then, the ODA with two amine groups were added to react with the epoxide groups as well as aniline monomer. Finally, with the aid of the initiator (APS), a dark green PANI shell was formed on the surface of the core spheres.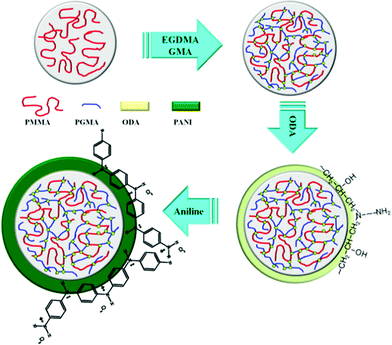 | ||
| Scheme 1 Designed experimental mechanism to synthesize PA–PEGDMA. | ||
The images shown in Fig. 1 are optical microscopy (OM) images for pure PMMA and the microspheres obtained after adding EGDMA/GMA, ODA and aniline, respectively. These OM images collected from different experimental steps are shown at the same magnification (×150). The microparticles are found to be well monodispersed with a uniform spherical shape. After being crosslinked with EGDAM, swollen with GMA, grafted with ODA and finally coated with PANI, the particle size grows synchronously. The average size of the obtained microspheres corresponding to the polymerization procedure was about 5.6 μm, 8.9 μm, 9.51 μm and 10.55 μm, respectively. Interestingly, we observed that the colour of the microparticles turned from white to dark green, which was due to the successful loading of the PANI shell.
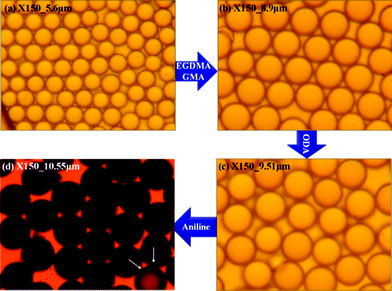 | ||
| Fig. 1 OM images collected from different experimental steps (a) pure PMMA, (b) after adding EGDMA and GMA, (c) after adding ODA and (d) final PA–PEGDMA. | ||
In addition, after comparing these OM images, we found that the surface of the final PA–PEGDMA microspheres seemed to be much rougher than the rest of the particles. A special particle pointed out by the white arrow in Fig. 1(d) is nearly transparent, which suggested a failure in depositing dense PANI layers on the surface.
In addition to the OM images at each experimental step, the FT-IR spectra in Fig. S1 also confirm successful swelling and crosslinking of the PMMA by EGDMA and GMA, as well as the coating layer of PANI. The characteristic bands of PMMA located at 1736 (carbonyl group) and 1152 (ester group) cm−1 are all observed in all product spectra. After being crosslinked by EGDMA and GMA, a small sharp band at 907 cm−1 appears which corresponds to the stretching vibration of the epoxide group in GMA. However, it disappears when the PEGDMA is grafted by ODA due to the amine–epoxy reaction. In both spectra of ODA–PEGDMA and PA–PEGDMA, the stretching of benzoid and the second aromatic amine (C–N) at 1504 and 1253 cm−1, respectively are observed. Additional quinoid stretching at 1595 cm−1 in the PA–PEGDMA confirms the coating of the PANI layer.
Fig. 2 represents SEM images which not only provide information on the size of the microspheres, but also show the surface morphology in detail. Images in Fig. 2 from (a) to (f) follow the experiment step-by-step. We observe that pure PMMA beads possess a smooth surface, even after they were crosslinked and swelled by EGDMA and GMA, respectively. However, after grafting ODA onto the microspheres, in which a glycidyl–amine reaction would take place between the amine functional group of the ODA and epoxy functional group of the GMA, we find that the surface of the particles becomes much rougher than before. When the coating of PANI shell was completed, the surface turned considerably rough. There are many irregularly shaped agglomerates deposited on the surface when we observe a locally magnified view in Fig. 2(f). From this, the PANI which is considered as the outer shell material was polymerized via a conventional polymerization method by dropping the initiator (APS) to the reactor. It was reported that the PANI favoured the production of an aggregated amorphous morphology via traditional polymerization. Thus, this obvious difference in morphology suggests the successful coating of PANI. The growth in particle size is also visible by calculating the diameter based on the SEM images, from which the particle size increased from about 5.74 μm, 6.88 μm, 9.0 μm, 9.63 μm to 10.60 μm. Based on this achieved core/shell structure, we consider the swollen and crosslinked PEGDMA as core material, then, the ODA grafted and PANI coated PA–PEGDMA as shell material. Thus the thickness of the coating can be calculated to be about 0.485 μm. This result is in good agreement with the OM images.
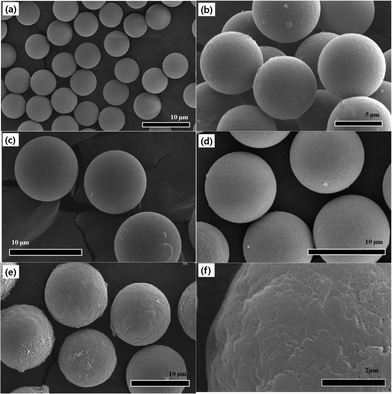 | ||
| Fig. 2 SEM images of (a) pure PMMA, (b) after adding EGDMA, (c) after adding GMA, (d) after adding ODA, (e) and (f) final PA–PEGDMA. | ||
The weight composition and thermal stability were investigated via TGA curves. In Fig. 3(a), the curves labelled from 1 to 4 correspond to the pure PMMA, PEGDMA, ODA–PEGDMA and PA–PEGDMA, respectively. Pure PMMA does not indicate any weight loss until the temperature is increased to about 200 °C, from which the PMMA starts decomposing and finally completes this process until 410 °C. After crosslinking, two weight loss regions appear. The main weight loss in curve 2 from 270 °C to 400 °C is attributed to the degradation of PEGDMA and PGMA, and the following loss is considered as the decomposition of the crosslinked polymer chains. While curve 3 shifts to a high temperature range due to the glycidyl–amine reaction, and a weight loss of 15% from 380 °C is discovered. In the case of PA–PEGDMA, a second weight loss (about 45%) starts at 380 °C42 is attributed to the degradation of crosslinked PMMA, ODA grafted layers and final coated PANI shell. As it shows in curve 3, the upper two components is 15%, therefore, the weight composition of PANI is estimated as 30%. Taking account of the perfect monodisperse size distribution for both ODA treated PEGDMA core and PA–PEGDMA microspheres, we adopt the radius of ODA–PEGDMA core (RODA–PEGDMA) and PA–PEGDMA (RPA–PEGDMA) to calculate the coating thickness (D) via the equations below
 | (1.1) |
 | (1.2) |
 | (1.3) |
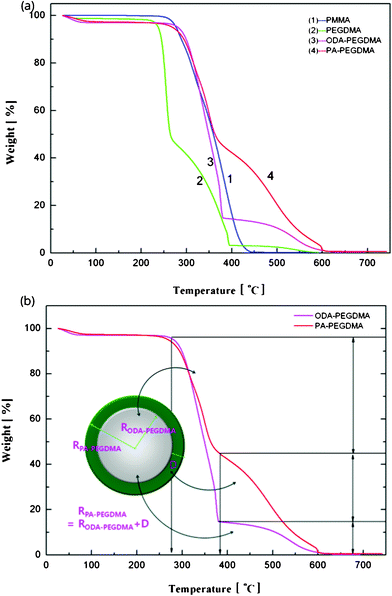 | ||
| Fig. 3 TGA curves of the samples at each step including pure PMMA, after adding EGDMA and GMA, after adding ODA, final PA–PEGDMA (a) and illustration of how to estimate the coating thickness of PANI on the analysis of weight loss (b). | ||
where ρ and V represent the density and volume of the part as marked in their subscript respectively; m is the weight composition of PANI, herein, we assign a value of 30% to it. The density of ODA–PEGDMA and pure PANI are 1.20 and 1.34 g cm−3 as measured via a pycnometer, and RODA–PEGDMA is 9.63/2 μm from the SEM image. The proposed concentric sphere structure is shown in Fig. 3(b), in which the thickness D of coated PANI shell is worked out to be about 0.55 μm. It is a little bigger than the result calculated from SEM images (∼0.485 μm). This can be interpreted by the reasonable error of RODA–PEGDMA which is obtained from the SEM image.
Electrorheological characterizations were carried out via a conventional controlled shear rate (CSR) test, in which the range of shear rate was set from 0.01 to 1000 s−1 in a log–log scale. For each shear rate sweep, the measuring point's duration was set from an initial 10 s to a final 1 s via log–log scale. The resulting flow responses shown in Fig. 4 were examined as a function of an electric field strength ranging from 0 to 2.5 kV mm−1, which not only give information on the shear stresses but also the viscosities of the ER fluid at each electric field strength along with the increasing of shear rate.
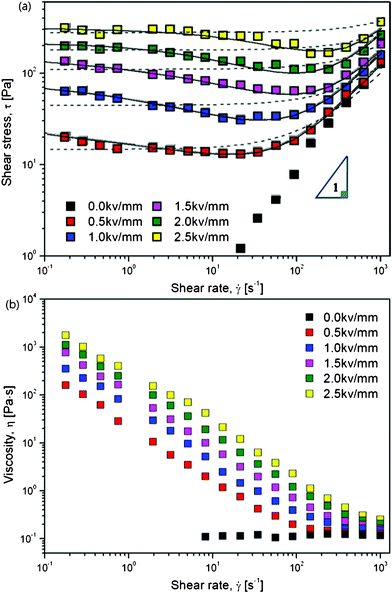 | ||
| Fig. 4 Shear stress (a) and viscosity (b) curves vs. shear rate for PA–PEGDMA based on ER fluids (20 wt%) under various electric field strengths, the dashed lines are fitted via a conventional Bingham model, the solid lines are fitted via a suggested CCJ model. | ||
The ER fluid, which was prepared by dispersing dried PA–PEGDMA particles in a silicone oil with a particle concentration of 20 wt%, exhibits typical ER behavior shown in Fig. 4(a). Without applying an electric field, the ER fluid shows a Newtonian fluid behavior, in which the slope of shear stress to shear rate is nearly one. When exposed to an external electric field, the fluid exhibits non-Newtonian behaviour with increased shear stress as well as a long plateau region which gets longer when the electric field is increased. This can be interpreted that the electrostatic force gets gradually stronger to resist the hydrodynamic force. Interestingly, we find that, this ER fluid based on synthesized PA–PEGDMA particle indicates an unusual decrease trend in shear stress at low shear rate region. Therefore, in this work, we adopt a conventional Bingham model as well as a suggested Cho–Choi–Jhon (CCJ) model43 to describe the unique shear stress behavior and yield stress.
The Bingham model, shown in eqn (2), is the simplest one with two parameters originating from yield stress τ0 and Newtonian viscosity η0 and is widely adopted as a model not only for ER suspensions but also for conventional suspension systems.
 | (2) |
The Bingham model has two flow regimes: a rigid pre-yield behavior for shear stress less than the field-dependent yield stress and Newtonian flow characteristics beyond the yield stress τ0 (post-yield region).44 The dashed lines in Fig. 4(a) are from eqn (2) and indicate a very serious bias. Thus, a recently reported CCJ model shown in eqn (3) is employed to reanalyze the shear stress behaviors by fitting the curves via six parameters.
 | (3) |
The fitting of flow curves for PA–PEGDMA based ER fluids is shown in Fig. 4(a), in which the solid lines perfectly cover the stress decrease phenomena at low shear rate region and provide an accurate value of real yield stress for PA–PEGDMA based ER fluids. The first term in eqn (3) implies the shear stress behavior at a low shear rate region especially in the case of the decrease of shear rate and the second term describes well the shear stress behavior at a high shear rate region. Here, τν is a function of an electric field, ![[small gamma, Greek, dot above]](https://www.rsc.org/images/entities/i_char_e0a2.gif) is the shear rate, and η is the shear viscosity α is related to the decrease in the stress, t1 and t2 are time constants, and η∞ is the viscosity at a high shear rate and is interpreted as the viscosity in the absence of an electric field. The exponent β has the range 0 < β ≤ 1, since dτ/d
is the shear rate, and η is the shear viscosity α is related to the decrease in the stress, t1 and t2 are time constants, and η∞ is the viscosity at a high shear rate and is interpreted as the viscosity in the absence of an electric field. The exponent β has the range 0 < β ≤ 1, since dτ/d![[small gamma, Greek, dot above]](https://www.rsc.org/images/entities/i_char_e0a2.gif) ≥ 0. The yield stresses and the optimal parameters are summarized in Table 1. Note that among six parameters, yield stress τ0 and η∞ are measurable, while four others are estimated from the fitting.
≥ 0. The yield stresses and the optimal parameters are summarized in Table 1. Note that among six parameters, yield stress τ0 and η∞ are measurable, while four others are estimated from the fitting.
| Model | Parameters | Electric field strength (kV mm−1) | ||||
|---|---|---|---|---|---|---|
| 0.5 | 1.0 | 1.5 | 2.0 | 2.5 | ||
| Bingham | τ | 15 | 45 | 111 | 180 | 280 |
| η | 0.09 | 0.08 | 0.10 | 0.10 | 0.10 | |
| CCJ | τ 0 | 25.9 | 86.3 | 153 | 217 | 309 |
| t 1 | 0.25 | 0.20 | 0.10 | 0.05 | 0.01 | |
| α | 0.32 | 0.40 | 0.50 | 0.60 | 0.70 | |
| η ∞ | 0.126 | 0.152 | 0.162 | 0.205 | 0.250 | |
| t 2 | 0.80 | 0.40 | 0.50 | 0.01 | 0.09 | |
| β | 0.70 | 0.80 | 0.85 | 0.90 | 1.0 | |
On the other hand, the physical meanings of the flow curve given in Fig. 4(a) along with eqn (3) can be explained based on our previous observation32 such that the fibrillation of ER particles in shear flow is a breaking and re-formation process caused by the cooperation of electrostatic and hydrodynamic interactions, which are reduced by an external electric and flow field. In the low shear rate region, where the electrostatic interaction is dominant, the aligned particles begin to break with shear deformation and the broken structures tend to re-form chains again. However, the rate of destruction may be faster than the rate of re-formation. Therefore, the shear stress generated decreases with increasing shear rate. Hydrodynamic interactions dominate in the high shear rate region, where fibril particle structures are fully destroyed without re-formation, and the suspension behaves like a pseudo-Newtonian fluid. Note that these phenomena are related to the rate of polarization under the shear by an applied electric field and discussed in conjunction with the dielectric spectra in the case of physically coated PANI onto PMMA microbeads (PA–PMMA)32. Under an electric field, the PA–PMMA particles are polarized by the movement of electrons in the coated PANI layer, and the imaginary counter charges are then induced at the interface between the suspending medium and the PANI layer as well as between the PANI shell and PMMA core. Thereby, the total polarization in these PA–PMMA composite particles was reduced by the latter interfacial polarization, which has an opposite direction in comparison to an applied electric field direction. The electrostatic interaction among PAPMMA particles thus becomes weaker than that among PANI particles. However, it is found that compared to the previous result, PA–PEGDMA based ER fluids shows improved ER performance probably due to both grafting and crosslinking.
Non-Newtonian performances are also observed in Fig. 4(b), where the ER fluid shows typical shear thinning phenomenon at each electric field as compared to the uniform viscosity at E = 0 kV mm−1. It is an expression to show the deformation of the aligned PA–PEGDMA particles under both electric and shear fields.
After describing the shear stress curves, we investigated the dependence of dynamic yield stress on applied electric field strength. Here, we estimated the dynamic yield stress from a controlled shear rate measurement by extrapolating the shear stress45 at shear rate = 1 s−1. Then, we plotted the dynamic yield stress as a function of electric field strength. It is well known that in general, the correlation of the dynamic yield stress and electric field is presented as follows:
| τy ∝ Em | (4) |
The dependency of the dynamic yield stress on the electric field strength differs from the E2 dependency suggested by the polarization model46,47 depending on the particle concentration, particle shape and applied electric field strength. The applied electric field induces electrostatic polarized interactions among the particles and also between the particles and the electrodes.
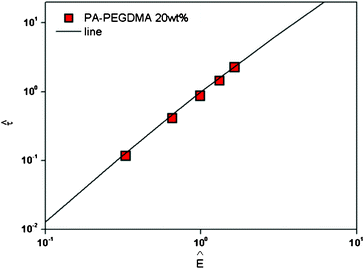
However, the polarization model does not describe the flow effect accurately; in that case, the ER response is influenced by the conductivity mismatch and the interaction between particles and medium. Various ER fluids show different exponents in eqn (4).15,48,49 A correlation between yield stress and the electric field strength is represented in Fig. 5 and 6. To correlate the dynamic yield stress with the broad range of electric field strengths, Choi et al.50 introduced the universal yield stress equation.
 | (5) |
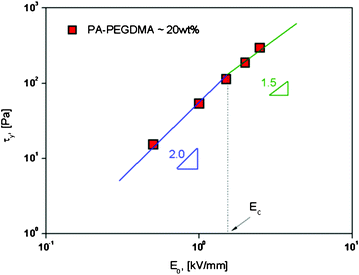 | ||
| Fig. 5 Replotted yield stress versus electric field strengths for PA–PEGDMA based ER fluids. | ||
Here, the parameter α depends on the dielectric property of the fluid, the particle volume fraction, and the critical electric field (Ec). Ec originated from the nonlinear conductivity effect can be obtained by the crossover point of the slopes for all ranges of the electric field strengths corresponding to the polarization model (slope = 2) and conductivity model (slope = 1.5), respectively.51 As shown in Fig. 5, the estimated Ec was found to be 1.527 kV mm−1 for PA–PEGDMA 20 wt% based ER fluids.
In order to collapse the data into a single curve, we normalized eqn (5) using Ec and τy(Ec) = 0.762αEc2
 | (6) |
Here,  and
and  . We found that the data obtained from Fig. 5 collapsed onto a single curve via normalized universal yield stress equation (eqn (6)) as shown in Fig. 6. Therefore, eqn (6) is believed to be very useful in constructing the master curve not only for ER fluids in this study but also for MR fluids under an applied magnetic field strength (H) with the same type of equation.52 In addition, note that the deviation of the Ec does not change the scaled universal yield stress equation itself but the point moves following the universal yield stress equation, moving up for the higher Ec and moving down for the lower Ec. It can also be noted that a new scaling function capable of modelling the yield stress behaviour of ER fluids has also been introduced recently.53
Finally, the changes in microstructure for this ER fluid were observed by using an optical microscope under a DC applied electric field using a DC high voltage source.54 The gap between two parallel electrodes was fixed at ca. 400 μm. A DC electric field was maintained for 3 min at 25 °C to obtain an equilibrium columnar structure. Fig. 7 represents that the PANI coated PEGDMA microspheres based ER fluid shows a typical ER fibril structure. When the electric field is absent (Fig. 7a), the particles are found randomly dispersed in silicone oil, thus leading to a liquid-like state. Nevertheless, when the electric field is present (Fig. 7b), the microspheres start to move and form chains or columns with the adjacent particles. At last, PA–PEGDMA spheres align along the direction of the applied electric field forming a strong fibrillated structure. Normally, this unique phenomenon for ER fluids under external applied electric field takes place within milliseconds and the network structure remains as long as the field is applied.
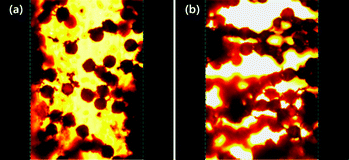 | ||
| Fig. 7 Optical microscopy images of PA–PEGDMA composite particles in silicone oil under an electric field of 0 kV mm−1 (a) and an electric field of 0.3 kV mm−1 (b). | ||
Conclusion
We synthesized core–shell type microspheres by adopting crosslinked and swollen PMMA as a core material and PANI as a shell material. Both SEM and OM images confirmed the expected core/shell morphology as well as particle size. TGA curves demonstrated the enhanced thermal stability due to the crosslinking process along with the induced glycidyl–amine reaction. Additionally, based on the weight composition between core part and shell part, the coating thickness was calculated to be about 0.55 μm. The ER fluid based on synthesized PA–PEGDMA microspheres exhibited typical ER performances. The shear stress curves were analyzed via a suggested CCJ model which accurately fitted the unusual behavior in a low shear rate range. Besides, the relationship between shear stress and electric field strength was well interpreted by adopting a reported universal equation.Acknowledgements
This work was supported by the National Research Foundation (#43450-1), Korea (2011).References
- (a) J. B. Yin, X. A. Xia, L. Q. Xiang and X. P. Zhao, J. Mater. Chem., 2010, 20, 7096 RSC; (b) H. J. Choi and M. S. Jhon, Soft Matter, 2009, 5, 1562 RSC; (c) X. Niu, M. Zhang, J. Wu, W. Wen and P. Sheng, Soft Matter, 2009, 5, 576 RSC.
- J. Yin and X. Zhao, Nanoscale Res. Lett., 2011, 6, 256 CrossRef.
- (a) Z. Rozynek, K. D. Knudsen, J. O. Fossum, Y. Ḿeheust, B. Wang and M. Zhou, J. Phys.: Condens. Matter, 2010, 22, 324104 CrossRef CAS; (b) T. Z. Cabuk, B. Sari and H. I. Unal, J. Appl. Polym. Sci., 2010, 117, 3659 CAS.
- (a) Q. Cheng, V. Pavlinek, Y. He, Y. Yan, C. Li and P. Saha, Colloid Polym. Sci., 2011, 289, 799 CrossRef CAS; (b) G. L. Gulley and R. Tao, Phys. Rev. E: Stat. Phys., Plasmas, Fluids, Relat. Interdiscip. Top., 1997, 56, 4328 CrossRef CAS.
- Y. G. Ko, S. S. Shin, U. S. Choi, Y. S. Park and J. W. Woo, ACS Appl. Mater. Interfaces, 2011, 3, 1289 CAS.
- (a) Y. D. Liu, F. F. Fang and H. J. Choi, Langmuir, 2010, 26, 12849 CrossRef CAS; (b) J. W. Kim, F. Liu and H. J. Choi, J. Ind. Eng. Chem., 2002, 8, 399 CAS.
- (a) B. Wang, M. Zhou, Z. Rozynek and J. O. Fossum, J. Mater. Chem., 2009, 19, 1816 RSC; (b) D. J. Klingenberg and C. F. Zukoski, Langmuir, 1990, 6, 15 CrossRef CAS.
- (a) P. Hiamtup, A. Sirivat and A. M. Jamieson, J. Mater. Sci., 2010, 45, 1972 CrossRef CAS; (b) O. Volkova, S. Cutillas and G. Bossis, Phys. Rev. Lett., 1999, 82, 233 CrossRef CAS.
- C. Metayer, V. A. Sterligov, A. Meunier, G. Bossis, J. Persello and S. V. Svechnikov, J. Phys.: Condens. Matter, 2004, 16, S3975 CrossRef CAS.
- (a) J. de Vicente, D. J. Klingenberg and R. Hidalgo-Alvarez, Soft Matter, 2011, 7, 3701 RSC; (b) I. Bica, J. Ind. Eng. Chem., 2010, 16, 359 CAS.
- B. J. Park, F. F. Fang and H. J. Choi, Soft Matter, 2010, 6, 5246 RSC.
- (a) J. D. Carlson, D. M. Catanzarite and K. A. StClair, Int. J. Mod. Phys. B, 1996, 10, 2857 CrossRef CAS; (b) D. E. Barber and J. D. Carlson, J. Intell. Mater. Syst. Struct., 2010, 21, 1509 CrossRef CAS.
- (a) M. Zhang, X. Gong and W. Wen, Electrophoresis, 2009, 30, 3116 CrossRef CAS; (b) X. Q. Gong and W. J. Wen, Biomicrofluidics, 2009, 3, 012007 CrossRef; (c) X. Q. Gong, L. M. Wang and W. J. Wen, Chem. Commun., 2009, 4690 RSC.
- Y. J. Liu, R. Davidson and P. Taylor, Smart Mater. Struct., 2005, 14, 1563 CrossRef.
- H. J. Choi, J. H. Lee, M. S. Cho and M. S. Jhon, Polym. Eng. Sci., 1999, 39, 493 CAS.
- J. Akhavan, Proc. Inst. Mech. Eng., Part G, 2007, 221, 577 CAS.
- J. Yin, X. Zhao, X. Xia, L. Xiang and Y. Qiao, Polymer, 2008, 49, 4413 CrossRef CAS.
- Y. D. Kim and J. H. Kim, Colloid Polym. Sci., 2008, 286, 631 CAS.
- (a) Y. C. Cheng, J. J. Guo, X. H. Liu, A. H. Sun, G. J. Xu and P. Cui, J. Mater. Chem., 2011, 21, 5051 RSC; (b) J. Yin, X. Zhao, L. Xiang, X. Xia and Z. Zhang, Soft Matter, 2009, 5, 4687 RSC; (c) P. Tan, J. Huang, D. Liu, W. Tian and L. Zhou, Soft Matter, 2010, 6, 4800 RSC.
- K. Mimura, Y. Nishimoto, H. Orihara, M. Moriya, W. Sakamoto and T. Yogo, Angew. Chem., Int. Ed., 2010, 49, 4902 CrossRef CAS.
- Q. L. Cheng, Y. He, A. Lengalova, C. Z. Li and P. Saha, Colloids Surf., A, 2008, 318, 169 CrossRef CAS.
- M. S. Cho, H. J. Choi and W. S. Ahn, Langmuir, 2004, 20, 202 CrossRef CAS.
- (a) M. Li, X. Wang, R. Tian, F. Liu, H. Hu, R. Chen, H. Zheng and L. Wan, Composites, Part A, 2009, 40, 413 CrossRef; (b) K. Zhang and H. J. Choi, Diamond Relat. Mater., 2011, 20, 275 CrossRef CAS; (c) K. Lozano, C. Hernandez, T. W. Petty, M. B. Sigman and B. Korgel, J. Colloid Interface Sci., 2006, 297, 618 CrossRef CAS.
- W. L. Zhang, Y. D. Liu and H. J. Choi, J. Mater. Chem., 2011, 21, 6916 RSC.
- (a) H. Hu, X. Wang, J. Wang, F. Liu, M. Zhang and C. Xu, Appl. Surf. Sci., 2011, 257, 2637 CrossRef CAS; (b) W. L. Zhang, B. J. Park and H. J. Choi, Chem. Commun., 2010, 46, 5596 RSC.
- J. B. Yin and X. P. Zhao, Chem. Phys. Lett., 2004, 398, 393 CrossRef CAS.
- (a) W. J. Wen, X. X. Huang and P. Sheng, Appl. Phys. Lett., 2004, 85, 299 CrossRef CAS; (b) X. X. Huang, W. J. Wen, S. H. Yang and P. Sheng, Solid State Commun., 2006, 139, 581 CrossRef CAS.
- (a) J. B. Yin, X. A. Xia, L. Q. Xiang and X. P. Zhao, Carbon, 2010, 48, 2958 CrossRef CAS; (b) J. Yin and X. Zhao, Nanoscale Res. Lett., 2011, 6, 256 CrossRef.
- (a) Y. D. Liu, F. F. Fang and H. J. Choi, Soft Matter, 2011, 7, 2782 RSC; (b) B. M. Lee, J. E. Kim, F. F. Fang, H. J. Choi and J. F. Feller, Macromol. Chem. Phys. DOI:10.1002/macp.201100306.
- (a) M. A. Khan and S. P. Armes, Adv. Mater., 2000, 12, 671 CrossRef CAS; (b) J. A. Balmer, O. O. Mykhaylyk, S. P. Armes, J. P. A. Fairclough, A. J. Ryan, J. Gummel, M. W. Murray, K. A. Murray and N. S. J. Williams, J. Am. Chem. Soc., 2011, 133, 826 CrossRef CAS; (c) X. Deng, L. Mammen, Y. Zhao, P. Lellig, K. Müllen, C. Li, H. J. Butt and D. Vollmer, Adv. Mater., 2011 DOI:10.1002/adma.201100410.
- Y. D. Liu, J. E. Kim and H. J. Choi, Macromol. Rapid Commun., 2011, 32, 881 CrossRef CAS.
- M. S. Cho, Y. H. Cho, H. J. Choi and M. S. Jhon, Langmuir, 2003, 19, 5875 CrossRef CAS.
- (a) J. Y. Hong, E. Kwon and J. Jang, Soft Matter, 2009, 5, 951 RSC; (b) J. Y. Hong and J. Jang, Soft Matter, 2010, 6, 4669 RSC.
- (a) S. Dai, P. Ravi and K. C. Tam, Soft Matter, 2009, 5, 2513 RSC; (b) S. Reinicke, S. Dohler, S. Tea, M. Krekhova, R. Messing, A. M. Schmidt and H. Schmalz, Soft Matter, 2010, 6, 2760 RSC.
- E. van Ruymbeke, A. Pamvouxoglou, D. Vlassopoulos, G. Petekidis, G. Mountrichas and S. Pispas, Soft Matter, 2010, 6, 881 RSC.
- Y. H. Cho, M. S. Cho, H. J. Choi and M. S. Jhon, Colloid Polym. Sci., 2002, 280, 1062 CAS.
- A. Pich, Y. Lu and H. J. Adler, Colloid Polym. Sci., 2003, 281, 907 CAS.
- A. Pich, V. Boyko, Y. Lu, S. Richter, H. J. Adler and K. F. Arndt, Colloid Polym. Sci., 2003, 281, 916 CAS.
- P. K. Ajikumar and K. S. Devaky, Proc.–Indian Acad. Sci., Chem. Sci., 2000, 112, 465 CrossRef CAS.
- I. S. Lee, M. S. Cho and H. J. Choi, Polymer, 2005, 46, 1317 CrossRef CAS.
- V. L. Zvetkov, Macromol. Chem. Phys., 2002, 203, 467 CrossRef CAS.
- L. Ding, X. Wang and R. V. Gregory, Synth. Met., 1999, 104, 73 CrossRef CAS.
- (a) M. S. Cho, H. J. Choi and M. S. Jhon, Polymer, 2005, 46, 11484 CrossRef CAS; (b) C. H. Hong, H. J. Choi and M. S. Jhon, Chem. Mater., 2006, 18, 2771 CrossRef CAS.
- Y. Kim and D. Park, Colloid Polym. Sci., 2002, 280, 828 CAS.
- D. F. James and B. C. Blakey, Korea-Australia Rheol. J., 2004, 16, 109 Search PubMed.
- D. J. Klingenberg, F. v. Swol and C. F. Zukoski, J. Chem. Phys., 1991, 94, 6170 CrossRef CAS.
- M. Stenicka, V. Pavlinek, P. Saha, N. V. Blinova, J. Stejskal and O. Quadrat, Colloid Polym. Sci., 2009, 287, 403 CAS.
- D. Chotpattananont, A. Sirivat and A. M. Jamieson, Macromol. Mater. Eng., 2004, 289, 434 CrossRef CAS.
- R. Shen, X. Wang, Y. Lu, D. Wang, G. Sun, Z. Cao and K. Lu, Adv. Mater., 2009, 21, 4631 CrossRef CAS.
- H. J. Choi, M. S. Cho, J. W. Kim, C. A. Kim and M. S. Jhon, Appl. Phys. Lett., 2001, 78, 3806 CrossRef CAS.
- (a) S. G. Kim, J. Y. Lim, J. H. Sung, H. J. Choi and Y. Seo, Polymer, 2007, 48, 6622 CrossRef CAS; (b) S. G. Kim, J. Y. Lim, J. H. Sung, H. J. Choi and Y. Seo, Polymer, 2011, 52, 2460 CrossRef CAS.
- F. F. Fang, H. J. Choi and M. S. Jhon, Colloids Surf., A, 2009, 351, 46 CrossRef CAS.
- Y. Seo, J. Non-Newtonian Fluid Mech., 2011, 166, 241 CrossRef CAS.
- S. G. Kim, J. W. Kim, W. H. Jang, H. J. Choi and M. S. Jhon, Polymer, 2001, 42, 5005 CrossRef CAS.
Footnote |
| † Electronic supplementary information (ESI) available: FT-IR spectra of the experimental products at each step. See DOI: 10.1039/c1ra00325a |
| This journal is © The Royal Society of Chemistry 2011 |

![[small tau, Greek, circumflex]](https://www.rsc.org/images/entities/i_char_e0b8.gif) versus Ê
versus Ê