Acid-catalyzed hydrolysis of cellulose and cellulosic waste using a microwave reactor system
Angela M.
Orozco
*a,
Ala'a H.
Al-Muhtaseb
*bc,
Ahmad B.
Albadarin
a,
David
Rooney
a,
Gavin M.
Walker
a and
Mohammad N. M.
Ahmad
ac
aQUESTOR, School of Chemistry and Chemical Engineering, Queen's University Belfast, Belfast, BT9 5AG, Northern Ireland, UK. E-mail: a.orozco@qub.ac.uk
bDepartment of Chemical Engineering, Faculty of Engineering, Al-Hussein Bin Talal University, P.O. Box (20), Ma'an, Jordan. E-mail: a.almuhtaseb@ahu.edu.jo
cPetroleum and Chemical Engineering Department, Faculty of Engineering, Sultan Qaboos University, P.O. Box 33, Al-khod, 123, Oman
First published on 1st September 2011
Abstract
A microwave reactor system was investigated as a potential technique to maximize sugar yield for the hydrolysis of municipal solid waste for ethanol production. Specifically, dilute acid hydrolysis of α-cellulose and waste cellulosic biomass (grass clippings) with phosphoric acid was undertaken within the microwave reactor system. The experimental data and reaction kinetic analysis indicate that the use of a microwave reactor system can successfully facilitate dilute acid hydrolysis of cellulose and waste cellulosic biomass, producing high yields of total sugars in short reaction times. The maximum yield of reducing sugars was obtained at 7.5% (w/v) phosphoric acid and 160 °C, corresponding to 60% of the theoretical total sugars, with a reaction time of 5 min. When using a very low acid concentration (0.4% w/v) for the hydrolysis in the microwave reactor, it was found that 10 g of total sugars/100 g dry mass was produced, which is significant considering the low acid concentration. When hydrolyzing grass clippings using the microwave reactor, the optimum conditions were an acid concentration of 2.5% (w/v), 175 °C with a 15 min reaction time, giving 18 g/100 g dry mass of total sugars, with xylose being the sugar with the highest yield. It was observed that pentose sugars were more easily formed but also more easily degraded, these being significantly affected by increases in acid concentration and temperature. Kinetic modeling of the data indicated that the use of microwave heating may account for an increase in reaction rate constant, k1, found in this study in comparison with conventional systems described in the literature.
1 Introduction
The urgent need for alternative renewable energies to supplement petroleum-based fuels and the reduction in the number and size of landfill sites for disposal of solid waste makes it increasingly attractive to produce biofuels from municipal solid waste (MSW) fractions.1 In the UK approximately 32 million tonnes of MSW are produced each year with 92% of this going to landfill.Lignocellulosic biomass is considered an agro-energy feedstock with great potential to be used in biorefinery.2 While biofuel, such as ethanol, derived from the fermentation of sugar cane is viable, bioethanol derived from other sugar- or starch-rich plants invokes other environmental problems. Corn is one of the most water intensive crops, and demands large quantities of nitrogen-based fertilizers.3 Therefore, production of ethanol from lignocellulosic material derived from municipal solid wastes has a tremendous potential to reduce problems caused by our dependence on fossil fuels,4 this is due to the sustainable availability of the waste in large quantities; the avoidance of the conflict with production of food products, and a reduction in the quantity of waste that would otherwise exert pressure on municipal landfills.5,6
Like any other lignocellulosic municipal solid waste, grass clippings primarily comprise three major fractions, cellulose, hemicelluloses and lignin. Acid-catalyzed hydrolysis has been widely employed to break down cellulose and hemicelluloses polymers in lignocellulosic biomass to form individual sugar molecules which can be subsequently fermented to ethanol.7,8 The dilute acid hydrolysis of lignocellulosic materials is an attractive process due to the several advantages it offers. There is no need for pretreatment as the acid is known to penetrate lignin components, the acid does not need to be recovered and corrosion problems in the equipment are reduced when compared with concentrated acid hydrolysis processes.9
The interest in the use of H3PO4 acid is that after neutralization with NaOH, it will yield sodium phosphate which will remain in the hydrolysates and can subsequently be used as a nutrient by microorganisms in down-stream fermentation media etc. Therefore, filtration is not required with the consequent advantage of improving the economics of the process; it is also friendly to the environment (the salt formed is not a waste).10
Microwave heating has a number of advantages over conventional heating such as high selectivity, uniformity and shorter heating time. Microwave heating needs less energy input than conventional methods such as steam explosion to pretreat biomass.11 In conventional heating, heat transfer depends on the thermal conductivity, the temperature difference across the material, and convection currents. As a result the temperature increases slowly, while in microwave heating, much faster temperature increases can be obtained, leading to higher yields, milder reaction conditions and shorter reaction times, thus resulting in process improvements.12 When microwaves are used to treat lignocellulose, they selectively heat the more polar materials and create a “hot spot” within the heterogeneous biomass. It is hypothesized that this unique heating feature results in an “explosion” effect among the particles, and improves the disruption of the recalcitrant structures of lignocellulose. In addition, the electromagnetic field used in the microwave reactor may promote non-thermal effects that also accelerate the destruction of the crystal structures.13
Ha et al.8 reported a significant enhancement in both rate and yield of reducing sugars was achieved during the enzymatic hydrolysis of cellulose regenerated from ionic liquid dissolution pretreatment with microwave irradiation. Hu and Wen13 found that when switchgrass was soaked in water and treated by microwave, total sugar (xylose + glucose) yield from the combined treatment and hydrolysis was 58.5% of the maximum potential sugars released. This yield was 53% higher than that obtained from conventional heating of switchgrass. A sugar yield of 79% was reported from rice straw pretreated by microwave/alkali for 30 min.14
To date microwave reactor systems have not been investigated intensively as a potential technique to maximize sugar yield in the hydrolysis of cellulose typically found in municipal solid waste for ethanol production. Therefore it is the aim of this work to investigate dilute acid hydrolysis of cellulose and cellulosic municipal solid waste biomass (grass clippings) with phosphoric acid using a ‘Mars’ microwave reactor. Process parameters investigated include variation in reaction temperature (135–200 °C) and acid catalyst concentration (0.4–10% w/v).
2 Materials and methods
2.1 Experimental aim
For the purposes of this research work the conditions varied were temperature and acid concentration. The raw material was hydrolysed at 135, 150, 175 and 200 °C using phosphoric acid at 0.4, 2.5, 5, 7.5 and 10% (w/w) acid concentrations. The raw material substrates studied were α-cellulose and grass clippings (Ryegrass, Lolium spp.).2.2 α-Cellulose
α-Cellulose was purchased from Sigma-Aldrich. It is a white powder, with a bulk density between 3.1 to 4.3 cm3 g−1. It contains 77.33% cellulose and 20.09% xylan on a dry basis. The calorific value of the cellulose was 16.06 MJ kg−1.2.3 Grass clippings
Grass clippings (Ryegrass, Lolium spp.) were collected from the lawns of Queen's University Belfast. The main components of grass on a dry basis are shown in Table 1 and its calorific value was 17.07 MJ kg−1.| Component | Weight % (g/100 g dry mass) |
|---|---|
| Cellulose | 21.60 |
| Hemicellulose | 22.12 |
| Xylan | 18.72 |
| Arabanan | 3.40 |
| Klason lignin | 2.89 |
| Ashes | 13.01 |
| Carbon | 43.93 |
| Hydrogen | 6.34 |
| Nitrogen | 0.76 |
2.4 Analytical methods
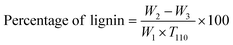 | (1) |
2.4.3.1 Moisture analysis. Moisture content of a sample of grass clippings was measured by weighing out a recorded amount of sample and placing it in an oven at 110 °C until the dry weight of the sample was constant over a 2 h period.
2.5 Sugar analysis
![[thin space (1/6-em)]](https://www.rsc.org/images/entities/char_2009.gif) 000 rpm for 15 min in a Micro Centaur MSE centrifuge, and after, the sample was filtered with a cellulose nitrate membrane filter ‘Whatman’ of 0.45 μm pore size and 25 mm diameter. The samples were kept in the fridge at 4 °C.
000 rpm for 15 min in a Micro Centaur MSE centrifuge, and after, the sample was filtered with a cellulose nitrate membrane filter ‘Whatman’ of 0.45 μm pore size and 25 mm diameter. The samples were kept in the fridge at 4 °C.
2.6 Dilute acid hydrolysis
3 Results and discussion
3.1 α-Cellulose hydrolysis in the ‘Explorer microwave reactor’
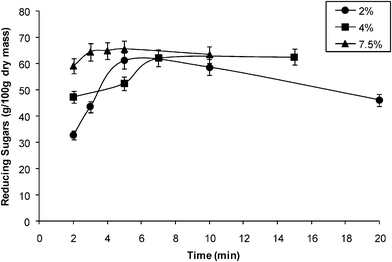 | ||
| Fig. 1 Effect of acid concentration on the dilute acid hydrolysis of α-cellulose at a reaction temperature of 160 °C. | ||
The maximum yield of reducing sugars (Fig. 1) obtained was 65.52 g/100 g dry mass corresponding to 59% of conversion of α-cellulose at 7.5% (w/v) phosphoric acid and a reaction time of 5 min. For other acid concentrations the yield was similar, 56.37 g/100 g dry mass at 15 min, and 55.07 g/100 g dry mass at 5 min for 4.0% and 2.0% (w/v) acid concentration respectively. The data gave an average reducing sugars yield of 56.8%. No significant difference was observed in the yield at the different acid concentrations, i.e. the acid concentration of 2% provided the required amount of acid for hydrolysis. On analysis of the reaction time for maximum yield, it was found that the more concentrated acid took less time to reach the maximum yield. This is expected, as the acid is the catalyst of the hydrolysis reaction.
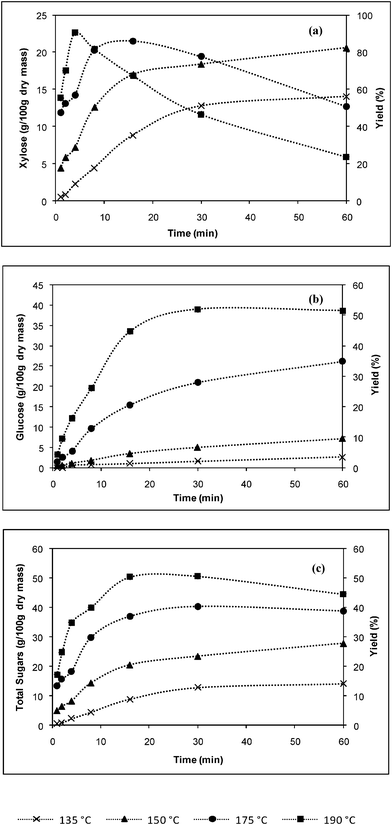 | ||
| Fig. 2 Effect of temperature on the dilute acid hydrolysis of α-cellulose at phosphoric acid concentrations of 2% (w/v) in (a) xylose, (b) glucose and (c) total sugars formation. | ||
Higher temperatures resulted in an increase in the rate of xylose production, with subsequent degradation. Almost all xylan was converted to xylose at a phosphoric acid concentrations of 2% (w/v), 190 °C and 4 min corresponding to 25 g/100 g dry mass. It is known that glucose is difficult to obtain from cellulose due to its crystalline structure. The maximum yield of glucose (Fig. 2b) was obtained at 2% (w/v), 190 °C and 30 min, where 39.71 g/100 g dry mass was obtained, similar observations were reported in references 9,13 and 15.
The data of total sugar production from the acid hydrolysis with phosphoric acid at 2% (w/v) are shown in Fig. 2c. The maximum total sugars were obtained at 190 °C after 30 min of reaction time. This was just prior to significant xylose degradation at stage of the reaction, with a yield of 50% of total sugars. Xylose reached its maximum yield before glucose, causing total sugars to decrease in value; however, maximum glucose yield is far beyond the optimum xylose formation. In this case, degradation was not prominent; however, some xylose was degraded to furfural. It has been reported that furfural completely inhibited fermentation when concentrations were higher than 4.6 g l−1, and inhibited fermentation by 25% at 0.4 g l−1.16 In the case of glucose degradation products, hydroxymethylfurfural (HFM) is also known to affect fermentation, but not as severe as furfural. HFM in a concentration of 4.0 g l−1 reduced the carbon dioxide evolution rate by 32%.17
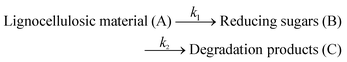
Saeman
18 found that a simple two-step reaction model adequately described the generation of sugars during wood hydrolysis. Saeman's model assumes first-order, irreversible reactions as shown.
 | (2) |
The two-fraction model proposes that xylose is released by the hydrolysis of xylan and then further decomposed to other groups under severe conditions. As above both the release and decomposition are generally considered to be first order reactions.20 The model assumes that only a fraction of the reactant participates in the reaction. This is termed the fast fraction and the fraction that does not react or reacts slowly is termed the slow fraction.21 The ratio between the two fractions is a measure for the parameter α (g g−1), mass fraction of the susceptible polymer in the raw material.10 Under these circumstances, the rate equation dominates the kinetics of xylan hydrolysis and thus the two-fraction model can be written as follows:20
 | (3) |
The calculated rate constants k1for reducing sugars formation and k2 for reducing sugars degradation, in min−1, using the Saeman and the two-fraction models are shown in Table 2. Fig. 3a and b show the comparison between the experimental data and the predicted values using the Saeman model and the two-fraction model, respectively. In both models, k1 increases with the acid concentration. The best fit is given by the two-fraction model, as shown by the correlation coefficient, R2 values, which are higher than those obtained for the Saeman model. The kinetic constants found with the two-fraction model are higher than those found with the Saeman model. Similar observations were reported in references 5,10,15,20 and 22–24.
 | ||
| Fig. 3 Experimental and predicted reducing sugars formation from the acid hydrolysis of α-cellulose using (a) the Saeman model, (b) the two-fraction model. | ||
| Saeman model | Two-fraction model | ||||||
|---|---|---|---|---|---|---|---|
| % (w/v) H3PO4 | k 1 (min−1) | k 2 (min−1) | R 2 | α | k 1 (min−1) | k 2 (min−1) | R 2 |
| 2.0 | 0.192 | 0.062 | 0.918 | 0.765 | 0.277 | 0.038 | 0.947 |
| 4.0 | 0.199 | 0.055 | 0.680 | 0.542 | 0.712 | 0.000 | 0.716 |
| 7.5 | 0.359 | 0.082 | 0.875 | 0.610 | 1.071 | 0.007 | 0.985 |
The reactions at 2.0, 4.0 and 7.5% (w/v) have α values of 0.765 g g−1, 0.542 g g−1 and 0.610 g g−1, respectively. These values are within the range of 0.55–1.00.25 In this case, the value of α does not correlate with the acid concentration for the hydrolysis reaction in the microwave reactor, this is in agreement with the findings of Rodríguez-Chong et al.23 In their work on the kinetics of dilute acid hydrolysis of sorghum straw using sulphuric acid at 4% and 122 °C, Téllez-Luis et al.22 quoted that the rate constants were k1 = 0.086784 min−1 and k2 = −0.000570 min−1. The values of k1 and k2 in this study were higher than those reported by Téllez-Luis et al.,22 this difference could be primarily attributed to the catalyst used and the effect of microwaves on the rate of glucose degradation. The absorbed microwave power within the system is a function of the dielectric loss factor and relative dielectric constant of the materials within the reactor. However, these parameters essentially remain constant under the experimental conditions in this study.
More significantly, microwave fields usually affect hydrogen-bonding networks which may lead to an increase in the rate of breakage of the cellulosic structure; also it is known that microwaves can heat the sample uniformly from the inside and efficiently break down the lignin-hemicellulose structure, destroy the crystal structure of cellulose and degrade the hemicelluloses into reducing sugar. These factors may account for the increase in reaction rate constant, k1, in the microwave reactor in comparison with conventional systems. Moreover, the kinetic analysis would indicate that the primary advantages of employing microwave heating were (1) achieving a high rate constant at moderate temperatures; (2) preventing ‘hot spot’ formation within the reactor, which would have caused localized degradation of glucose.
 | ||
| Fig. 4 α-Cellulose hydrolysis at a phosphoric acid concentration of 0.4% (w/v) and a reaction temperature of 150 °C. | ||
It is important to mention that in this reaction the Evaporative Light Scattering Detector (ELSD) was used for the analysis of sugars. In the chromatogram two peaks were found, one was glucose and the other xylose (see Fig. 5). Xylose was more affected by degradation than glucose because the peak area decreased faster that the peak area for glucose.
 | ||
| Fig. 5 Peak area comparison of glucose, xylose and total sugars formation from the diluted acid hydrolysis of α-cellulose at a phosphoric acid concentration of 0.4% (w/v) and a reaction temperature of 150 °C. | ||
The highest glucose yield was achieved after 15 min (17.5%). Between 15 and 30 min there was no further glucose formation. This may be attributed to glucose degradation. The maximum reducing sugars concentration was reached after 10 min, after this time xylose started degrading.
3.2 Grass clippings hydrolysis in the “Mars microwave reactor”
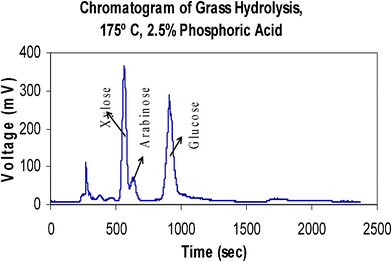 | ||
| Fig. 6 Chromatogram of grass hydrolysate using the Evaporative Light Scattering Detector (ELSD). | ||
 | ||
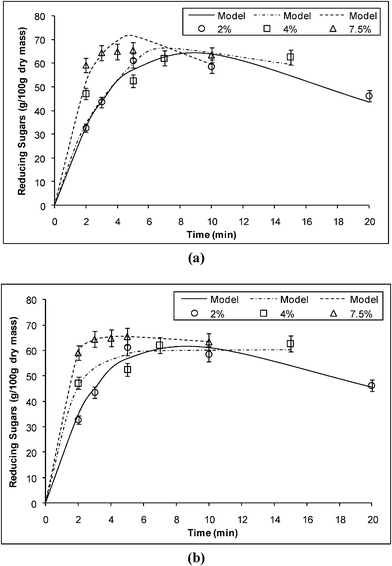
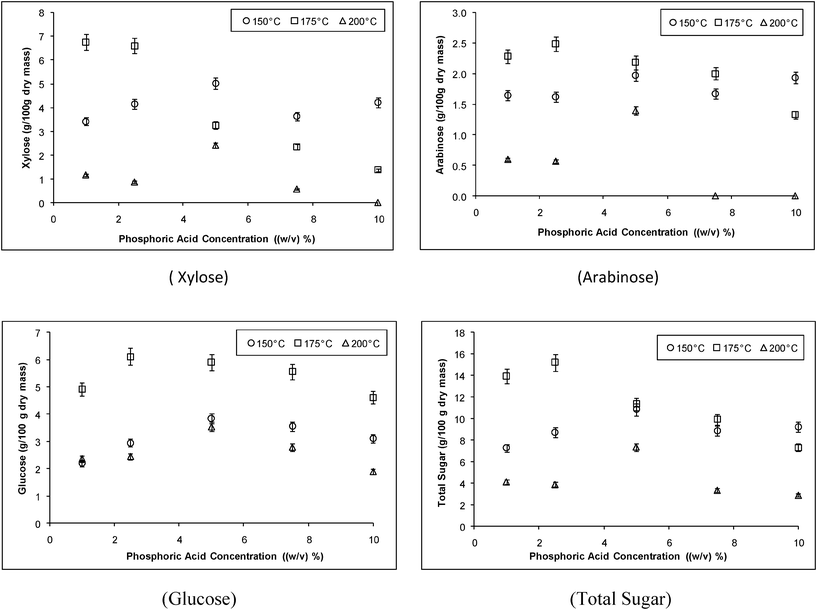
| Fig. 7 Grass hydrolysis in the microwave reactor at different phosphoric acid concentrations and a reaction temperature of 175 °C. | ||
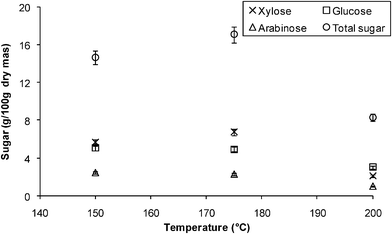 | ||
| Fig. 8 Grass hydrolysis in the microwave reactor-effect of temperature at 1% (w/v) phosphoric acid. | ||
 | ||
| Fig. 9 Grass hydrolysis in the microwave reactor. | ||
Conclusions
This work shows the viability of using microwave irradiation as an efficient heating method in dilute acid hydrolysis of cellulose and waste cellulosic biomass, allowing high yields of total sugars in short reaction times. The data indicate that waste grass clippings have the potential to be a biomass feedstock for ethanol production due to the high content of cellulose and hemicellulose (approximately 60% and 70% w/w dry mass). The optimum conditions for α-cellulose hydrolysis in the microwave reactors were 7.5% (w/v) phosphoric acid at a temperature of 160 °C, which resulted in a maximum yield of 60% of the total sugars with a reaction time of 5 min. When using a low acid concentration (0.4% w/v) for the hydrolysis, it was found that 10 g/100 g dry mass was formed which is an excellent yield when operating at low acid concentration. When hydrolyzing grass using the microwave reactor, the best identified conditions were an acid concentration of 2.5% (w/v) and 175 °C with a reaction time of 15 min, giving 18 g/100 g dry mass of total sugars, xylose being the sugar with the highest yield. Pentose sugars were more easily formed but also more easily degraded, these being highly affected by acid concentration and temperature.References
- A. Redding, Z. Wang, D. R. Keshwani and J. J. Cheng, High temperature dilute acid pretreatment of coastal Bermuda grass for enzymatic hydrolysis, Bioresour. Technol., 2011, 102, 1415–1424 CrossRef CAS.
- C. Cateto, G. Hu and A. Ragauskas, Enzymatic hydrolysis of organosolv kanlow switchgrass and its impact on cellulose crystallinity and degree of polymerization, Energy Environ. Sci., 2011, 4, 1516–1521 CAS.
- O. R. Inderwildi and D. A. King, Quo vadis biofuels, Energy Environ. Sci., 2009, 2, 343–346 CAS.
- Y. C. Lin and G. W. Huber, The critical role of heterogeneous catalysis in lignocellulosic biomass conversion, Energy Environ. Sci., 2009, 2, 68–80 CAS.
- C. Y. Chu, S. Y. Wu, C. Y. Tsai and C. Y. Lin, Kinetics of cotton cellulose hydrolysis using concentrated acid and fermentative hydrogen production from hydrolysate, Int. J. Hydrogen Energy, 2011, 36, 8743–8750 CrossRef CAS.
- G. Zhu, X. Zhu, Q. Fan and X. Wan, Production of reducing sugars from bean dregs waste by hydrolysis in subcritical water, J. Anal. Appl. Pyrolysis, 2011, 90, 182–186 CrossRef CAS.
- P. Lenihan, A. Orozco, E. O'Neill, M. N. M. Ahmad, D. W. Rooney and G. M. Walker, Dilute acid hydrolysis of lignocellulosic biomass, Chem. Eng. J., 2010, 156, 395–403 CrossRef CAS.
- S. H. Ha, N. L. Mai, G. An and Y. M. Koo, Microwave-assisted pretreatment of cellulose in ionic liquid for accelerated enzymatic hydrolysis, Bioresour. Technol., 2011, 102, 1214–1219 CrossRef CAS.
- R. Hu, L. Lin, T. Liu and S. Liu, Dilute sulfuric acid hydrolysis of sugar maple wood extract at atmospheric pressure, Bioresour. Technol., 2010, 101, 3586–3594 CrossRef CAS.
- S. Gámez, J. J. González-Cabriales, J. A. Ramírez, G. Garrote and M. Vázquez, Study of the hydrolysis of sugar cane bagasse using phosphoric acid, J. Food Eng., 2006, 74, 78–88 CrossRef.
- J. Cheng, H. Su, J. Zhou, W. Song and K. Cen, Microwave-assisted alkali pretreatment of rice straw to promote enzymatic hydrolysis and hydrogen production in dark- and photo-fermentation, Int. J. Hydrogen Energy, 2011, 36, 2093–2101 CrossRef CAS.
- A. De La Hoz, A. Díaz-Ortiz and A. Moreno, Microwaves in organic synthesis. Thermal and non thermal microwave effects, Chem. Soc. Rev., 2005, 34, 164–178 RSC.
- Z. Hu and Z. Wen, Enhancing enzymatic digestibility of switchgrass by microwave-assisted alkali pretreatment, Biochem. Eng. J., 2008, 38, 369–378 CrossRef CAS.
- S. Zhu, Y. Wu, Z. Yu, J. Liao and Y. Zhang, Pretreatment by microwave/alkali of rice straw and its enzymic hydrolysis, Process Biochem., 2005, 40, 3082–3086 CrossRef CAS.
- G. Bustos, R. J. Alberto, G. Garrote and M. Vázquez, Modeling of the Hydrolysis of Sugar Cane Bagasse with Hydrochloric Acid, Appl. Biochem. Biotechnol., 2003, 104, 51–68 CrossRef CAS.
- L. J. Boyer, J. L. Vega, K. T. Klasson, E. C. Clausen and J. L. Gaddy, The effect of furfural on ethanol production by saccharomyces cerevisiae in batch culture, Biomass Bioenergy, 1992, 3, 41–48 CrossRef CAS.
- M. J. Taherzadeh, L. Gustafsson, N. Niklasson and G. Liden, Physiological effects of 5-hydroxymethylfurfural on saccharomyces cerevisiae, Appl. Microbiol. Biotechnol., 2000, 53, 701–708 CrossRef CAS.
- J. F. Saeman, Kinetics of wood saccarification. hydrolysis of cellulose and decomposition of sugars in dilute acid at high temperature, Ind. Eng. Chem., 1945, 37, 43–52 CrossRef CAS.
- M. A. Brennan and C. E. Wyman. 2004. Initial evaluation of simple mass transfer models to describe hemicellulose hydrolysis in corn stover. Humana Press Inc, Totowa, NJ 07512-1165, United States Search PubMed.
- G. L. Guo, W. H. Chen, W. H. Chen, L. C. Men and W. S. Hwang, Characterization of dilute acid pretreatment of silvergrass for ethanol production, Bioresour. Technol., 2008, 99, 6046–6053 CrossRef CAS.
- M. Vazquez, M. Oliva, S. J. Tellez-Luis and J. A. Ramirez. Hydrolysis of sorghum straw using phosphoric acid: Evaluation of furfural production. 2007. Elsevier Ltd, Oxford, OX5 1GB, United Kingdom Search PubMed.
- S. J. Téllez-Luis, J. A. Ramírez and M. Vázquez, Mathematical modelling of hemicellulosic sugar production from sorghum straw, J. Food Eng., 2002, 52, 285–291 CrossRef.
- A. Rodríguez-Chong, A. Ramírez, G. Garrote and M. Vázquez, Hydrolysis of sugar cane bagasse using nitric acid: a kinetic assessment, J. Food Eng., 2004, 61, 143–152 CrossRef.
- A. Orozco, M. N. M. Ahmad, D. W. Rooney and G. M. Walker, Dilute acid hydrolysis of cellulose and cellulosic bio-waste using a microwave reactor system, Process Saf. Environ. Prot., 2007, 85, 446–449 CrossRef CAS.
- R. Aguilar, J. A. Ramírez, G. Garrote and M. Vázquez, Kinetic study of the acid hydrolysis of sugar cane bagasse, J. Food Eng., 2002, 55, 309–318 CrossRef.
- S. C. Yat, A. Berger and D. R. Shonnard, Kinetic characterization for dilute sulfuric acid hydrolysis of timber varieties and switchgrass, Bioresour. Technol., 2008, 99, 3855–3863 CrossRef CAS.
- J. R. Jensen, J. E. Morinelly, K. R. Gossen, M. J. Brodeur-Campbell and D. R. Shonnard, Effects of dilute acid pretreatment conditions on enzymatic hydrolysis monomer and oligomer sugar yields for aspen, balsam, and switchgrass, Bioresour. Technol., 2010, 101, 2317–2325 CrossRef CAS.
| This journal is © The Royal Society of Chemistry 2011 |